. 2015:2015:272954.
doi: 10.1155/2015/272954. Epub 2015 Oct 25.

Characterization of Electrograms from Multipolar Diagnostic Catheters during Atrial Fibrillation

Affiliations

Characterization of Electrograms from Multipolar Diagnostic Catheters during Atrial Fibrillation

Prasanth Ganesan et al. Biomed Res Int. 2015.

Abstract

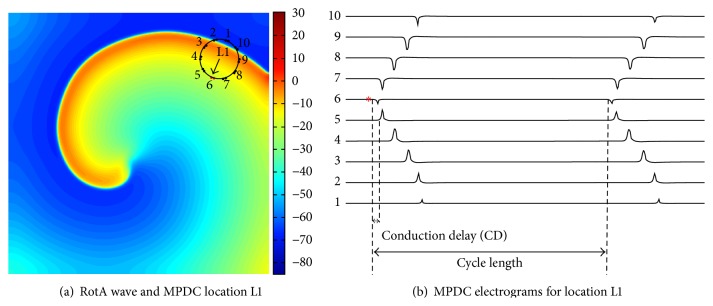
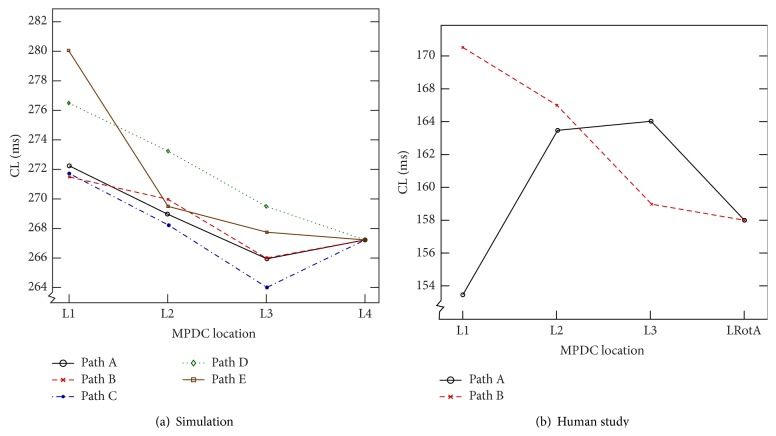
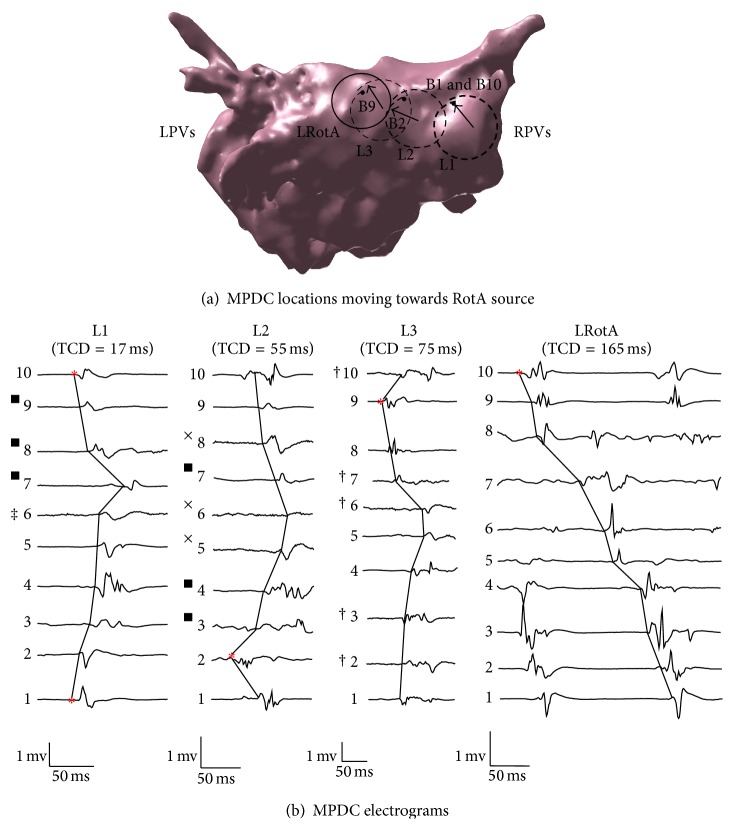
Atrial fibrillation (AF) is the most common arrhythmia in USA with more than 2.3 million people affected annually. Catheter ablation procedure is a method for treatment of AF, which involves 3D electroanatomic mapping of the patient's left atrium (LA) by maneuvering a conventional multipolar diagnostic catheter (MPDC) along the LA endocardial surface after which pulmonary vein (PV) isolation is performed, thus eliminating the AF triggers originating from the PVs. However, it remains unclear how to effectively utilize the information provided by the MPDC to locate the AF-sustaining sites, known as sustained rotor-like activities (RotAs). In this study, we use computer modeling to investigate the variations in the characteristics of the MPDC electrograms, namely, total conduction delay (TCD) and average cycle length (CL), as the MPDC moves towards a RotA source. Subsequently, a study with a human subject was performed in order to verify the predictions of the simulation study. The conclusions from this study may be used to iteratively direct an MPDC towards RotA sources thus allowing the RotAs to be localized for customized and improved AF ablation.


Figures

Figure 1
Figure 1
Computer simulation study: (a) RotA wave with the MPDC at location L1 which has the first activated bipole at bipole 6 indicated with the arrow pointing towards it. (b) The electrograms at location L1. The numbers at the left corner indicate the lead number of the corresponding bipole electrode and the asterisk denotes the first activated bipole (FAB). The conduction delay between bipole 5 and the FAB and the cycle length are indicated.
Figure 2
Figure 2
This diagram illustrates the FAB and TCD calculations for the electrograms recorded using an MPDC. Bipole 6 is the FAB and TCD is 94 ms, which is the sum of CD1 to CD10. AT: activation time. CD: conduction delay. All times are given in ms.
Figure 3
Figure 3
Simulation results: (a) L4 is the location of the known RotA source. The circles show the MPDC at the start point (L1) of each of Paths A to E; in every step of each path, the MPDC moves forward towards the RotA source; (b) the electrograms show the conduction pattern of path A from L1 to L4. The TCD increases from 106 ms to 228 ms, as reported on the top of each MPDC electrogram. The numbers at the left corner indicate the lead number of the corresponding bipole electrode of the MPDC.
Figure 4
Figure 4
Variation of total conduction delay. Variation in TCD with respect to the MPDC location: (a) In simulation study, the TCD shows an increasing gradient as the MPDC moves from L1 towards the RotA at L4, in all the paths. (b) The plot demonstrates the increasing gradient of TCD in the clinical study, in both Path A and Path B when the MPDC moves from L1 to LRotA, with the location of every successive step directed towards the first activated bipole of the current location.
Figure 5
Figure 5
Variation of average cycle length. Variation in average cycle length (CL) of the FAB with respect to the MPDC location: (a) In simulation study, the CL of Path D and Path E shows a decreasing gradient as the MPDC moves from L1 towards the RotA at L4. However, this decreasing gradient is not consistent in the other paths, where the CL decreases as the MPDC moves from L1 to L3 but increases at L4. (b) The plot demonstrates the inconsistent CL behavior observed in the clinical study. In Path A, the CL shows a decreasing gradient when the MPDC moves from L1 to LRotA, with the location of every successive step directed towards the FAB of the current location; however in Path B, the CL gradient is inconsistent; it increases as the MPDC moves from L1 to L3 with the location of every successive step directed towards the FAB of the current location, but it decreases at the location of RotA (i.e., LRotA).
Figure 6
Figure 6
Clinical study, Path A: (a) The dashed rings (L1, L2, and L3) show the location of MPDCs moving towards the RotA which is represented by a solid ring (LRotA); the direction of the first activated bipole is indicated in the figure with arrows and is B9, B7, and B8 for L1, L2, and L3, respectively. The filled circle represents bipole 1 of each MPDC. (b) A single cycle from the electrograms obtained at each of L1, L2, and L3 and LRotA are shown along with the corresponding TCD reported at the top of each electrogram and the first activated bipoles are indicated by the asterisks. The bipole electrode numbers 1 to 10 corresponding to each lead are indicated beside every bipole. RPVs: right pulmonary veins; LPVs: left pulmonary veins. † Voltage scaling decreased 4×. ‡ Voltage scaling decreased 2×.
Figure 7
Figure 7
Clinical study, Path B: (a) The dashed rings (L1, L2 and L3) are the location of MPDCs moving towards the RotA represented by a solid ring (LRotA); the first activated bipole is denoted by the corresponding bipole number and an arrow pointing to it. The solid ring indicates the location of the MPDC recording that encompasses the rotor source. ∗ represents bipole 1 of each MPDC. (b) A single cycle from the electrograms obtained at each of L1, L2, L3, and LRotA is shown along with the corresponding TCD reported at the top of each electrogram; the first activated bipole is indicated by the asterisks; the corresponding bipole electrode numbers 1 through 10 are indicated beside every bipole. RPVs: right pulmonary veins; LPVs: left pulmonary veins. ■ Voltage scaling decreased 2×. † Voltage scaling decreased 4×. ‡ Voltage scaling decreased 5×. × Voltage scaling decreased 6×.

References

    1. Go A., Mozaffarian D., Roger V., Benjamin E., Berry J. AHA statistical update. Circulation. 2013;127:e62–e245. - PMC - PubMed
    1. Jalife J., Berenfeld O., Skanes A., Mandapati R. Mechanisms of atrial fibrillation: mother rotors or multiple daughter wavelets, or both? Journal of Cardiovascular Electrophysiology. 1998;9(8, supplement):S2–S12. - PubMed
    1. Nattel S. New ideas about atrial fibrillation 50 years on. Nature. 2002;415(6868):219–226. doi: 10.1038/415219a. - DOI - PubMed
    1. Haïssaguerre M., Jaïs P., Shah D. C., et al. Spontaneous initiation of atrial fibrillation by ectopic beats originating in the pulmonary veins. The New England Journal of Medicine. 1998;339(10):659–666. doi: 10.1056/nejm199809033391003. - DOI - PubMed
    1. Vaquero M., Calvo D., Jalife J. Cardiac fibrillation: from ion channels to rotors in the human heart. Heart Rhythm. 2008;5(6):872–879. doi: 10.1016/j.hrthm.2008.02.034. - DOI - PMC - PubMed

Publication types

MeSH terms