. 2015 Dec 3;97(6):775-89.
doi: 10.1016/j.ajhg.2015.10.006. Epub 2015 Nov 12.

Leveraging Distant Relatedness to Quantify Human Mutation and Gene-Conversion Rates

Collaborators, Affiliations

Leveraging Distant Relatedness to Quantify Human Mutation and Gene-Conversion Rates

Pier Francesco Palamara et al. Am J Hum Genet. .

Abstract

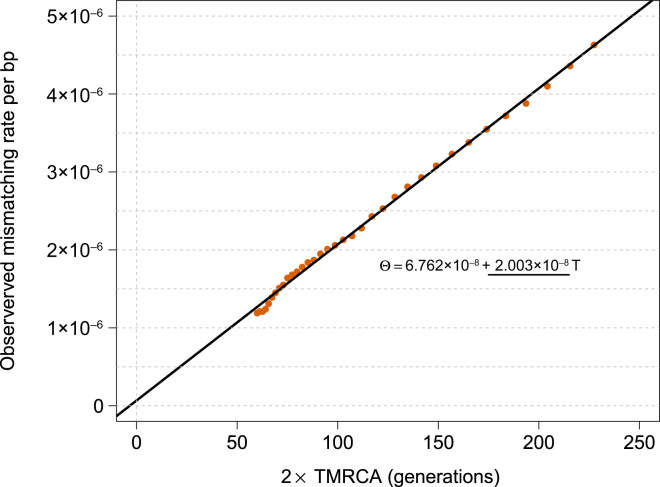
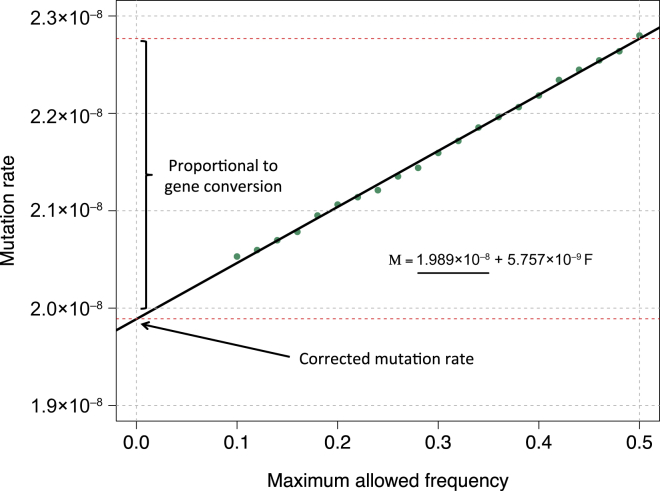
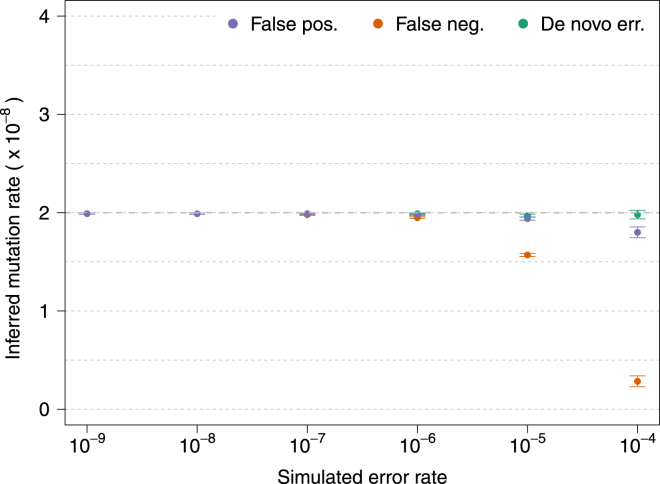
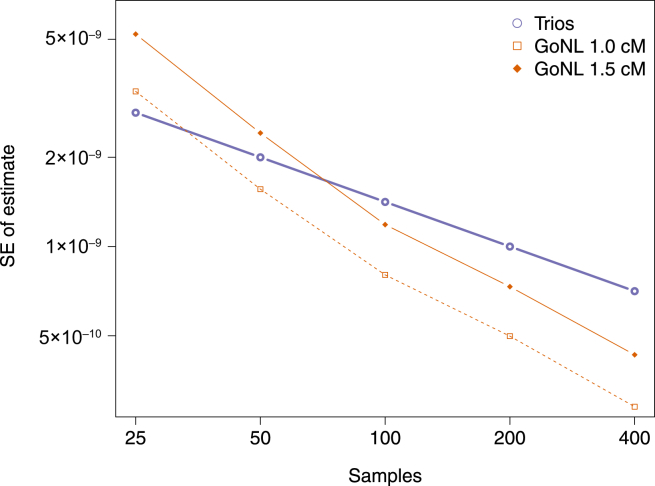
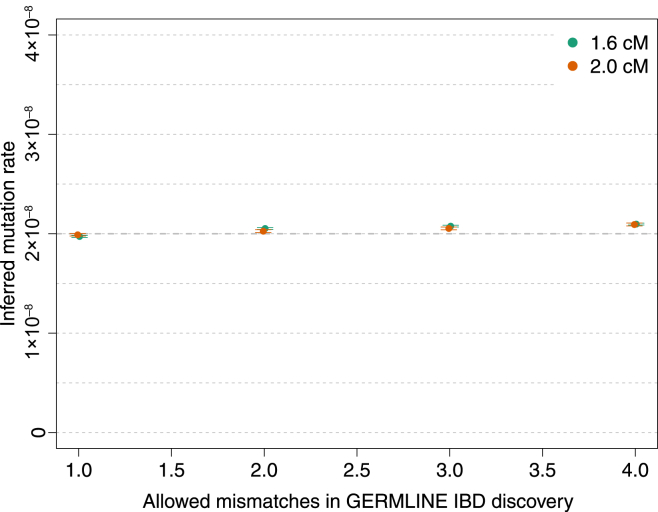
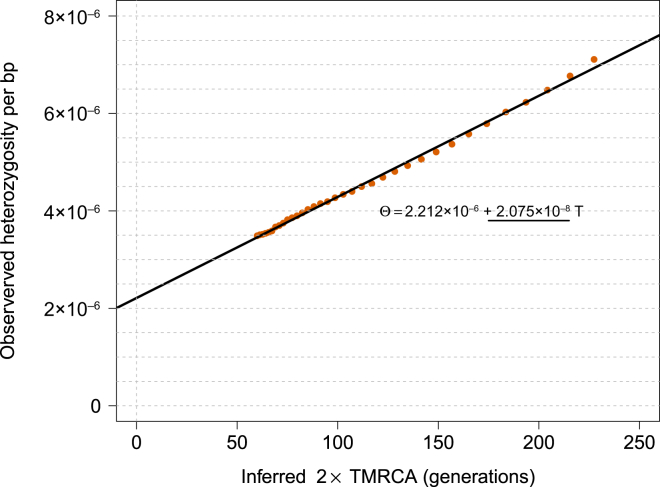
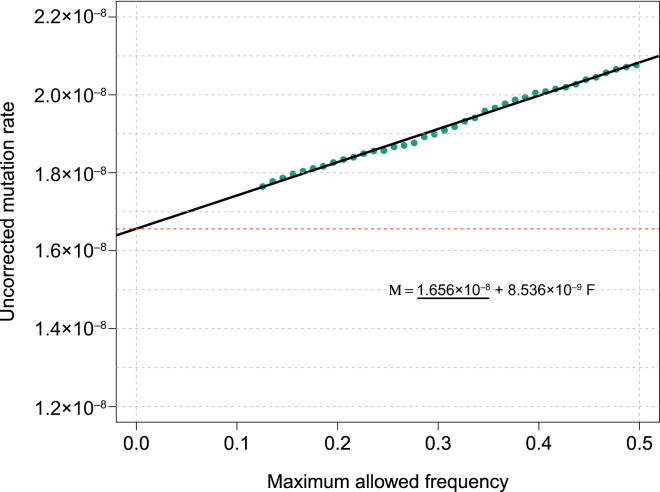
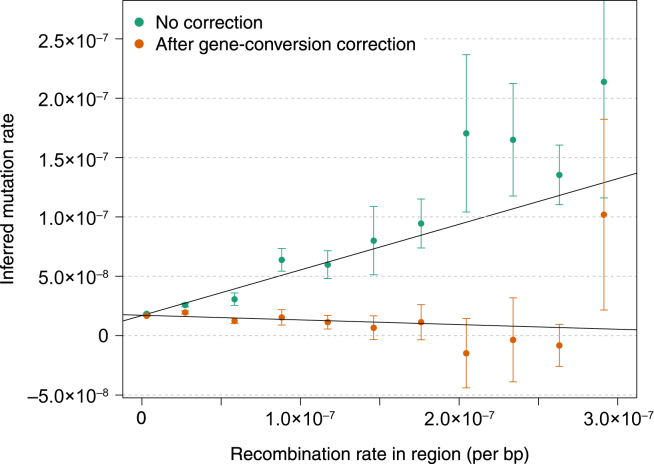
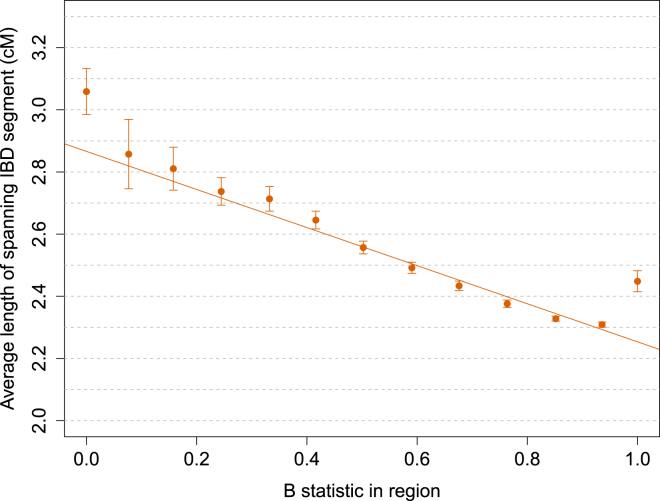
The rate at which human genomes mutate is a central biological parameter that has many implications for our ability to understand demographic and evolutionary phenomena. We present a method for inferring mutation and gene-conversion rates by using the number of sequence differences observed in identical-by-descent (IBD) segments together with a reconstructed model of recent population-size history. This approach is robust to, and can quantify, the presence of substantial genotyping error, as validated in coalescent simulations. We applied the method to 498 trio-phased sequenced Dutch individuals and inferred a point mutation rate of 1.66 × 10(-8) per base per generation and a rate of 1.26 × 10(-9) for <20 bp indels. By quantifying how estimates varied as a function of allele frequency, we inferred the probability that a site is involved in non-crossover gene conversion as 5.99 × 10(-6). We found that recombination does not have observable mutagenic effects after gene conversion is accounted for and that local gene-conversion rates reflect recombination rates. We detected a strong enrichment of recent deleterious variation among mismatching variants found within IBD regions and observed summary statistics of local sharing of IBD segments to closely match previously proposed metrics of background selection; however, we found no significant effects of selection on our mutation-rate estimates. We detected no evidence of strong variation of mutation rates in a number of genomic annotations obtained from several recent studies. Our analysis suggests that a mutation-rate estimate higher than that reported by recent pedigree-based studies should be adopted in the context of DNA-based demographic reconstruction.


Figures

Figure 1
Figure 1
tMRCA Regression We simulated a chromosome of 50 cM for 250 diploid samples by using μ = 2 × 10−8 for the mutation rate and no genotyping error. We matched the allele-frequency spectrum of the simulated samples to the spectrum found in real data for IBD-segment detection with GERMLINE, and we used the IBD-segment detection parameters used in real data. The slope of this regression captures the simulated mutation rate; the intercept is proportional to genotyping error rate.
Figure 2
Figure 2
MaAF-Threshold Regression We simulated 250 diploid samples as described in Figure 1 and a probability of 6 × 10−6 for a base pair to be involved in a non-crossover gene-conversion event. We performed the MaAF-threshold regression to correct for the occurrence of gene conversion. The regression intercept is used for estimating the corrected mutation rate, whereas the difference between the corrected and uncorrected mutation rates captures the effects of gene conversion, whose magnitude can be estimated with the observed population heterozygosity.
Figure 3
Figure 3
Inferred Mutation Rates under Several Values of Simulated Genotyping Error Rate for Three Types of Genotyping Errors The simulated true underlying mutation rate was μ = 2 × 10−8. All simulations involved a single chromosome of 250 cM for 200 haploid individuals from a GoNL-like population and used beta(α = 0.5, β = 1) as a prior for the allele frequency of erroneous variants. True IBD segments were extracted from the simulated ancestral recombination graph. Additional simulation results are shown in Figure S13. Error bars represent SE.
Figure 4
Figure 4
Comparison of the Estimated SE for Trios and tMRCA under Different Demographic Models and Minimum Cutoffs for IBD-Segment Length We report the estimated SD from the analysis of several simulations of a single 100 Mb chromosome. For illustrative purposes, we show results of analyses using IBD-length cutoffs of 1.0 and 1.5 cM. Analysis of the GoNL data used a length cutoff of 1.6 cM.
Figure 5
Figure 5
Inference of Gene-Conversion-Corrected Mutation Rate in Simulated Data We simulated a chromosome of 50 cM for 250 diploid samples by using μ = 2 × 10−8 for the mutation rate and a probability of 6 × 10−6 for a base pair to be involved in a non-crossover gene-conversion event. We matched the allele-frequency spectrum of the simulated samples to the spectrum found in real data for IBD-segment detection with GERMLINE. We used several values of the GERMLINE allowed mismatching sites (“-het”) to assess the impact of this parameter in the results. Negligible biases were observed for the recovered mutation rate. Error bars represent SE.
Figure 6
Figure 6
tMRCA Regression for Segments of Length ≥ 1.6 cM in the GoNL Dataset The obtained slope is used for estimating mutation rate per generation per base pair before the effects of gene conversion are accounted for.
Figure 7
Figure 7
MaAF-Threshold Regression for Segments of Length ≥ 1.6 cM in the GoNL Dataset We computed mutation rates for several allowed maximum-allele-frequency thresholds between 0.125 and 0.5 (green dots) and regressed the observed heterozygosity on the maximum allele frequency. The intercept of the resulting linear model reflects the corrected mutation-rate estimate.
Figure 8
Figure 8
Association between Recombination Rate and Mutation Rate We annotated the genome on the basis of uniform bins of recombination rate and estimated mutation rates for each obtained annotation. We observed a strong association between mutation and recombination rate before correcting for the occurrence of gene-conversion events. After applying the correction, we detected no significant association, which suggests that the linear relationship observed for the uncorrected estimates is induced by gene conversion (see Figure S22). Error bars represent SE.
Figure 9
Figure 9
Relationship between Region-Specific Values of the B Statistic and the Average Length of ≥1.6 cM IBD Segments Spanning the Regions Equally spaced bins of the B statistic were used. Reduced local effective population size has similar effects on the B statistic and the length of IBD haplotypes, which are longer in regions of strong background selection as a result of earlier average coalescent times between pairs of individuals. Error bars represent SE.

References

    1. Crow J.F. The origins, patterns and implications of human spontaneous mutation. Nat. Rev. Genet. 2000;1:40–47. - PubMed
    1. Arnheim N., Calabrese P. Understanding what determines the frequency and pattern of human germline mutations. Nat. Rev. Genet. 2009;10:478–488. - PMC - PubMed
    1. Samocha K.E., Robinson E.B., Sanders S.J., Stevens C., Sabo A., McGrath L.M., Kosmicki J.A., Rehnström K., Mallick S., Kirby A. A framework for the interpretation of de novo mutation in human disease. Nat. Genet. 2014;46:944–950. - PMC - PubMed
    1. McVicker G., Gordon D., Davis C., Green P. Widespread genomic signatures of natural selection in hominid evolution. PLoS Genet. 2009;5:e1000471. - PMC - PubMed
    1. Schaibley V.M., Zawistowski M., Wegmann D., Ehm M.G., Nelson M.R., St Jean P.L., Abecasis G.R., Novembre J., Zöllner S., Li J.Z. The influence of genomic context on mutation patterns in the human genome inferred from rare variants. Genome Res. 2013;23:1974–1984. - PMC - PubMed

Publication types