. 2015 Nov 22;282(1819):20151119.
doi: 10.1098/rspb.2015.1119.

Evolution of the additive genetic variance-covariance matrix under continuous directional selection on a complex behavioural phenotype

Affiliations

Evolution of the additive genetic variance-covariance matrix under continuous directional selection on a complex behavioural phenotype

Vincent Careau et al. Proc Biol Sci. .

Abstract

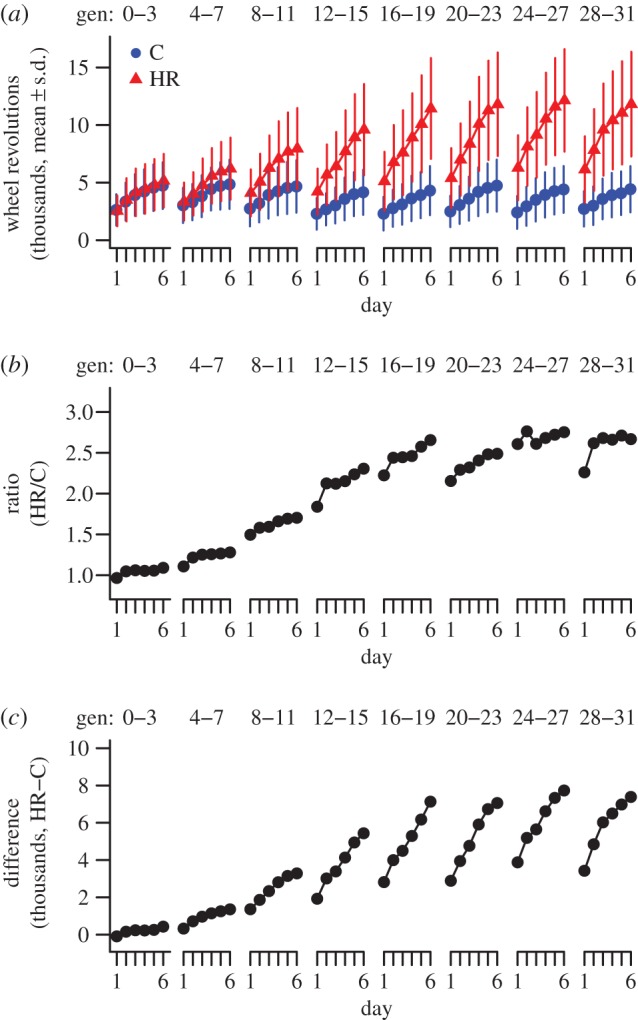
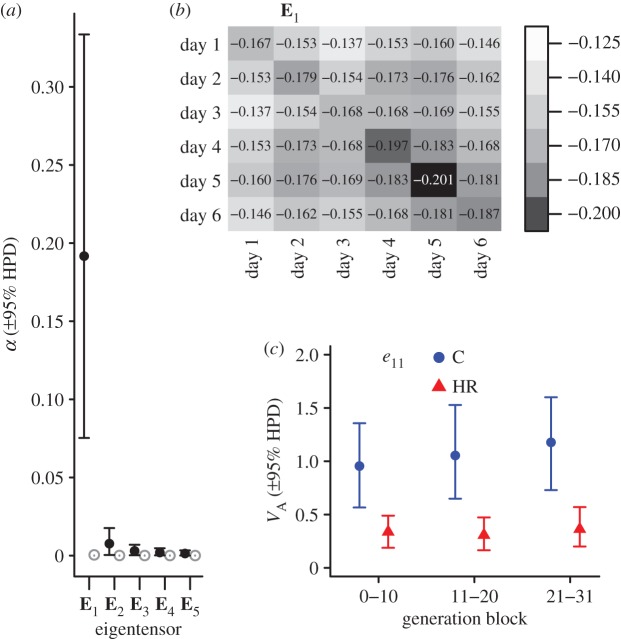
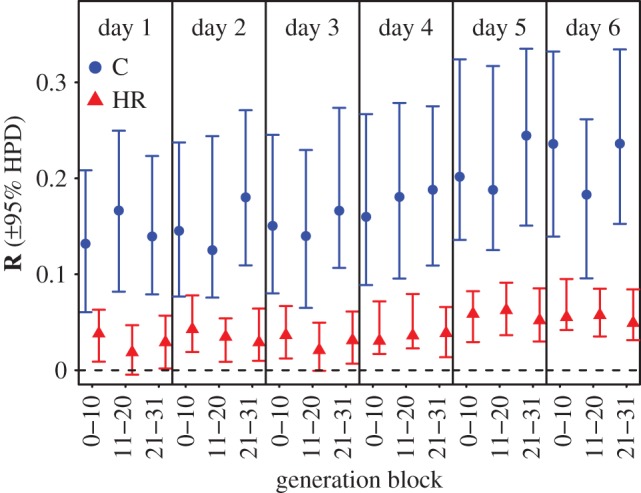
Given the pace at which human-induced environmental changes occur, a pressing challenge is to determine the speed with which selection can drive evolutionary change. A key determinant of adaptive response to multivariate phenotypic selection is the additive genetic variance-covariance matrix ( G: ). Yet knowledge of G: in a population experiencing new or altered selection is not sufficient to predict selection response because G: itself evolves in ways that are poorly understood. We experimentally evaluated changes in G: when closely related behavioural traits experience continuous directional selection. We applied the genetic covariance tensor approach to a large dataset (n = 17 328 individuals) from a replicated, 31-generation artificial selection experiment that bred mice for voluntary wheel running on days 5 and 6 of a 6-day test. Selection on this subset of G: induced proportional changes across the matrix for all 6 days of running behaviour within the first four generations. The changes in G: induced by selection resulted in a fourfold slower-than-predicted rate of response to selection. Thus, selection exacerbated constraints within G: and limited future adaptive response, a phenomenon that could have profound consequences for populations facing rapid environmental change.

Keywords: Bulmer effect; G-matrix; experimental evolution; genetic covariance tensor; selection limit; wheel running.


Figures

Figure 1.
Figure 1.
(a) Daily average number of wheel revolutions run (pooled means ± s.d. for four replicate lines in each selection group) over 6 days of wheel access in control (C) and selected (HR) mice, averaged over blocks of four generations (see also electronic supplementary material, figure S1). (b) Relative and (c) absolute difference in wheel running in C versus HR mice. (Online version in colour.)
Figure 2.
Figure 2.
(a) Variance (α; ±95% HPD intervals) accounted for by each eigentensor (En) for the observed (black dots) and randomized (grey dots) sets of G. Because the 95% HPD intervals of the observed versus randomized sets of G did not overlap for E1 and E2, these eigentensors described significantly more variation among the observed G than by chance. (b) ‘Heat map’ displaying the pattern of greatest variation among G matrices as captured by E1 (darker shading indicates greater variation among G matrices as measured by elements of E1, which reflect variance of the (co)variances among the six G matrices). Hence, variability among G matrices was distributed throughout the entire matrix, but was slightly more intense for trait combinations involving days 4–6 compared with those earlier in the day sequence. (c) The additive genetic variance (VA) in control (C) and selected (HR) mice along the direction of the first eigenvector of E1 (i.e. e11) across generation blocks. (Online version in colour.)
Figure 3.
Figure 3.
Predicted response to selection (R; in units of standard deviation) for wheel running on days 1–6 in control (C) and selected (HR) mice over different blocks of generations. The posterior modes and 95% HPD intervals incorporate the uncertainty from estimating both G (estimated separately for C and HR lines) and β (as estimated in HR lines). This figure shows the consequences of changes to G induced by directional selection (i.e. a large reduction in R in HR lines). However, for wheel running on days 5 and 6 (the selected traits), values of R were still significantly higher than zero even at the selection plateau (i.e. generations 21–31). (Online version in colour.)

Similar articles

Cited by

References

    1. Williams SE, Shoo LP, Isaac JL, Hoffmann AA, Langham G. 2008. Towards an integrated framework for assessing the vulnerability of species to climate change. PLoS Biol. 6, 2621–2626. (10.1371/journal.pbio.0060325) - DOI - PMC - PubMed
    1. Hoffmann AA, Sgro CM. 2011. Climate change and evolutionary adaptation. Nature 470, 479–485. (10.1038/nature09670) - DOI - PubMed
    1. Feder ME, Garland T Jr, Marden JH, Zera AJ. 2010. Locomotion in response to shifting climate zone: not so fast. Annu. Rev. Physiol. 72, 167–190. (10.1146/annurev-physiol-021909-135804) - DOI - PubMed
    1. Lande R. 1979. Quantitative genetic analysis of multivariate evolution, applied to brain: body size allometry. Evolution 33, 402–416. (10.2307/2407630) - DOI - PubMed
    1. Walsh B, Blows MW. 2009. Abundant genetic variation + strong selection = multivariate genetic constraints: a geometric view of adaptation. Annu. Rev. Ecol. Syst. 40, 41–59. (10.1146/annurev.ecolsys.110308.120232) - DOI

Publication types