

Comparison of Prediction Models for Lynch Syndrome Among Individuals With Colorectal Cancer
- PMID: 26582061
- PMCID: PMC4862416
- DOI: 10.1093/jnci/djv308
Comparison of Prediction Models for Lynch Syndrome Among Individuals With Colorectal Cancer
Abstract
Background: Recent guidelines recommend the Lynch Syndrome prediction models MMRPredict, MMRPro, and PREMM1,2,6 for the identification of MMR gene mutation carriers. We compared the predictive performance and clinical usefulness of these prediction models to identify mutation carriers.
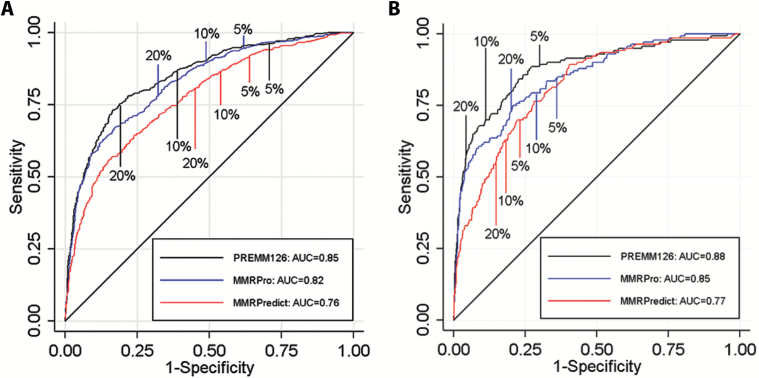
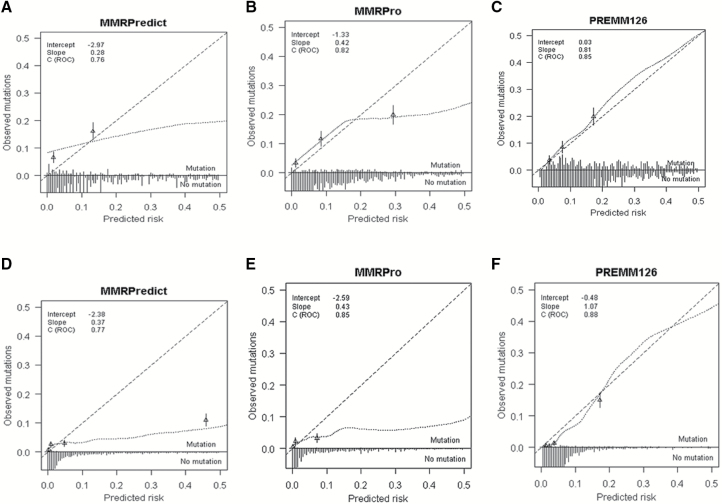
Methods: Pedigree data from CRC patients in 11 North American, European, and Australian cohorts (6 clinic- and 5 population-based sites) were used to calculate predicted probabilities of pathogenic MLH1, MSH2, or MSH6 gene mutations by each model and gene-specific predictions by MMRPro and PREMM1,2,6. We examined discrimination with area under the receiver operating characteristic curve (AUC), calibration with observed to expected (O/E) ratio, and clinical usefulness using decision curve analysis to select patients for further evaluation. All statistical tests were two-sided.
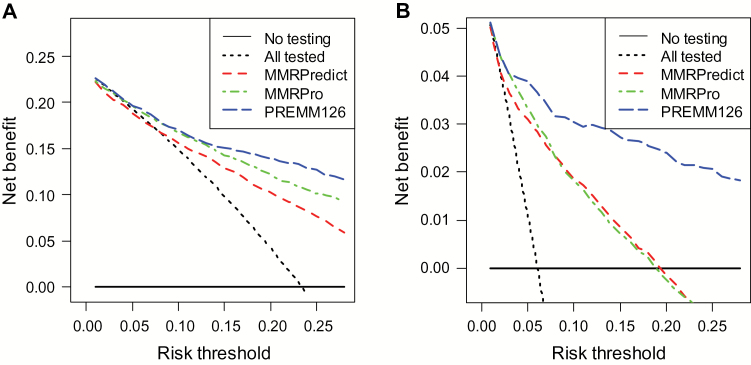
Results: Mutations were detected in 539 of 2304 (23%) individuals from the clinic-based cohorts (237 MLH1, 251 MSH2, 51 MSH6) and 150 of 3451 (4.4%) individuals from the population-based cohorts (47 MLH1, 71 MSH2, 32 MSH6). Discrimination was similar for clinic- and population-based cohorts: AUCs of 0.76 vs 0.77 for MMRPredict, 0.82 vs 0.85 for MMRPro, and 0.85 vs 0.88 for PREMM1,2,6. For clinic- and population-based cohorts, O/E deviated from 1 for MMRPredict (0.38 and 0.31, respectively) and MMRPro (0.62 and 0.36) but were more satisfactory for PREMM1,2,6 (1.0 and 0.70). MMRPro or PREMM1,2,6 predictions were clinically useful at thresholds of 5% or greater and in particular at greater than 15%.
Conclusions: MMRPro and PREMM1,2,6 can well be used to select CRC patients from genetics clinics or population-based settings for tumor and/or germline testing at a 5% or higher risk. If no MMR deficiency is detected and risk exceeds 15%, we suggest considering additional genetic etiologies for the cause of cancer in the family.
© The Author 2015. Published by Oxford University Press. All rights reserved. For Permissions, please e-mail: journals.permissions@oup.com.
Figures
References
-
- Hampel H, Frankel WL, Martin E, et al. Screening for the Lynch Syndrome (hereditary nonpolyposis colorectal cancer). N Engl J Med. 2005;352 (18):1851–1860. - PubMed
-
- Bonadona V, Bonaïti B, Olschwang S, et al. Cancer Risks Associated with Germline Mutations in MLH1, MSH2, and MSH6 Genes in Lynch Syndrome. JAMA. 2011;305 (22):2304–2310. - PubMed
-
- Lindor NM, Petersen GM, Hadley DW, et al. Recommendations for the Care of Individuals with an Inherited Predisposition to Lynch Syndrome: A Systematic Review. JAMA. 2006;296 (12):1507–1517. - PubMed
Publication types
MeSH terms
Substances
Grants and funding
- K24 CA113433/CA/NCI NIH HHS/United States
- U01 CA074799/CA/NCI NIH HHS/United States
- P30 CA015704/CA/NCI NIH HHS/United States
- R01 CA132829/CA/NCI NIH HHS/United States
- K07 CA151769/CA/NCI NIH HHS/United States
- U01 CA074794/CA/NCI NIH HHS/United States
- P30 CA015083/CA/NCI NIH HHS/United States
- U01 CA097735/CA/NCI NIH HHS/United States
- K07 CA151769-02/CA/NCI NIH HHS/United States
- K05 CA152715/CA/NCI NIH HHS/United States
- UM1 CA167551/CA/NCI NIH HHS/United States
- U01 CA074783/CA/NCI NIH HHS/United States
- U01 CA074806/CA/NCI NIH HHS/United States
- U01 CA074800/CA/NCI NIH HHS/United States
LinkOut - more resources
Full Text Sources
Other Literature Sources
Medical
Miscellaneous
