. 2016 Jan 15;291(3):1456-71.
doi: 10.1074/jbc.M115.692012. Epub 2015 Nov 18.

Two Na+ Sites Control Conformational Change in a Neurotransmitter Transporter Homolog

Affiliations

Two Na+ Sites Control Conformational Change in a Neurotransmitter Transporter Homolog

Sotiria Tavoulari et al. J Biol Chem. .

Abstract

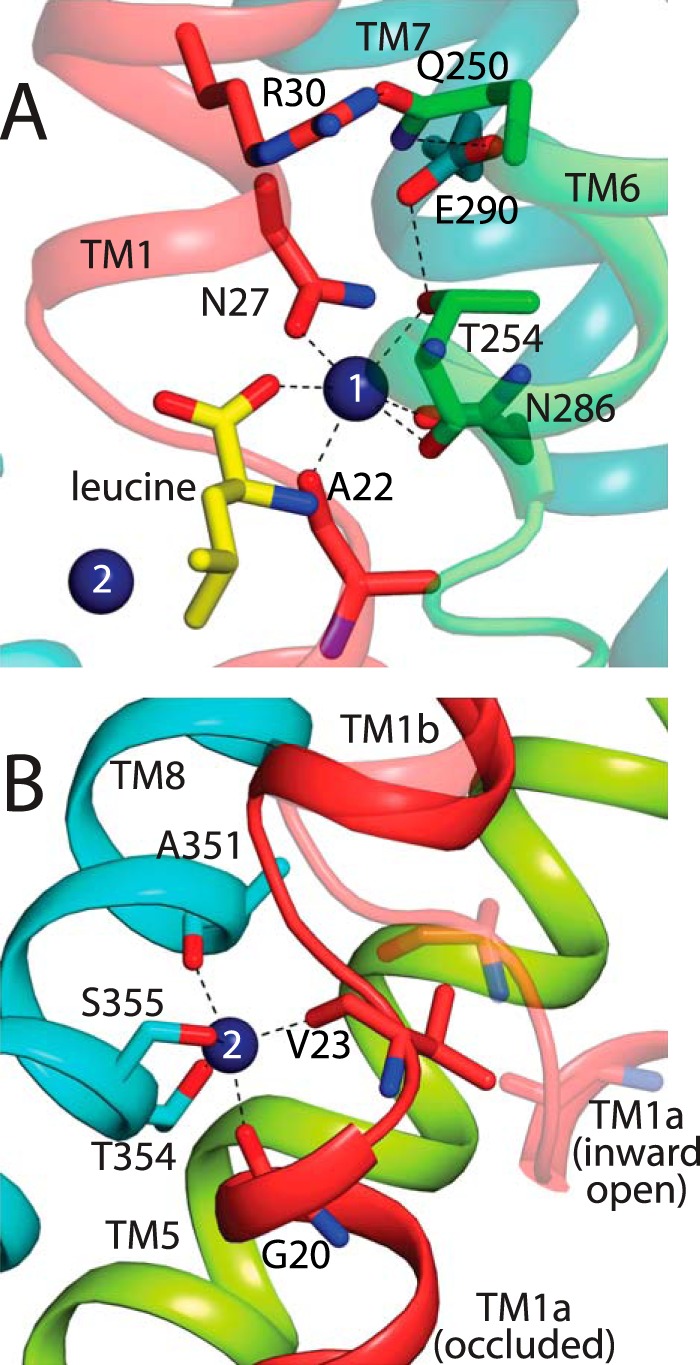
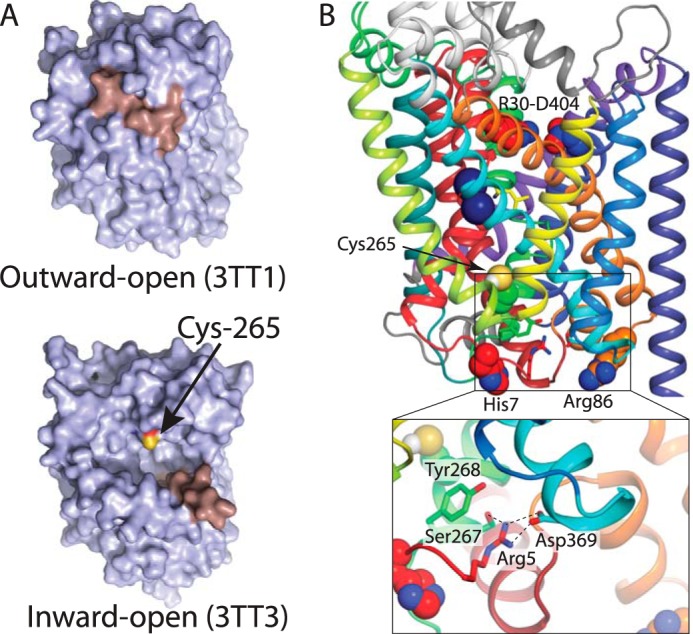
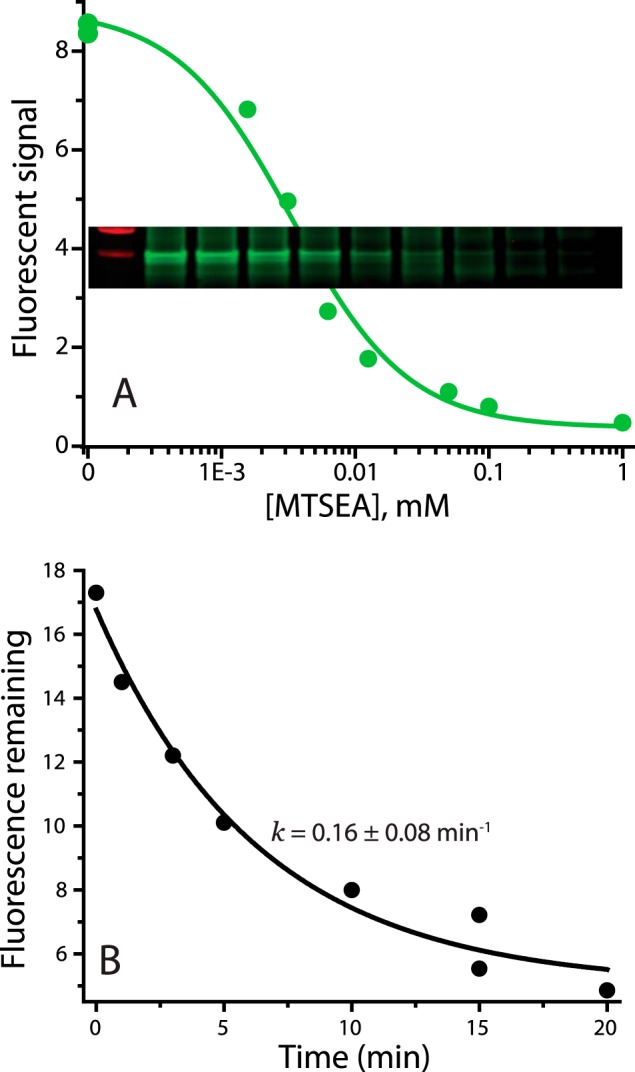
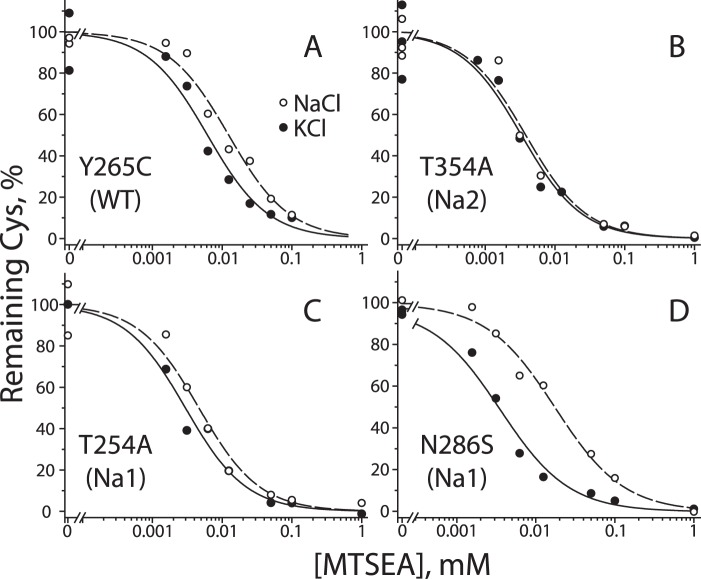
In LeuT, a prokaryotic homolog of neurotransmitter transporters, Na(+) stabilizes outward-open conformational states. We examined how each of the two LeuT Na(+) binding sites contributes to Na(+)-dependent closure of the cytoplasmic pathway using biochemical and biophysical assays of conformation. Mutating either of two residues that contribute to the Na2 site completely prevented cytoplasmic closure in response to Na(+), suggesting that Na2 is essential for this conformational change, whereas Na1 mutants retained Na(+) responsiveness. However, mutation of Na1 residues also influenced the Na(+)-dependent conformational change in ways that varied depending on the position mutated. Computational analyses suggest those mutants influence the ability of Na1 binding to hydrate the substrate pathway and perturb an interaction network leading to the extracellular gate. Overall, the results demonstrate that occupation of Na2 stabilizes outward-facing conformations presumably through a direct interaction between Na(+) and transmembrane helices 1 and 8, whereas Na(+) binding at Na1 influences conformational change through a network of intermediary interactions. The results also provide evidence that N-terminal release and helix motions represent distinct steps in cytoplasmic pathway opening.

Keywords: alternating access; conformational change; coupling; membrane transport; molecular dynamics; neurotransmitter; single-molecule biophysics; sodium; transport.


Figures

FIGURE 1.
FIGURE 1.
Side chains contributing to Na+ sites in LeuT. A, Na1 site, viewed from the extracellular surface of LeuT, is formed by side chains from Asn-27 in TM1, Thr-254 in TM6, and Asn-286 in TM7. In addition, Na1 includes the substrate carboxyl group and main chain carbonyls from Ala-22 and Thr-254 (6). Proximal residues Glu-290 from TM7, Gln-250 from TM6, and Arg-30 from TM1 are also shown. B, Na2 site, viewed from within the membrane plane, is formed by side chains from Thr-354 and Ser-355 in TM8. In addition, Na2 includes the main chain carbonyls of Gly-20 and Val-23 in TM1 and Ala-351 in TM8 (6). TM1 is shown in two positions, the occluded state in red (6) and in an inward-open conformation in transparent salmon (47). The separation between TMs 1 and 8 found in the inward-open LeuT structure (PDB code 3TT3) (9) is even larger than shown here for an inward-open model, possibly reflecting the detergent/lipid environment in the crystal (21).
FIGURE 2.
FIGURE 2.
Location of key residues. A, view of the LeuT cytoplasmic surface in the outward-open conformation (PDB code 3TT1) (top) (9) and in an inward-open conformation (PDB code 3TT3) (bottom) (9). The sulfhydryl of Cys-265 is labeled yellow and is accessible to the cytoplasm in the inward-open but not in the occluded structure. TM1 is shown in salmon. B, structure of occluded LeuT (PDB code 2A65) (6), viewed from within the plane of the membrane. The position of Cys-265 in the cytoplasmic pathway is indicated as spheres, below the bound substrate (yellow sticks) and Na+ (blue spheres) and above the cytoplasmic face of LeuT. The position of His-7 and Arg-86 on the N terminus and intracellular loop 1, respectively, are also shown as spheres. The side chains of the intracellular network composed of Ser-267, Tyr-268, Arg-5, and Asp-369 are shown as sticks and in detail in the inset. The color code for transmembrane helices is as follows: TM1, red; TM2, firebrick; TM3, orange; TM4, yellow; TM5, lime; TM6, green; TM7, turquoise; TM8, cyan; TM9, light blue; TM10, deep blue; TM11, purple; TM 12, violet.
FIGURE 3.
FIGURE 3.
Accessibility assay. A, accessibility assay, raw data. Pretreatment of membranes from E. coli expressing LeuT Y265C with the indicated concentrations of MTSEA for 15 min decreased the extent of subsequent labeling with Alexa Fluor 750 C5 maleimide as described under “Experimental Procedures.” Inset, fluorescence results from gel scan on Li-Cor Odyssey imager. Green circles, line, quantification of band intensities. B, decrease in Alexa Fluor 750 labeling of LeuT Y265C resulting from incubation with 25 μm MTSEA for the indicated times. This MTSEA concentration leads to inactivation of most of the labeling capacity within 15 min. The data were fit as an exponential decay plus a constant for background fluorescence.
FIGURE 4.
FIGURE 4.
Effect of Na+ on conformation of LeuT WT and Na+ site mutants as measured by cytoplasmic pathway accessibility. Membranes from E. coli cells expressing LeuT Na+ mutants were treated with a range of MTSEA concentrations in the presence (open circles) or absence (filled circles) of Na+. The membranes were then solubilized, and denatured and unreacted cysteine residues were labeled with Alexa Fluor 750 C5 maleimide as described in detail under “Experimental Procedures.” The cysteine accessibility results are expressed as percentage of maximal labeling with Alexa Fluor 750 C5 maleimide (without MTSEA) for the Y265C background construct (A); Na2 mutant T354A (B); Na1 mutant T254A (C); and Na1 mutant N286S (D). These are representative experiments that were repeated 5–8 times with similar results.
FIGURE 5.
FIGURE 5.
Effect of Na+ on conformation of LeuT WT and Na+ site mutants as measured by a shift in distribution between low and high FRET efficiency populations. Na1 and Na2 mutations were made in a LeuT background construct H7C-R86C and labeled with Alexa Fluor 488 and 594 maleimides. A, H7C-R86C (WT), a histogram showing the distribution of FRET states in the presence (filled bars) and absence (empty bars) of Na+. The peak centered around 0.8 represents inward-closed conformations in which the fluorophore on Cys-7 is close to the one on Cys-86, and the peak near 0.4 represents inward-open conformations in which the two fluorophores are separated. B, distribution of the Na2 mutant S355A between conformational states was not shifted by Na+. C and D, Na+ induced a shift in distribution in the Na1 site mutants T254A and N286S that was smaller than the shift induced in WT LeuT. A larger proportion of molecules was found in inward-open (low FRET efficiency) conformations in S355A and T254A (B and C) relative to WT and N286S (A and D). The distributions were fitted to three peaks at high, low, and zero efficiency (from imperfectly labeled protein) in the presence (dashed line) and absence (solid line) of Na+.
FIGURE 6.
FIGURE 6.
Summarized Na+-dependent conformational changes. A, accessibility results. Cysteine accessibility measurements were used to calculate pseudo-first order rate constants for the MTSEA reaction from the IC50 values in Na+ and K+ and the incubation time. The rate constant in Na+ as a fraction of the rate constant in K+ was calculated for each experiment, and the results presented are the means of 5–8 experiments, with error bars showing the standard errors. Values significantly different from WT (p < 0.05) are indicated with asterisks. B, smFRET results. From equilibrium constants for the distribution between low and high FRET efficiency states (representing open and closed N-terminal position, respectively) in NaCl versus KCl, the ratio (KeqNa/KeqK) was calculated for each of 3–5 experiments with each mutant. A ratio of 1 indicates that Na+ did not change the Keq, and a ratio of <1 indicates that Na+ shifted the distribution toward the high efficiency peak representing the closed N-terminal position. Each bar represents the mean ± S.E. of ratios from 3 to 5 experiments using at least two independent LeuT preparations, and the asterisks represent values that are significantly different from WT (p < 0.05). For the difference between WT and N27S, the unpaired two-sample t test indicated a p value of 0.083.
FIGURE 7.
FIGURE 7.
Rate constants and equilibrium constants (absolute values) summarized over all experiments. A, rates of cytoplasmic pathway modification for LeuT WT and sodium site mutants in Na+ and K+. We used the IC50 value from cysteine accessibility data (as in Fig. 4) and the time of incubation to calculate a pseudo-first order rate constant for the MTSEA reaction. For LeuT mutants in which Na+ decreased accessibility, such as Y265C (WT), the modification rate in Na+ (light gray bars) was less than the rate in K+ (dark gray bars). The data represent the mean of rate constants determined in 5–8 individual experiments, with error bars representing the standard errors. Asterisks indicate mutants for which the rate with Na+ was significantly lower than that with K+ (p > 0.05). The p value for T254A was 0.06. The variability in the individual rates was greater than for the Na+/K+ ratios (Fig. 6A) because of variations between experiments that affected both rates. There was a high degree of correlation between the Na+ and K+ rates in different experiments as evidenced by Pearson product-moment correlation coefficients of 0.80, 0.76, 0.78, 0.36, 0.81, and 0.57 for WT, T354A, S355A, N27S, T254A, and N286S, respectively. B, conformational equilibria determined from smFRET measurements in LeuT WT and sodium site mutants in Na+ and K+. From the areas (A) under the fitted peaks for low and high FRET efficiency as shown in Fig. 5, equilibrium constants were calculated as Alow/Ahigh. The ability of Na+ to decrease the Keq for LeuT WT (Y265C) was completely blocked by mutation of the Na2 residue Ser-355 and decreased by mutation of Na1 residues Asn-27, Thr-254, and Asn-286. The data presented are means of equilibrium constants determined in 3–5 individual experiments with error bars showing the S.E. Asterisks indicate mutants for which the Keq with Na+ was significantly lower than that with K+ (p < 0.001). The p value for N27S was 0.128. Na+ site mutant Keq values in the absence of Na+ all differed significantly from WT (p < 0.002).
FIGURE 8.
FIGURE 8.
Na+ coordination at WT and mutant Na1 sites in outward-open LeuT. Distances between Na+ and coordinating oxygen atoms in Na1 were computed from MD simulations of WT (A), N27S (B), T254A (C), and N286S (D) LeuT and are plotted as a normalized distribution. Distances were measured to water oxygen (purple), the backbone oxygen atom of Ala-22 (black), or Thr-254 (green) and the side chain oxygen atom of Asn-27/Ser-27 (red) or Asn-286/Ser-286 (cyan). For N286S, sections of the trajectories in which the ion was no longer bound (all oxygen-Na+ distances >3.2 Å) were excluded from the analysis. The distance to the Glu-290 side chain was determined using the minimum distance to either carboxyl O atom (orange). Insets show representative snapshots of the side chains that contribute to Na1 in WT LeuT, as well as the network of interactions connecting Na1 to the Arg-30–Asp-404 salt bridge in the extracellular pathway.
FIGURE 9.
FIGURE 9.
Changes in salt bridge and hydrogen bond propensity in the extracellular pathway of LeuT WT and Na1 mutants. The prevalence of specific side-chain interactions is shown as the percentage of the simulation time that atoms are within a cutoff distance for the following: A, Arg-30–Asp-404 salt bridge, defined as terminal side-chain C atoms <5.5 Å (for direct interactions) and the presence of a common water molecule that hydrogen-bonds with both Arg-30 and Asp-404 simultaneously (for water-mediated interactions). The dashed and dotted lines in A–C represent direct (non-water-mediated) interactions for the WT-occluded and -open simulations, respectively. B, Arg-30–Gln-250 hydrogen bonds, defined as the minimum amine hydrogen to amide oxygen distance <2.8 Å, and C, Gln-250–Glu-290 hydrogen bonds, defined as the minimum amide hydrogen to terminal oxygen distance <3 Å. The same definition of water-mediated contacts was used as for Arg-30–Asp-404. For N286S, sections of the trajectories in which the ion was no longer bound (all oxygen-Na+ distances >3.2 Å), were excluded from the analysis.

References

    1. Quick M., Yano H., Goldberg N. R., Duan L., Beuming T., Shi L., Weinstein H., and Javitch J. A. (2006) State-dependent conformations of the translocation pathway in the tyrosine transporter Tyt1, a novel neurotransmitter:sodium symporter from Fusobacterium nucleatum. J. Biol. Chem. 281, 26444–26454 - PubMed
    1. Zhao Y., Terry D., Shi L., Weinstein H., Blanchard S. C., and Javitch J. A. (2010) Single-molecule dynamics of gating in a neurotransmitter transporter homologue. Nature 465, 188–193 - PMC - PubMed
    1. Claxton D. P., Quick M., Shi L., de Carvalho F. D., Weinstein H., Javitch J. A., and McHaourab H. S. (2010) Ion/substrate-dependent conformational dynamics of a bacterial homolog of neurotransmitter:sodium symporters. Nat. Struct. Mol. Biol. 17, 822–829 - PMC - PubMed
    1. Zhao Y., Terry D. S., Shi L., Quick M., Weinstein H., Blanchard S. C., and Javitch J. A. (2011) Substrate-modulated gating dynamics in a Na+-coupled neurotransmitter transporter homologue. Nature 474, 109–113 - PMC - PubMed
    1. Kazmier K., Sharma S., Quick M., Islam S. M., Roux B., Weinstein H., Javitch J. A., and McHaourab H. S. (2014) Conformational dynamics of ligand-dependent alternating access in LeuT. Nat. Struct. Mol. Biol. 21, 472–479 - PMC - PubMed

Publication types

MeSH terms

LinkOut - more resources