. 2016 Jan 15;291(3):1221-34.
doi: 10.1074/jbc.M115.677682. Epub 2015 Nov 18.

Lifeguard Inhibits Fas Ligand-mediated Endoplasmic Reticulum-Calcium Release Mandatory for Apoptosis in Type II Apoptotic Cells

Affiliations

Lifeguard Inhibits Fas Ligand-mediated Endoplasmic Reticulum-Calcium Release Mandatory for Apoptosis in Type II Apoptotic Cells

Jorge Urresti et al. J Biol Chem. .

Abstract

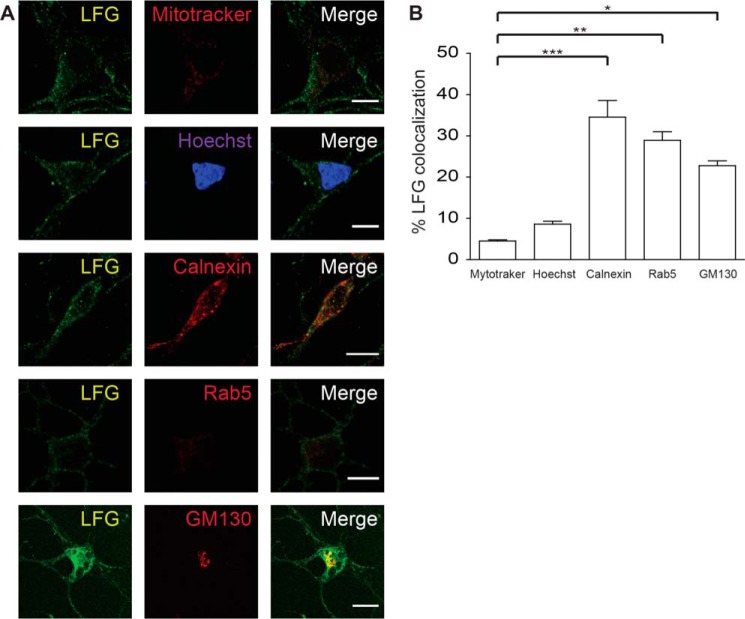
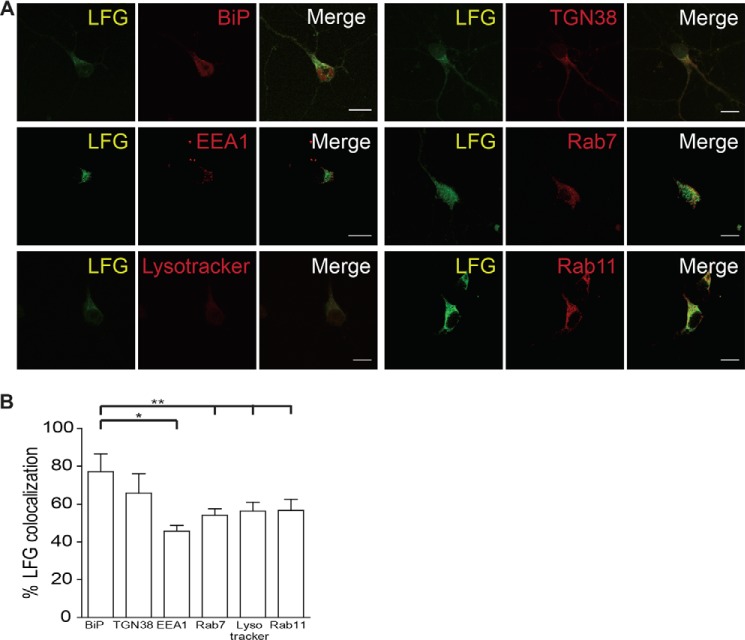
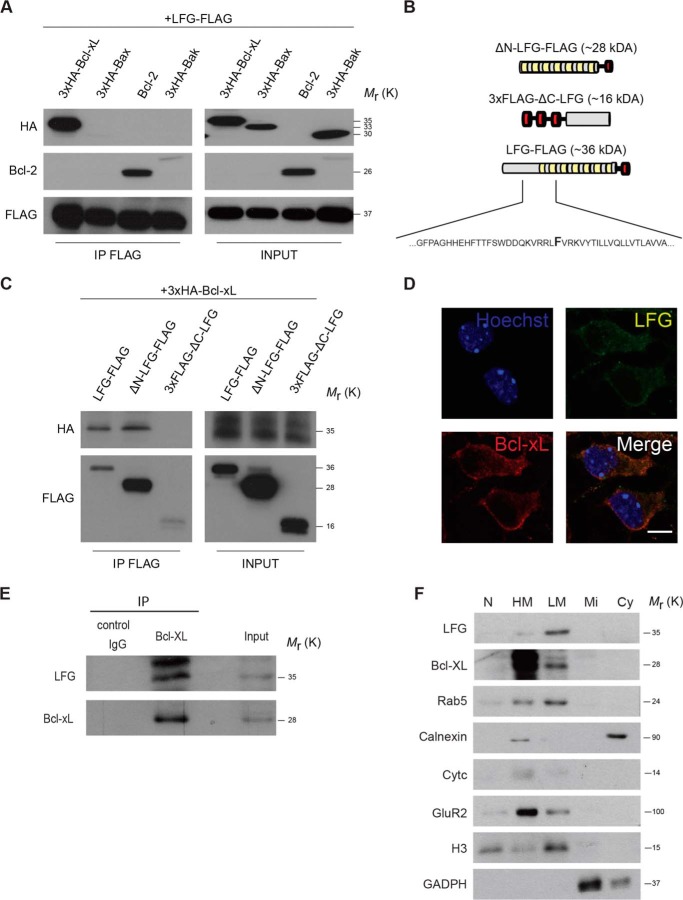
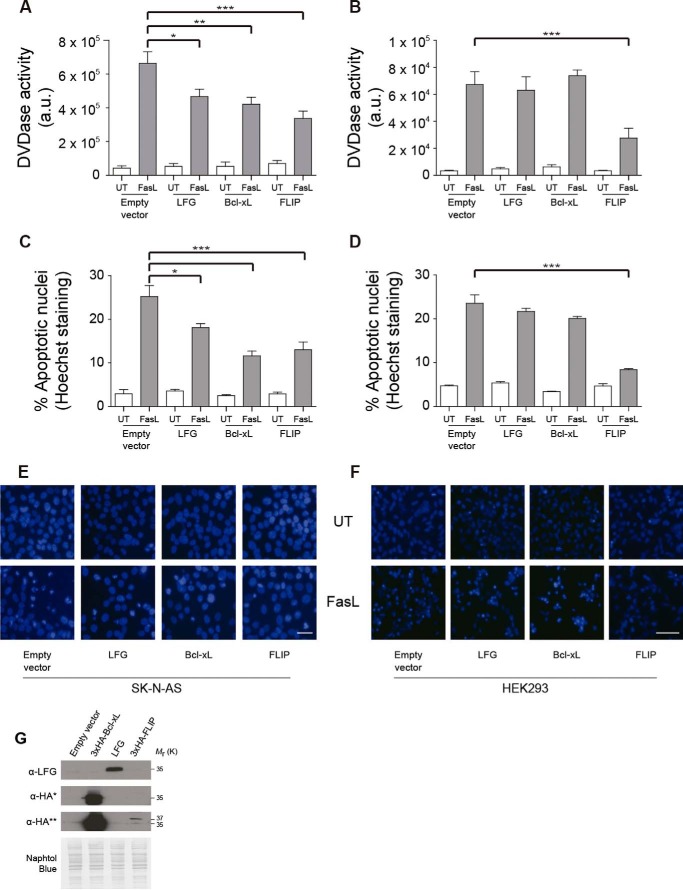
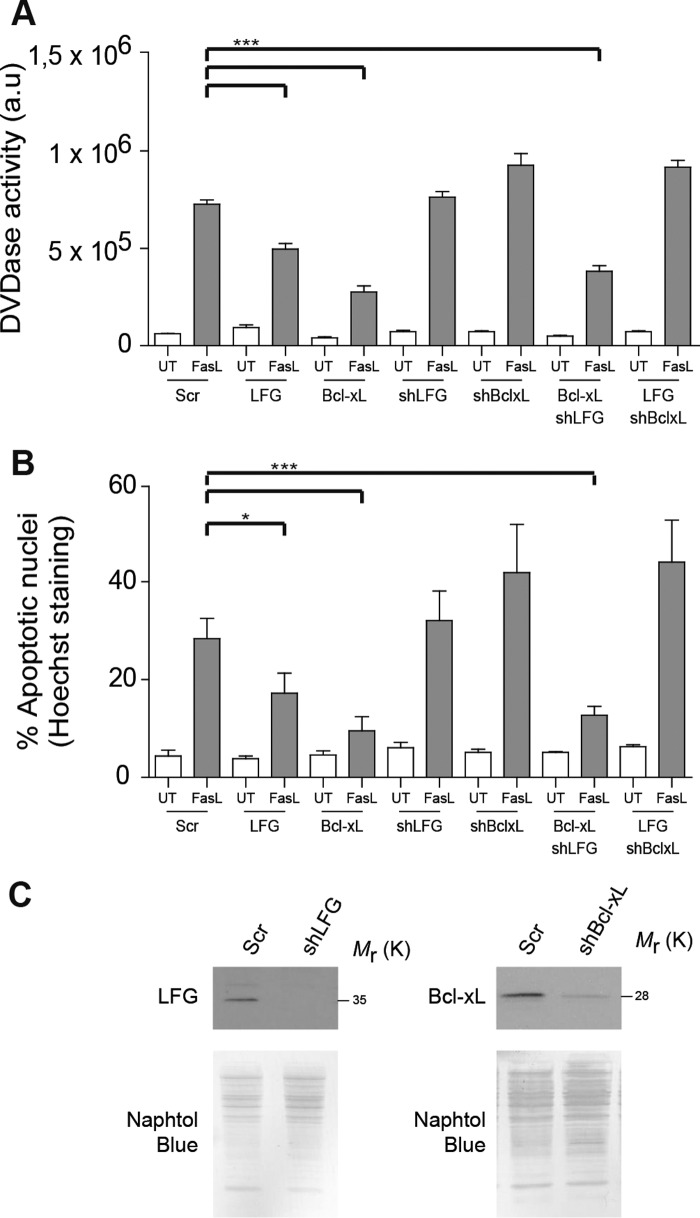
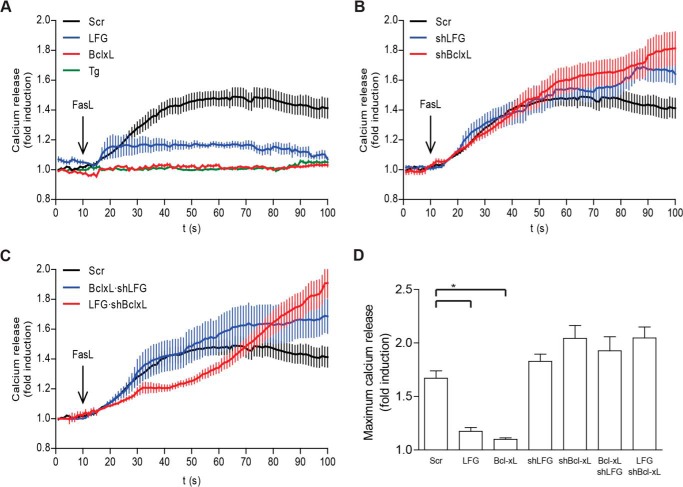
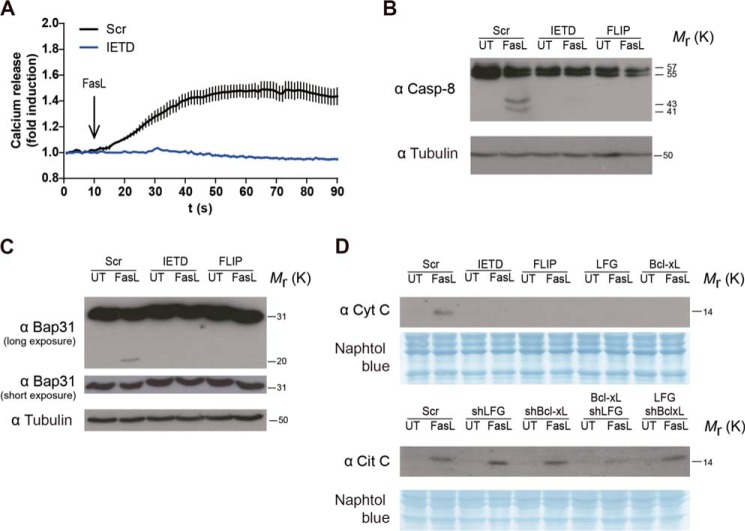
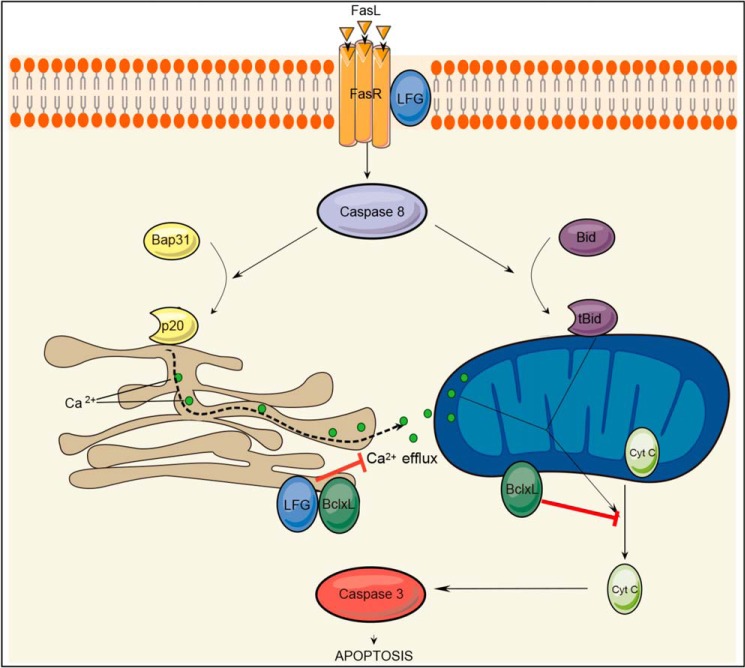
Death receptors are members of the tumor necrosis factor receptor superfamily involved in the extrinsic apoptotic pathway. Lifeguard (LFG) is a death receptor antagonist mainly expressed in the nervous system that specifically blocks Fas ligand (FasL)-induced apoptosis. To investigate its mechanism of action, we studied its subcellular localization and its interaction with members of the Bcl-2 family proteins. We performed an analysis of LFG subcellular localization in murine cortical neurons and found that LFG localizes mainly to the ER and Golgi. We confirmed these results with subcellular fractionation experiments. Moreover, we show by co-immunoprecipitation experiments that LFG interacts with Bcl-XL and Bcl-2, but not with Bax or Bak, and this interaction likely occurs in the endoplasmic reticulum. We further investigated the relationship between LFG and Bcl-XL in the inhibition of apoptosis and found that LFG protects only type II apoptotic cells from FasL-induced death in a Bcl-XL dependent manner. The observation that LFG itself is not located in mitochondria raises the question as to whether LFG in the ER participates in FasL-induced death. Indeed, we investigated the degree of calcium mobilization after FasL stimulation and found that LFG inhibits calcium release from the ER, a process that correlates with LFG blockage of cytochrome c release to the cytosol and caspase activation. On the basis of our observations, we propose that there is a required step in the induction of type II apoptotic cell death that involves calcium mobilization from the ER and that this step is modulated by LFG.

Keywords: CD95 (APO-1/Fas); apoptosis; calcium; endoplasmic reticulum (ER); neuron.


Figures

FIGURE 1.
FIGURE 1.
LFG subcellular localization. A, representative confocal images of cortical neurons. Cortical neurons were fixed, permeabilized, and immunostained with anti-LFG (green), Mitotracker (mitochondria marker), Hoechst (nucleus marker), anti-calnexin (ER marker), anti-Rab5 (early endosome marker), and anti-GM130 (Golgi marker) (red). The third column shows a merge of the green and red channels. Scale bar, 10 μm. B, Manders' co-localization coefficients for LFG are shown as percentage of LFG co-localization with each marker (one-way ANOVA test). ***, p ≤ 0.001; **, p ≤ 0.005; *, p ≤ 0.05). The values of all Manders' co-localization coefficients and Pearson correlation coefficients for each condition are detailed under “Results.”
FIGURE 2.
FIGURE 2.
LFG is localized in the endocytic pathway. A, representative confocal images of cortical neurons. Cells were fixed, permeabilized, and immunostained with anti-LFG (green) and different elements of the endocytic pathway: anti-BiP (ER marker), anti-TGN38 (trans-Golgi network marker), anti-EEA1 (early endosomes marker), anti-Rab7 (late endosome marker), Lysotracker (lysosomal marker), and anti-Rab11 (recycling endosome marker) (red). The third column shows a merge of the green and red channels. Scale bar, 10 μm. B, Manders' co-localization coefficients for LFG are shown as percentages of LFG co-localization with each marker (one-way ANOVA test). **, p ≤ 0.005; *, p ≤ 0.05. The values of all Manders' co-localization coefficients and Pearson correlation coefficients for each condition are detailed under “Results.”
FIGURE 3.
FIGURE 3.
LFG interacts with Bcl-XL. A, HEK293T cells were transfected with LFG-FLAG expression plasmid and co-transfected with 3×HA-Bcl-XL, Bcl-2, 3×HA-Bax, or 3×HA-Bad as indicated. FLAG-tagged proteins were immunoprecipitated from whole cell extracts with anti-FLAG resin, followed by immunoblotting HA, Bcl-2, and FLAG antibodies. B, schematic representation of LFG-FLAG, ΔN-LFG-FLAG, and 3×FLAG-ΔC-LFG truncated forms. Green boxes represent putative transmembrane regions, and red boxes the FLAG tag. A fragment of the primary sequence of LFG is shown highlighting the specific amino acid where ΔN-LFG-FLAG ends and 3×FLAG-ΔC-LFG starts. C, HEK293T cells were transfected as indicated, and FLAG-tagged proteins were immunoprecipitated from whole cell extracts with anti-FLAG resin, followed by immunoblotting HA and FLAG antibodies. D, representative confocal images of cortical neurons. Cortical neurons were fixed, permeabilized, and immunostained with anti-LFG (green), anti-Bcl-XL (red), and Hoechst (purple). The lower right panel shows a merge of all channels. Scale bar, 10 μm. The values of all Manders' co-localization coefficients and Pearson correlation coefficients are detailed under “Results.” E, adult mice cerebellum was homogenized and lysed. Endogenous Bcl-xL was immunoprecipitated, and LFG interaction was assessed by immunoblotting. F, adult mice brain was homogenized and lysed. Subfractionation assay was performed, and the different fractions were analyzed by Western blot. LFG and Bcl-xL presence was assessed in each fraction by immunoblotting, and correct purification of each fraction was assessed by immunoblotting with specific markers: anti-Rab5 (early endocytic vesicles), anti-calnexin (ER marker), anti-cytC (mitochondria marker), anti-GluR2 (plasma membrane marker), anti-H3 (nucleus marker), and anti-GADPH (cytosol marker). N, nucleus; HM, heavy membranes; LM, light membranes; Mi, microsomal fraction; Cy, cytosolic fraction; IP, immunoprecipitation.
FIGURE 4.
FIGURE 4.
LFG protects type II but not type I cells against FasL-induced cell death. A, SK-N-AS cells were transduced with empty plasmid, LFG-, Bcl-XL-, or FLIP-overexpressing lentiviral particles for 3 days. Cells were treated with Fc-FasL (100 ng/ml) or left untreated (UT) for 6 h. DEVDasa activity was assessed (one-way ANOVA test). ***, p ≤ 0.001; **, p ≤ 0.005; *, p ≤ 0.05. B, HEK293 cells were transfected with pcDNA3-, LFG-, 3×HA-Bcl-xL-, and 3×HA-FLIP-overexpressing plasmids for 48 h and treated with Fc-FasL (100 ng/ml) or left untreated for 6 h. DEVDasa activity was assessed (one-way ANOVA test). ***, p ≤ 0.001. C, SK-N-AS cells were transduced as in A. The cells were treated with Fc-FasL (100 ng/ml) or left untreated for 24 h. The percentage of apoptosis was assessed by counting cells with apoptotic nuclei (one-way ANOVA test). ***, p ≤ 0.001; *, p ≤ 0.05. D, HEK293 cells were transfected as in B. The cells were treated with Fc-FasL (100 ng/ml) or left untreated for 10 h. Percentage of apoptosis was assessed by counting cells with apoptotic nuclei (one-way ANOVA test). ***, p ≤ 0.001. E, representative images of SK-N-AS cells with Hoechst staining, transduced as in A, and treated with Fc-FasL (100 ng/ml) or left untreated for 24 h. Scale bar, 10 μm. F, representative images of HEK293 cells with Hoechst staining, transfected as B, and treated with Fc-FasL (100 ng/ml) or left untreated for 24 h. Scale bar, 10 μm. G, immunoblot analysis was performed to assess LFG, Bcl-XL and FLIP overexpression in HEK293 cells. *, short exposure; **, long exposure. Naphtol Blue staining was performed to confirm equal loading.
FIGURE 5.
FIGURE 5.
Endogenous Bcl-XL is essential for LFG protection against FasL-induced cell death. A, SK-N-AS cells were transduced with lentiviral particles carrying shRNA against LFG, Bcl-XL, or scrambled (Scr) for 3 days and then transduced with LFG- or Bcl-XL-overexpressing lentiviral particles for 3 additional days as indicated. The cells were treated with Fc-FasL (100 ng/ml) or left untreated (UT) for 6 h. DEVDasa activity was assessed (one-way ANOVA test). ***, p ≤ 0.001. B, SK-N-AS cells were transduced as in A. The cells were treated with Fc-FasL (100 ng/ml) or left untreated for 24 h. The percentage of apoptosis was assessed by counting cells with apoptotic nuclei (one-way ANOVA test). ***, p ≤ 0.001; *, p ≤ 0.05. C, immunoblot analysis was performed to assess LFG and Bcl-XL down-regulation in SK-N-AS cells. Naphtol Blue staining was performed to confirm equal loading.
FIGURE 6.
FIGURE 6.
LFG inhibits calcium release from the ER after Fas stimulation. A, SK-N-AS cells were transduced with empty plasmid and LFG- and Bcl-XL-overexpressing lentiviral particles for 3 days or treated with thapsigargin (Tg; 1 μm) for 30 min prior to Fc-FasL (200 ng/ml) treatment. Intracellular calcium mobilization was assessed as detailed under “Experimental Procedures.” B, SK-N-AS cells were transduced with lentiviral particles carrying shRNA against LFG, Bcl-XL, or scrambled (Scr) for 3 days. Cells were treated with Fc-FasL (200 ng/ml), and intracellular calcium mobilization was assessed. C, SK-N-AS cells were transduced with lentiviral particles carrying shRNA against LFG, Bcl-XL, or scrambled for 3 days and then transduced with LFG- or Bcl-XL-overexpressing lentiviral particles for 3 additional days as indicated. The cells were treated with Fc-FasL (200 ng/ml), and intracellular calcium mobilization was assessed. D, maximum calcium release of SK-N-AS transduced cells, calculated as the average of maximum calcium release of at least 10 individual cells per group (one-way ANOVA test). *, p ≤ 0.05.
FIGURE 7.
FIGURE 7.
LFG overexpression inhibits cytochrome c release from the mitochondria after Fas stimulation. A, SK-N-AS cells were treated with IETD (20 μm) for 30 min prior to Fc-FasL (200 ng/ml) treatment. Intracellular calcium mobilization was assessed. B and C, SK-N-AS cells were transduced FLIP-overexpressing lentiviral particles for 3 days or treated with IETD (20 μm) as indicated. The cells were treated with Fc-FasL (100 ng/ml) or left untreated (UT) for 6 h, and then Western blot was used to assess the cleavage of procaspase-8 (B) or Bap31 (C). Tubulin was used as loading control. D, SK-N-AS cells were transduced with lentiviral particles carrying shRNA against LFG, Bcl-XL, or scrambled (Scr) for 3 days and then transduced with LFG- or Bcl-XL-overexpressing lentiviral particles for 3 additional days as indicated. Cells were treated with Fc-FasL (100 ng/ml) or left untreated for 4 h. Cytochrome c (Cyt C) release to the cytosol was assessed by Western blot. Naphtol Blue staining was used as a loading control.
FIGURE 8.
FIGURE 8.
Schematic representation of Fas apoptotic signaling pathway and the hypothetic steps inhibited by LFG. After Fas stimulation, caspase-8 cleaves Bap31 and tBid. p20 fragment induces Ca2+ efflux from the ER to the mitochondria, which in conjunction with tBid induces mitochondrial permeabilization and cytochrome c release. Although Bcl-XL is able to inhibit ER calcium release and mitochondria permeabilization directly, LFG is only able to block the ER step.

References

    1. Marques-Fernandez F., Planells-Ferrer L., Gozzelino R., Galenkamp K. M., Reix S., Llecha-Cano N., Lopez-Soriano J., Yuste V. J., Moubarak R. S., and Comella J. X. (2013) TNFα induces survival through the FLIP-l-dependent activation of the MAPK/ERK pathway. Cell Death Dis. 4, e493. - PMC - PubMed
    1. Pasqualetto V., Vasseur F., Zavala F., Schneider E., and Ezine S. (2005) Fas receptor signaling is requisite for B cell differentiation. J. Leukocyte Biol. 78, 1106–1117 - PubMed
    1. Kaufmann T., Strasser A., and Jost P. J. (2012) Fas death receptor signalling: roles of Bid and XIAP. Cell Death Differ. 19, 42–50 - PMC - PubMed
    1. Choi C., and Benveniste E. N. (2004) Fas ligand/Fas system in the brain: regulator of immune and apoptotic responses. Brain Res. Brain Res. Rev. 44, 65–81 - PubMed
    1. Park C., Sakamaki K., Tachibana O., Yamashima T., Yamashita J., and Yonehara S. (1998) Expression of fas antigen in the normal mouse brain. Biochem. Biophys. Res. Commun. 252, 623–628 - PubMed

Publication types

MeSH terms