. 2016 Feb;26(2):873-890.
doi: 10.1093/cercor/bhv274. Epub 2015 Nov 17.

Loss of Either Rac1 or Rac3 GTPase Differentially Affects the Behavior of Mutant Mice and the Development of Functional GABAergic Networks

Affiliations

Loss of Either Rac1 or Rac3 GTPase Differentially Affects the Behavior of Mutant Mice and the Development of Functional GABAergic Networks

Roberta Pennucci et al. Cereb Cortex. 2016 Feb.

Abstract

Rac GTPases regulate the development of cortical/hippocampal GABAergic interneurons by affecting the early development and migration of GABAergic precursors. We have addressed the function of Rac1 and Rac3 proteins during the late maturation of hippocampal interneurons. We observed specific phenotypic differences between conditional Rac1 and full Rac3 knockout mice. Rac1 deletion caused greater generalized hyperactivity and cognitive impairment compared with Rac3 deletion. This phenotype matched with a more evident functional impairment of the inhibitory circuits in Rac1 mutants, showing higher excitability and reduced spontaneous inhibitory currents in the CA hippocampal pyramidal neurons. Morphological analysis confirmed a differential modification of the inhibitory circuits: deletion of either Rac caused a similar reduction of parvalbumin-positive inhibitory terminals in the pyramidal layer. Intriguingly, cannabinoid receptor-1-positive terminals were strongly increased only in the CA1 of Rac1-depleted mice. This increase may underlie the stronger electrophysiological defects in this mutant. Accordingly, incubation with an antagonist for cannabinoid receptors partially rescued the reduction of spontaneous inhibitory currents in the pyramidal cells of Rac1 mutants. Our results show that Rac1 and Rac3 have independent roles in the formation of GABAergic circuits, as highlighted by the differential effects of their deletion on the late maturation of specific populations of interneurons.

Keywords: CB1R; VGAT; hyperactivity; inhibitory synapses; neuronal maturation.


Figures

Figure 1.
Figure 1.
Rac1N mice exhibited hyperactivity but not anxiety-like behavior in the exploration tests. Rac1N (n = 11) and Rac1flox (n = 15) mice were tested in 3 different explorative tests. In the dark/light box, Rac1N mice spent more time outside the dark box (A) (*P < 0.05), and no differences were observed in locomotor activity (B). In the emergence test, the time spent inside the home box (C) and the locomotor activity in all arena zones (D) were significantly higher in the Rac1N mice. In the novelty test, the time spent in the corner (E), the locomotor activity (F), and the distance to the object (G) were significantly different between genotypes. These results indicated that Rac1N mice moved more than control animals. Data are presented as means ± SEM. Zones: e, exploration; h, home; t, transition. **P < 0.001; ***P < 0.0001.
Figure 2.
Figure 2.
Spatial and working memory analysis on Rac3KO and Rac1N mice. Rac1N (n = 9) and Rac1flox (n = 15) mice were tested for 5 days in the water maze spatial reference memory task. Thigmotaxis (A) and speed (B) are highly different between Rac1N and Rac1flox mice. These differences influence Rac1N mice performance as indicated by the escape latency to locate the new platform (C), the distance swum (D), and the average distance to the goal (E) during the acquisition and reversal phases. In fact, the analysis of the number of platform crossings during the first trial of the reversal phase indicates genotype-dependent differences between mutant and control mice (F) (zones: oo = opposite to old goal; ol = old left; og = old goal; or = old right.). (G–P) Two different sets of mice were tested in the spontaneous alternation (n = 8 for Rac3KO and WT mice; n = 11 for Rac1N mice; n = 12 for Rac1flox mice), and 8-arms radial maze tasks (n = 8 for Rac3KO, WT, and Rac1N mice; n = 12 for Rac1flox mice). Rac3KO mice did not show working memory defects in either the spontaneous alternation (G,H) or radial maze tasks (K–M). Instead, Rac1N mice are impaired in working memory performance as shown by lower correct alternations in the spontaneous alternation (I), and the lower correct arm choices before the first error (N) and the number of errors (O) in the radial maze. Higher activity was found in the radial maze by the number of visits (P). The increased total entries in the spontaneous alternation (J) are possibly due to the Syn-Cre transgene (see Supplementary Fig. 1G). Data are presented as means ± SEM. *P < 0.05; ***P < 0.001; ***P < 0.0001.
Figure 3.
Figure 3.
Rac1N but not Rac3KO mice are impaired in associative memory in the trace fear-conditioning. Rac3KO (n = 8), WT (n = 8), Rac1N (n = 8), and Rac1flox (n = 12) mice were subjected to the trace fear-conditioning test. Rac3KO mice did not show any difference compared with control mice in freezing reactions during the presentation of the 5 tones (CS) of the conditioning session (A), 24 h later in the 2 min context test (CTX1: first min; CTX2: second min) (B), and during the tone test (BL: baseline; CUE: 1 min tone) (C). Rac1N mice did not show any difference compared with control mice in freezing reactions during the presentation of the 5 tones (CS) of the conditioning session (D), and 24 h later during the tone test (BL: baseline; CUE: 1 min tone) (F). Instead, they showed a specific hippocampal-dependent deficit in the 2 min context test (CTX1: first min; CTX2: second min) (E). Data are presented as means ± SEM. *P < 0.05.
Figure 4.
Figure 4.
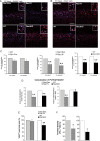
Reduced number of hippocampal PV-positive interneurons in Rac1N and Rac3KO mice. (A) Immunofluorescence to detect PV-positive cells in the hippocampus of single adult KO mice and their respective control littermates (Rac1flox, WT). DG, dentate gyrus. Scale bar: 200 μm. (B,C) Quantification of the number of PV-positive neurons per section of hippocampus from Rac1N, Rac3KO and control littermates. Graph bars are normalized means ± SEM (n = 25–40 sections from 3–5 mice/genotype). *P < 0.05; **P < 0.005. (D) Confocal images of PV staining in the CA1 and CA3 of the hippocampus of mutant (Rac1N) and control (Rac1flox) adult mice. SO, stratum oriens; SP, stratum pyramidale; SR, stratum radiatum. Scale bars, 50 µm. (E) Quantification of the area occupied by the signal for PV in the stratum pyramidale of Rac1N versus Rac1flox, and Rac3KO versus WT littermates, respectively. Bars are normalized means ± SEM of the PV-positive area measured in the SP of hippocampal CA1 and CA3 regions (CA1: n = 33–38 fields; CA3: n = 16–27 fields; 3–4 mice/genotype). **P < 0.005.
Figure 5.
Figure 5.
Inhibitory presynaptic input from PV-positive interneurons is reduced in the hippocampus of Rac1N and Rac3KO mice. Confocal images of sections of the CA1 from Rac1flox, Rac1N, WT, and Rac3KO mice costained either for PV and GAD67 (A), or for PV and VGAT (B). Areas of colocalization are in purple. Scale bars, 50 µm. Insets are 3-fold enlargements of the regions marked by asterisks. Arrows indicate areas of colocalization of PV with either GAD67, or VGAT. (C) Quantification of the area of colocalization, normalized to the respective controls ( = 100%); n = 19–23 (Rac1N vs. Rac1flox; Rac3KO vs. WT) and n = 9–10 (Syn-Cre vs. WT) CA1 fields per genotype. **P < 0.005. (D) Quantification of the area of colocalization of the 3 markers (PV, VGAT, GAD67) within either the corresponding total area of CA1 pyramidal layer (left), or the total VGAT-positive area within the CA1 pyramidal layer (right). Values for Rac1N and Rac3KO samples were normalized to the respective controls (Rac1flox and WT). (E) Quantification of the VGAT-positive area in the CA1 pyramidal layer: graph bars are normalized means ± SEM (n = 26–30 CA1 fields from 3 mice/genotype). **P < 0.005. (F) Graph bars are normalized means ± SEM of the density of PV/VGAT-positive terminals (number of dots/cell) in the pyramidal layer (n = 16–20 fields/genotype). *P < 0.05.
Figure 6.
Figure 6.
Rac1 or Rac3 deficiency increases hippocampal excitability and susceptibility to 4-AP-elicited epileptiform activity. (A) Perfusion with 500 μM 4-AP (continuous black line over each track) induced ictal discharges in 82% Rac1N (n = 11), 80% Rac3KO (n = 10), and 60% Rac1flox (n = 10) CA3 pyramidal neurons. (B–D) Quantification of the effects of 500 μM 4-AP on the time-to-ictal event (TTI) (B), ictal-like activity (IA) duration (C), and amplitude (D) (n = 9 Rac1N cells; n = 8 Rac3KO cells; n = 5 WT cells; n = 6 Rac1flox cells; n = 5 Syn-Cre cells). *P < 0.05; **P < 0.01; ***P < 0.001. (E) Electroencephalographic analysis shows spontaneous seizures in Rac1N but not in Rac3KO or control (WT, Syn-Cre, Rac1flox) mice. Examples of raw EEG traces during wakefulness in WT, Syn-Cre, Rac1flox, Rac1N and Rac3KO mice (RH: right hemisphere LH: left hemisphere). Two examples are shown for Rac1N: epileptic sharp waves with larger amplitude than background EEG (arrows in upper traces); spontaneous seizure with continuous spiking activity (bottom traces).
Figure 7.
Figure 7.
Comparative analysis of spontaneous inhibitory synaptic events in CA1 pyramidal cells. Patch-clamp on brain sections from Rac1flox, Rac1N, and Rac3KO mice was used to record sIPSCs in untreated cells (A), and in cells incubated with bicuculline to abolish GABA-dependent IPSCs (B). (C) Instantaneous frequency of sIPSCs was significantly decreased in Rac1N (n = 20) compared with either Rac3KO (n = 20), WT (n = 13), Rac1flox (n = 16), or Syn-Cre (n = 11) cells. (D) A slight but significant decrease was observed in the amplitude of sIPSCs of Rac1N compared with control (WT, Rac1flox or Syn-Cre) and Rac3KO mice. (E,F) Rise and decay time of sIPSCs were similar in control (WT, Rac1flox or Syn-Cre), Rac3KO, and Rac1N neurons. ***P < 0.001.
Figure 8.
Figure 8.
The increased density of CB1R-positive terminals may contribute to the reduced postsynaptic inhibitory currents observed in the CA1 pyramidal neurons of Rac1N mice. (A) Confocal images of the CA1 region from adult mice immunostained for CB1R. CB1R-immunoreactive axon terminals were mainly found around the soma of the pyramidal cells of control mice, and their density was increased in Rac1N mice. No differences were observed between WT and Rac3KO mice (so, stratum oriens; sp, stratum pyramidale; sr, stratum radiatum). Scale bars, 50 μm. Each image of the bottom row is a 4-fold enlargement of part of the pyramidal layer (asterisks) shown in the respective top row image. (B) Graph bars are normalized means ± SEM of the area of the pyramidal layer positive for CB1R (WT = 100%; n = 18 CA1 fields for Rac1N and Rac1flox littermates; n = 19 CA1 fields for Rac3KO and WT littermates; 3 mice/genotype). **P < 0.005. (C) Graph bars are normalized means ± SEM of the density of CB1R-positive terminals (number of dots/cell) in the pyramidal layer (n = 14–18 fields/genotype). * P < 0.05. (D) Upper panels: GAD67 (red) is poorly expressed by the CB1R-positive terminals (green) in the CA1 of Rac1N mice. Arrowheads point to CB1R-positive puncta with low/no signal for GAD67. Lower panels: several CB1R-positive terminals colocalized with GAD65 (arrowheads). Scale bars, 20 μm. Quantifications are shown in the graph on the right (n = 47–49 fields from 16 hippocampal sections/genotype). (E–H) Changes in the frequency (E,F) and amplitude (G,H) of sIPSCs recorded in mutant (Rac1N, Rac3KO) and control (WT, Rac1flox, Syn-Cre) CA1 pyramidal neurons before (Ctrl) and after (SR) incubation with the CB1R antagonist SR141716A (n = 6 cells per genotype). (E,G) Each gray line represents the measurements from a single neuron; black lines are mean values. (F,H) Graph bars show the changes in frequency (F) and amplitude (H) of sIPSCs expressed as percentages of controls. *P < 0.05; **P < 0.01.

Similar articles

Cited by

References

    1. Albertinazzi C, Gilardelli D, Paris S, Longhi R, de Curtis I. 1998. Overexpression of a neural-specific rho family GTPase, cRac1B, selectively induces enhanced neuritogenesis and neurite branching in primary neurons. J Cell Biol. 142:815–825. - PMC - PubMed
    1. Batista-Brito R, Fishell G. 2009. The developmental integration of cortical interneurons into a functional network. Curr Top Dev Biol. 87:81–118. - PMC - PubMed
    1. Bolis A, Corbetta S, Cioce A, de Curtis I. 2003. Differential distribution of Rac1 and Rac3 GTPases in the developing mouse brain: implications for a role of Rac3 in Purkinje cell differentiation. Eur J Neurosci. 18:2417–2424. - PubMed
    1. Brooks-Kayal A. 2011. Molecular mechanisms of cognitive and behavioral comorbidities of epilepsy in children. Epilepsia. 52(Suppl 1):13–20. - PMC - PubMed
    1. Buzsáki G. 2002. Theta oscillations in the hippocampus. Neuron. 33:325–340. - PubMed

Publication types

MeSH terms