. 2015 Nov 18;7(314):314ra187.
doi: 10.1126/scitranslmed.aab4014.

Bioengineered vocal fold mucosa for voice restoration

Affiliations

Bioengineered vocal fold mucosa for voice restoration

Changying Ling et al. Sci Transl Med. .

Abstract

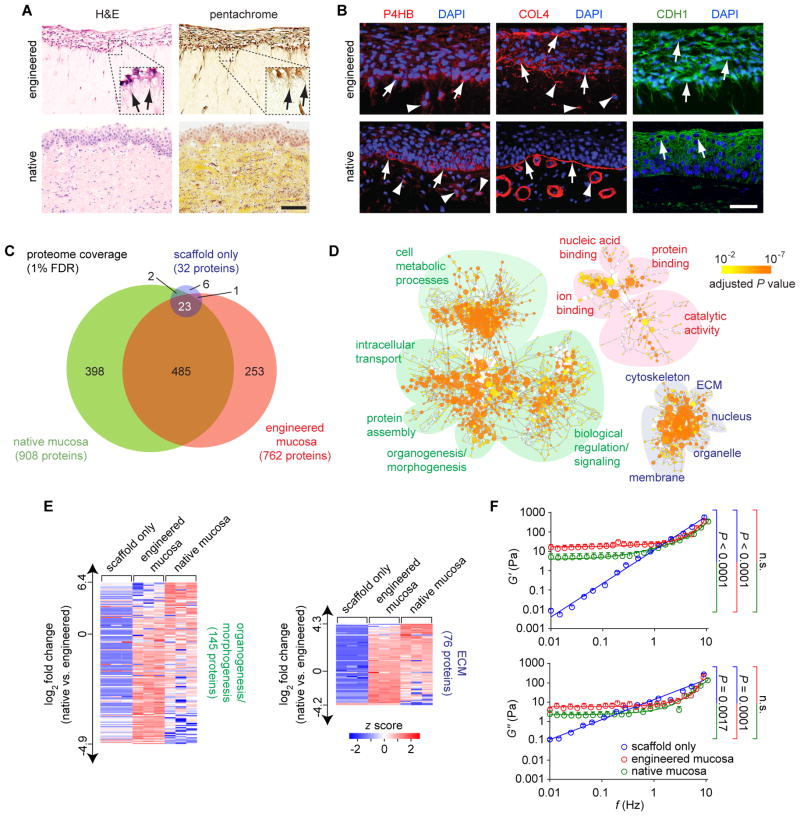
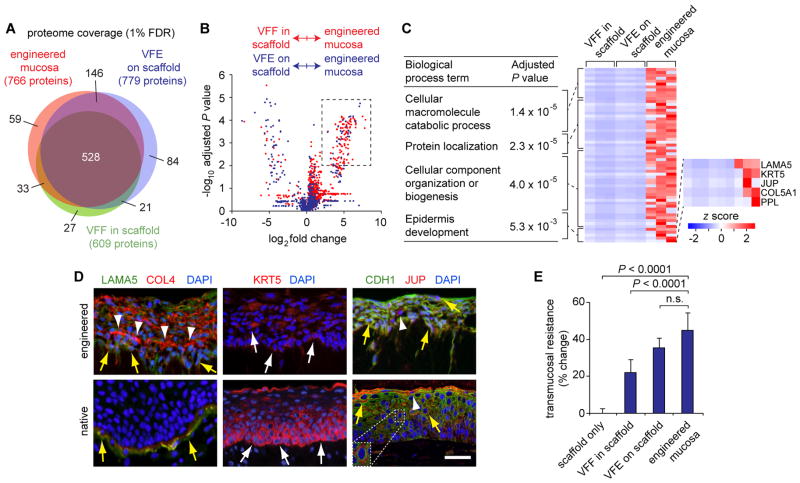
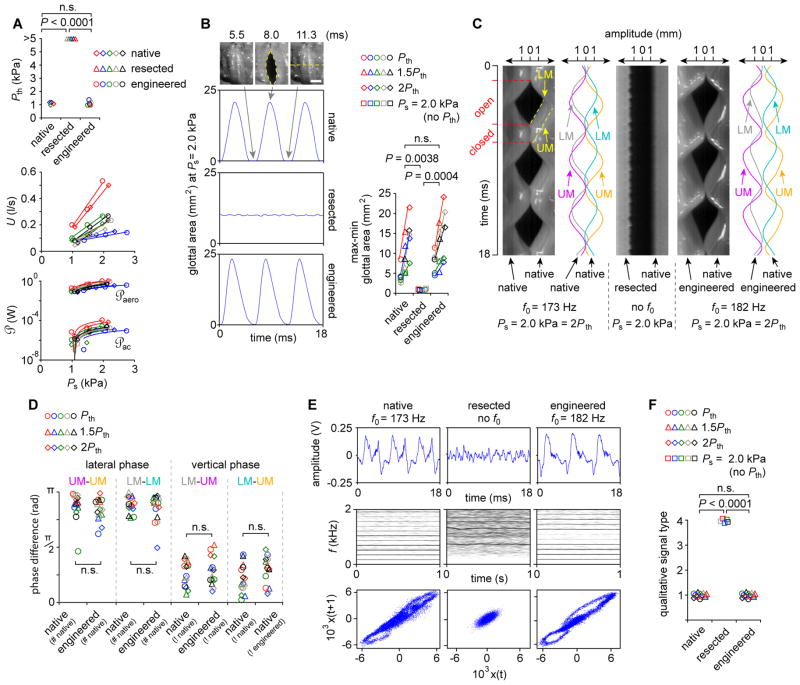
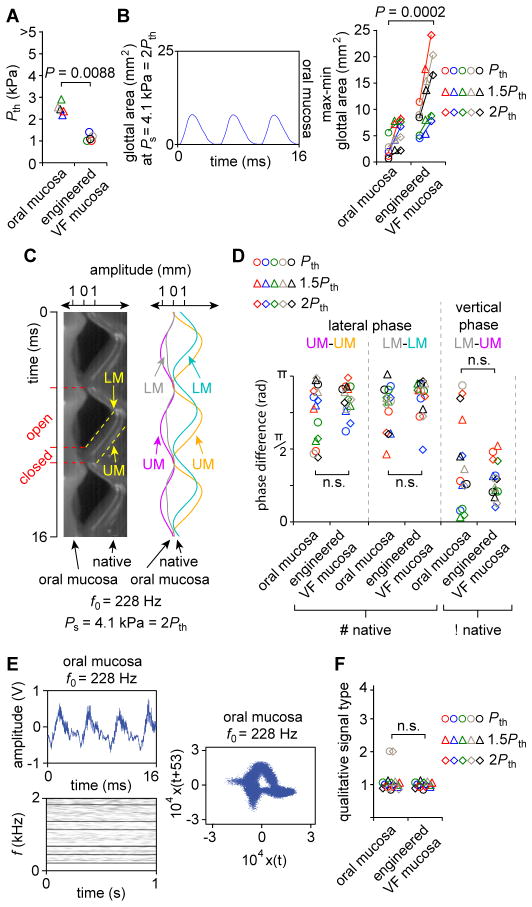
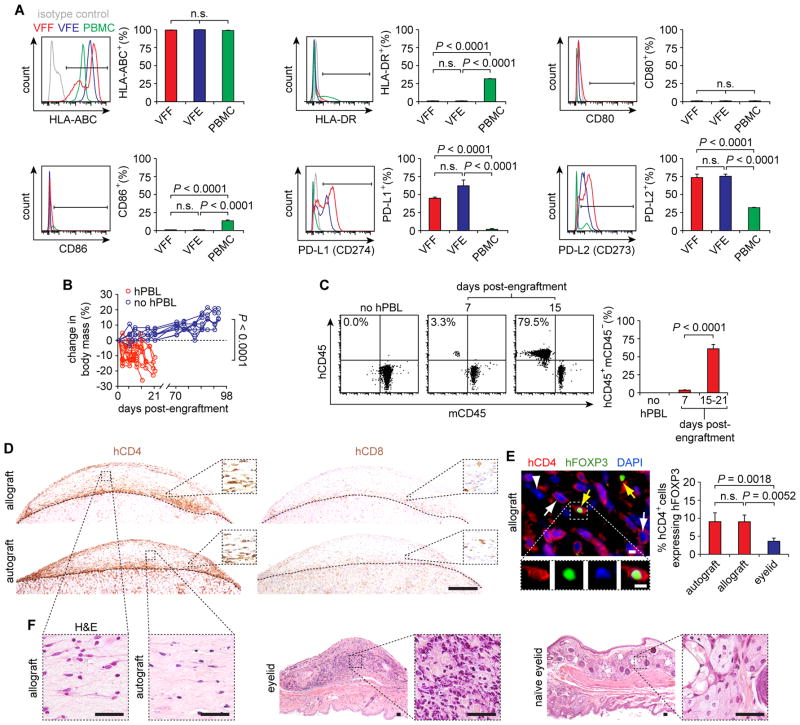
Patients with voice impairment caused by advanced vocal fold (VF) fibrosis or tissue loss have few treatment options. A transplantable, bioengineered VF mucosa would address the individual and societal costs of voice-related communication loss. Such a tissue must be biomechanically capable of aerodynamic-to-acoustic energy transfer and high-frequency vibration and physiologically capable of maintaining a barrier against the airway lumen. We isolated primary human VF fibroblasts and epithelial cells and cocultured them under organotypic conditions. The resulting engineered mucosae showed morphologic features of native tissue, proteome-level evidence of mucosal morphogenesis and emerging extracellular matrix complexity, and rudimentary barrier function in vitro. When grafted into canine larynges ex vivo, the mucosae generated vibratory behavior and acoustic output that were indistinguishable from those of native VF tissue. When grafted into humanized mice in vivo, the mucosae survived and were well tolerated by the human adaptive immune system. This tissue engineering approach has the potential to restore voice function in patients with otherwise untreatable VF mucosal disease.


Conflict of interest statement

Competing interests: The authors declare no competing financial interests. The Wisconsin Alumni Research Foundation has filed a provisional United States patent on the tissue engineering technology, with C.L. and N.V.W. as inventors.

Figures

Fig. 1
Fig. 1. Isolation, purification, and expansion of primary VFF and VFE from human VF mucosa
(A) Schematic showing general procedure for fibroblast and epithelial cell isolation and purification from VF mucosa. (B) Morphology of primary VFF and VFE in monolayer culture prior to first passage (10 or 21 d post-seeding) and at passage 3 (P3, H&E staining). Scale bars, 30 μm. (C) Expression of P4HB, CD90, pan-KRT, KRT14, KRT19, and CD227 in VFF and VFE at P3. Positive/negative gates (versus FMO control) are shown in gray; low/high gates are shown in black. Data are means ± SEM (n = 4–12). P values were calculated using a Student’s t test; n.s., not significant. (D) Representative CD90/CD227 double staining. (E). VFF and VFE population doubling times from P1 to P6. Data are means ± SEM (n = 4). The P value was calculated using ANOVA.
Fig. 2
Fig. 2. Assembly of engineered human VF mucosa
(A) H&E and Movat’s pentachrome (connective tissue) staining of engineered and native mucosae. Black arrows indicate basal VFE cytoplasmic projections extending into the lamina propria. Scale bar, 100 μm; 40 μm (insets). (B) Immunofluorescence images showing P4HB, COL4, and E-cadherin (CDH1) staining patterns. White arrows indicate P4HB+ VFE, COL4+ basement membrane and luminal epithelial structures, and CDH1+ VFE. White arrowheads indicate P4HB+ VFF and COL4+ VFF and vascular basement membrane structures in the lamina propria. Scale bar, 50 μm. (C) Venn diagram summarizing proteome coverage in engineered mucosa compared to native mucosa and scaffold only. (D) Enrichment analysis of the engineered mucosa proteome. Enriched gene ontology terms are depicted as nodes connected by arrows that represent hierarchies and relationships between terms. Node size is proportional to the number of assigned proteins; node color represents the adjusted P value (calculated using BiNGO, n = 3) corresponding to enrichment. Functionally related ontology terms are grouped using colored ovals (green, biological process; red, molecular function; blue, cellular component). Organogenesis/morphogenesis and ECM terms are enlarged for better visualization in fig. S6. (E) Heatmaps summarizing NSAF-based quantification of proteins associated with the organogenesis/morphogenesis and ECM ontology terms. A corresponding list of proteins and fold changes is presented in table S4. (F) Rheologic data showing elastic (G′) and viscous (G″) moduli of engineered mucosa compared to native mucosa and scaffold only. Data are means ± SEM (n = 4–12). P values (comparison of slopes) were calculated using ANOVA; n.s., not significant.
Fig. 3
Fig. 3. Proteomic-based analysis of engineered VF mucosa compared to its isolated subcomponents
(A) Venn diagram summarizing proteome coverage across conditions. FDR, false discovery rate. (B) Volcano plot summarizing NSAF-based protein quantification in engineered mucosa versus VFF in scaffold (red) and VFE on scaffold (blue). The dashed rectangle denotes cutoff criteria for protein overrepresentation in engineered mucosa compared to the other conditions. Adjusted P values were calculated using a Student’s t test (n = 3). (C) Summary of enriched biological process terms associated with the protein set exclusive to engineered mucosa or overrepresented in engineered mucosa compared to both VFF in scaffold and VFE on scaffold. The table lists the three most highly represented terms (adjusted P values were calculated using BiNGO, n = 3; postprocessing was performed using REViGO), as well as the mechanistically relevant epidermis (in the context of mucosa, epithelium) development term. A complete list of enriched terms is presented in table S6. The heatmap shows the relative abundance of overrepresented proteins that map to these terms of interest. (D) Immunohistochemical validation of overrepresented proteins LAMA5 (costained with COL4), KRT5, and JUP (costained with CDH1), in engineered and native VF mucosae. White arrows indicate KRT5+ VFE; white arrowheads indicate COL4+ signals in the deep epithelium and JUP+ VFE; yellow arrows indicate LAMA5+COL4+ basal VFE in engineered mucosa, LAMA5+COL4+ basement membrane structures in native mucosa, and CDH1+JUP+ VFE. Scale bar, 50 μm; 25 μm (inset). (E) Transmucosal electrical resistance. Data are means ± SEM (n = 4). P values were calculated using ANOVA; n.s., not significant.
Fig. 4
Fig. 4. Ex vivo physiologic performance of engineered VF mucosa in a canine excised larynx
(A) Aerodynamic data showing phonation threshold pressure (Pth), subglottal pressure (Ps) and flow (U) relationships (i.e., glottal resistance [Rg]); as well as aerodynamic input power (℘aero) and radiated acoustic output power (℘ac) relationships (i.e., glottal efficiency [Eg]). P values were calculated using ANOVA. (B) HSDI-based glottal area analysis. Grey arrows indicate the beginning, midpoint and endpoint of a representative 5.8-ms vibratory cycle. The yellow dashed ellipse indicates maximum glottal area. The yellow dashed line indicates the scanning line used for subsequent kymography. Scale bar, 3 mm. P values were calculated using ANOVA. (C) Representative kymograms from the larynx presented in (B). Red tick marks and dashed lines indicate open and closed phases of a single vibratory cycle. Yellow dashed lines indicate the upper and lower VF margins (UM and LM). Sinusoidal curve fitting (R2 > 0.98) to the UM and LM is shown for the native and engineered conditions. f0, fundamental frequency. (D) Lateral and vertical phase differences for all larynges and conditions. #, contralateral VF mucosa condition used to calculate lateral phase difference; !, VF mucosa condition contralateral to that for which vertical phase difference is calculated. P values were calculated using ANOVA. (E) Representative acoustic data showing time-domain signals (upper), narrowband spectrograms (center) and phase plots (lower). (F) Qualitative acoustic signal typing for all larynges and conditions. P values were calculated using a χ2 test. Data from a parallel experiment evaluating the ex vivo physiologic performance of human oral mucosa are presented in Fig. 5. Data from the same larynx (n = 5) are plotted in the same color (A, B, D, F); n.s., not significant.
Fig. 5
Fig. 5. Ex vivo physiologic performance of human oral mucosa, compared to that of engineered VF mucosa, in a canine excised larynx
(A) Phonation threshold pressure (Pth). P values were calculated using a Student’s t test. (B) HSDI-based glottal area analysis. Ps, subglottal pressure. P values were calculated using ANOVA. (C) Representative kymogram from the larynx presented in (B). Red tick marks and dashed lines indicate open and closed phases of a single vibratory cycle. Yellow dashed lines indicate the upper and lower VF margins (UM and LM). Sinusoidal curve fitting (R2 > 0.98) to the UM and LM is also shown. f0, fundamental frequency. (D) Lateral and vertical phase differences for all larynges and conditions. #, contralateral VF mucosa condition used to calculate lateral phase difference; !, VF mucosa condition contralateral to that for which vertical phase difference is calculated. P values were calculated using ANOVA. (E) Representative acoustic data showing a time-domain signal (upper), narrowband spectrogram (lower) and phase plot (right). (F) Qualitative acoustic signal typing. The P value was calculated using a χ2 test. The engineered VF mucosa dataset used for statistical comparisons is presented in complete form in Fig. 4. Data from the same larynx (n = 5) are plotted in the same color (A, B, D, F); n.s., not significant.
Fig. 6
Fig. 6. Immunogenicity of engineered VF mucosa
(A) Expression of cell surface markers HLA-ABC, HLA-DR, CD80, CD86, PD-L1 (CD274) and PD-L2 (CD273) in VFF and VFE compared to peripheral blood mononuclear cell (PBMC) control. Data are means ± SEM (n = 5). P values were calculated using ANOVA. (B) Body mass of NSG mice following hPBL injection, compared to no hPBL control mice (n = 10–12). Mice were euthanized following a >15% decrease in body mass and clinical signs of xenogeneic GVHD, which occurred 15–21 d post-hPBL injection. P values (comparison of total percentage change) were calculated using a Student’s t test. (C) hCD45+mCD45 human lymphocytes in the peripheral blood of NSG mice following hPBL injection. Data are means ± SEM (n = 7–8). P values were calculated using a Student’s t test. (D) hCD4+ T helper cell and hCD8+ cytotoxic T cell infiltration of the engineered auto- and allografts, 15 d post-hPBL engraftment. Dashed black contour lines indicate the boundaries between the engineered human grafts (top) and the mouse kidneys (bottom). Scale bar, 500 μm; 70 μm (insets). (E) hFOXP3 expression by infiltrating hCD4+ T cells in the engineered allograft, 15 d post-hPBL engraftment. White arrows indicate hCD4+hFOXP3 T helper cells; yellow arrows indicate hCD4+hFOXP3+ regulatory T cells; the white arrowhead indicates a hCD4hFOXP3 cell. Scale bars, 5 μm. The bar graph summarizes cell count data from the engineered auto- and allografts and mouse eyelid, a GVHD positive control tissue. Data are means ± SEM (n = 3–6). P values were calculated using ANOVA. (F) H&E-stained sections showing morphology of the engineered auto- and allografts compared to the mouse eyelid, 15 d post-hPBL engraftment. Scale bars, 50 μm. n.s., not significant.

Comment in

  • Tissue engineering. Restoring voice.
    Long JL, Chhetri DK. Long JL, et al. Science. 2015 Nov 20;350(6263):908-9. doi: 10.1126/science.aad7695. Science. 2015. PMID: 26586745 Free PMC article. No abstract available.

References

    1. Cohen SM, Dupont WD, Courey MS. Quality-of-life impact of non-neoplastic voice disorders: a meta-analysis. Ann Otol Rhinol Laryngol. 2006;115:128–134. - PubMed
    1. Cohen SM, Kim J, Roy N, Asche C, Courey MS. The impact of laryngeal disorders on work-related dysfunction. Laryngoscope. 2012;122:1589–1594. - PubMed
    1. Cohen SM, Kim J, Roy N, Asche C, Courey MS. Direct health care costs of laryngeal diseases and disorders. Laryngoscope. 2012;122:1582–1588. - PubMed
    1. Coyle SM, Weinrich BD, Stemple JC. Shifts in relative prevalence of laryngeal pathology in a treatment-seeking population. J Voice. 2001;15:424–440. - PubMed
    1. Friedrich G, Dikkers FG, Arens C, Remacle M, Hess MM, Giovanni A, Duflo SM, Hantzakos AG, Bachy V, Gugatschka M. Vocal fold scars: current concepts and future directions. Consensus report of the phonosurgery committee of the European laryngological society. Eur Arch Otorhinolaryngol. 2013;270:2491–2507. - PubMed

Publication types

MeSH terms