

Paracetamol (acetaminophen) protein adduct concentrations during therapeutic dosing
- PMID: 26584404
- PMCID: PMC4767203
- DOI: 10.1111/bcp.12831
Paracetamol (acetaminophen) protein adduct concentrations during therapeutic dosing
Abstract
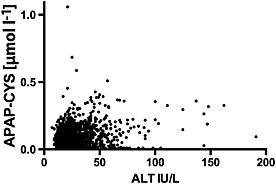
Background: Paracetamol protein adducts (PPA) are a biomarker of paracetamol exposure. PPA are quantified as paracetamol-cysteine (APAP-CYS), and concentrations above 1.1 μmol l(-1) have been suggested as a marker of paracetamol-induced hepatotoxicity. However, there is little information on the range of concentrations observed during prolonged therapeutic dosing.
Aim: The aim of the present study was to describe the concentration of PPA in the serum of subjects taking therapeutic doses of paracetamol for at least 16 days.
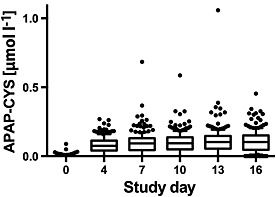
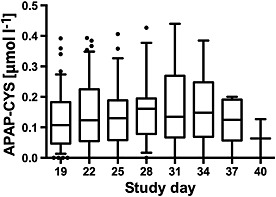
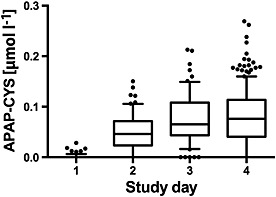
Methods: Preplanned secondary aim of a prospective randomized controlled (placebo vs. 4g day(-1) paracetamol) trial. We measured subjects' serum PPA concentrations every 3 days for a minimum of 16 days. We also measured concentrations on study days 1-3 and 16-25 in subsets of patients. PPA were quantified as APAP-CYS after gel filtration and protein digestion using liquid chromatography/mass spectrometry.
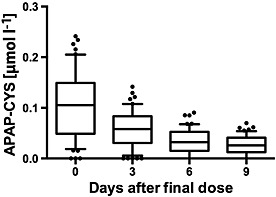
Results: Ninety per cent of subjects had detectable PPA after five doses. Median APAP-CYS concentrations in paracetamol-treated subjects increased to a plateau of 0.1 μmol l(-1) on day 7, where they remained. The highest concentration measured was 1.1 μmol l(-1) and two subjects never had detectable PPA levels. PPA were detected in the serum of 78% of subjects 9 days after their final dose.
Conclusions: PPA are detectable in the vast majority of subjects taking therapeutic doses of paracetamol. While most have concentrations well below the threshold associated with hepatotoxicity, concentrations may approach 1.1 μmol l(-1) in rare cases. Adducts are detectable after a few doses and can persist for over a week after dosing is stopped.
Keywords: APAP-CYS; paracetamol; protein adducts.
© 2015 The British Pharmacological Society.
Figures
References
-
- Bond GR. Acetaminophen protein adducts: a review. Clin Toxicol 2009; 47: 2–7. - PubMed
-
- Muldrew KL, James LP, Coop L, McCullough SS, Hendrickson HP, Hinson JA, Mayeux PR. Determination of acetaminophen‐protein adducts in mouse liver and serum and human serum after hepatotoxic doses of acetaminophen using high‐performance liquid chromatography with electrochemical detection. Drug Metab Dispos 2002; 30: 446–51. - PubMed
-
- Davern TJ 2nd, James LP, Hinson JA, Polson J, Larson AM, Fontana RJ, Lalani E, Munoz S, Shakil AO, Lee WM. Measurement of serum acetaminophen‐protein adducts in patients with acute liver failure. Gastroenterology 2006; 130: 687–94. - PubMed
-
- James LP, Alonso EM, Hynan LS, Hinson JA, Davern TJ, Lee WM, Squires RH. Detection of acetaminophen protein adducts in children with acute liver failure of indeterminate cause. Pediatrics 2006; 118: e676–81. - PubMed
Publication types
MeSH terms
Substances
LinkOut - more resources
Full Text Sources
Other Literature Sources
