. 2015 Nov 19:10:234.
doi: 10.1186/s13014-015-0542-1.

Can knowledge-based DVH predictions be used for automated, individualized quality assurance of radiotherapy treatment plans?

Affiliations

Can knowledge-based DVH predictions be used for automated, individualized quality assurance of radiotherapy treatment plans?

Jim P Tol et al. Radiat Oncol. .

Abstract

Background: Treatment plan quality assurance (QA) is important for clinical studies and for institutions aiming to generate near-optimal individualized treatment plans. However, determining how good a given plan is for that particular patient (individualized patient/plan QA, in contrast to running through a checklist of generic QA parameters applied to all patients) is difficult, time consuming and operator-dependent. We therefore evaluated the potential of RapidPlan, a commercial knowledge-based planning solution, to automate this process, by predicting achievable OAR doses for individual patients based on a model library consisting of historical plans with a range of organ-at-risk (OAR) to planning target volume (PTV) geometries and dosimetries.

Methods: A 90-plan RapidPlan model, generated using previously created automatic interactively optimized (AIO) plans, was used to predict achievable OAR dose-volume histograms (DVHs) for the parotid glands, submandibular glands, individual swallowing muscles and oral cavities of 20 head and neck cancer (HNC) patients using a volumetric modulated (RapidArc) simultaneous integrated boost technique. Predicted mean OAR doses were compared with mean doses achieved when RapidPlan was used to make a new plan. Differences between the achieved and predicted DVH-lines were analyzed. Finally, RapidPlan predictions were used to evaluate achieved OAR sparing of AIO and manual interactively optimized plans.

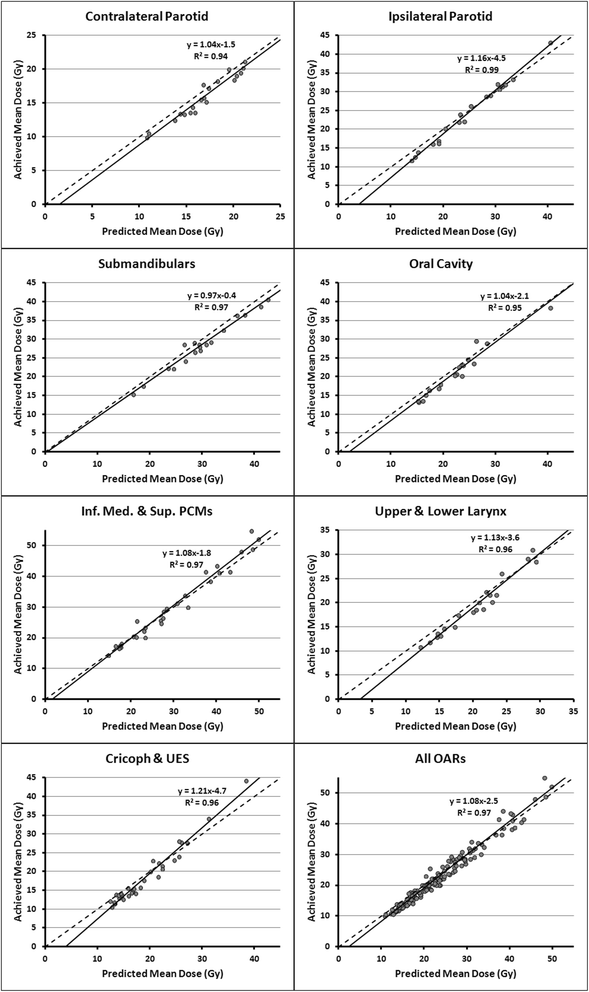
Results: For all OARs, strong linear correlations (R(2) = 0.94-0.99) were found between predicted and achieved mean doses. RapidPlan generally overestimated the amount of achievable sparing for OARs with a large degree of OAR-PTV overlap. RapidPlan QA using predicted doses alone identified that for 50 % (10/20) of the manually optimized plans, sparing of the composite salivary glands, oral cavity or composite swallowing muscles could be improved by at least 3 Gy, 5 Gy or 7 Gy, respectively, while this was the case for 20 % (4/20) AIO plans. These predicted gains were validated by replanning the identified patients using RapidPlan.

Conclusions: Strong correlations between predicted and achieved mean doses indicate that RapidPlan could accurately predict achievable mean doses. This shows the feasibility of using RapidPlan DVH prediction alone for automated individualized head and neck plan QA. This has applications in individual centers and clinical trials.


Figures
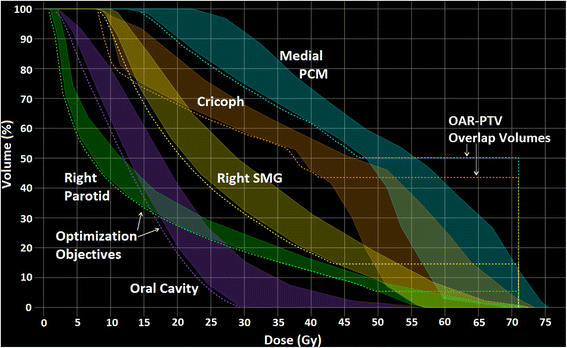
Fig. 1
Fig. 1
Organ-at-risk (OAR) dose-volume histogram (DVH) prediction ranges (shaded regions) generated by the RapidPlan model and optimization objectives placed along the inferior DVH prediction boundary (dotted lines). To prevent underdosing of the planning target volume (PTV), line objectives are placed horizontally in the portion of the OAR that overlaps with the PTV
Fig. 2
Fig. 2
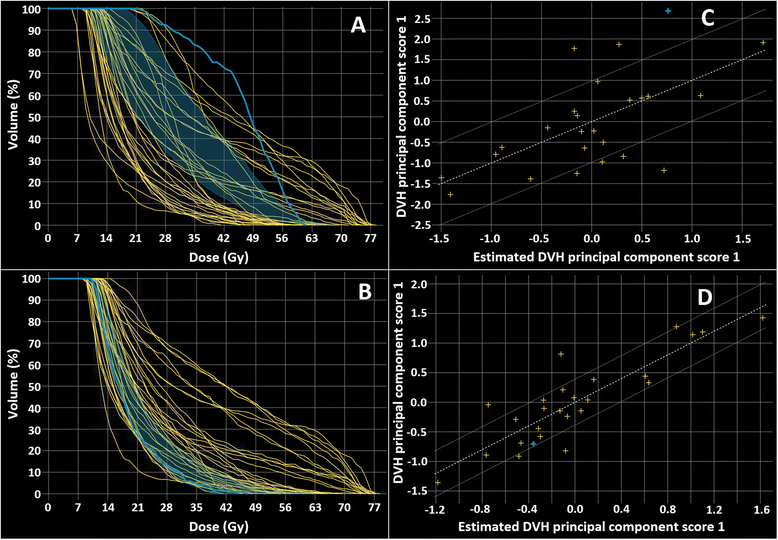
Example of an upper larynx contained in the RapidPlan model that was identified as a dosimetric outlier in the model configuration window. Screenshots taken from the RapidPlan model configuration window. The discrepancy between the predicted and achieved dose-volume histogram (DVH) lines (a) was solved by replanning the corresponding patient (indicated by solid blue line) using the RapidPlan model (b). The shaded region indicates the DVH prediction range for the selected plan. RapidPlan uses principal component analysis to decompose the shape of the achieved and predicted DVHs in the model library, allowing for a more consistent way to compare the estimated and obtained dosimetry. The residual plot (c) shows the correlation between the obtained (DVH principal component score 1) and predicted dosimetry (estimated DVH principal component score 1) after replanning (d), indicating that the predicted OAR DVH closely corresponds to the OAR DVH included in the model library. Since more than one upper larynx was identified as an outlier in the two iterations of outlier replanning, more DVHs are noted to change
Fig. 3
Fig. 3
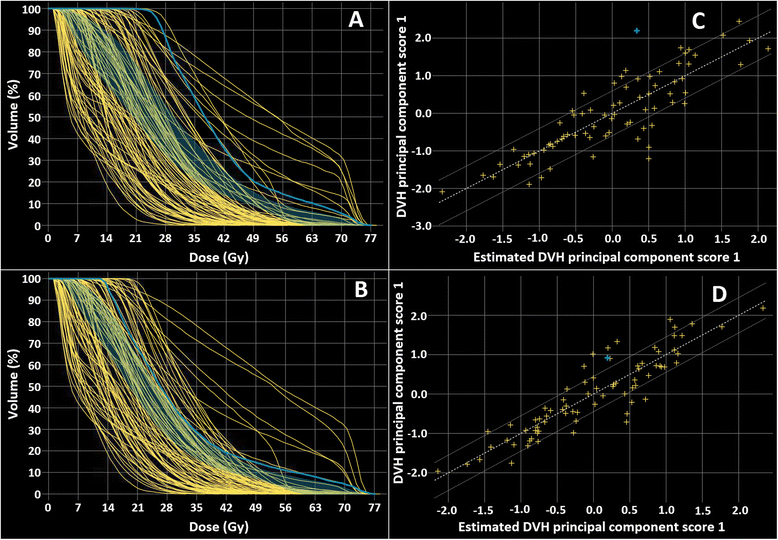
Similar to Fig. 2, an oral cavity identified as an outlier in the RapidPlan model library
Fig. 4
Fig. 4
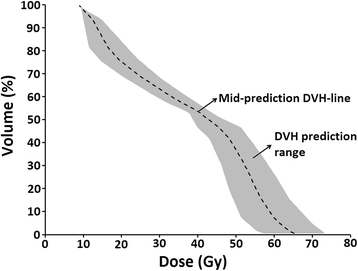
The mid-prediction dose-volume histogram (DVH) line (dashed) running through the middle of the DVH prediction range (shaded region). This was used as a surrogate for the prediction DVH in this study and determined using an in-house developed program coded in Lazarus (http://www.lazarus.freepascal.org/)
Fig. 5
Fig. 5
Examples of predicted dose-volume histogram (DVH) ranges (shaded regions) and achieved DVH-lines for multiple organs-at-risk (OARs) of three patients. The solid lines represent the DVHs that were achieved in the previously created clinical plans, while the dotted lines indicate the DVHs that were obtained when the RapidPlan model was used to create a new treatment plan. The mid-prediction DVH-line used for the analysis in the present report is located in the middle of the shaded region
Fig. 6
Fig. 6
For multiple organs-at-risk (OARs), the correlation between predicted (x-axis) and achieved (y-axis) mean OAR doses. The solid lines represent fits created through all datapoints, while the dashed line indicates a linear fit through the origin. The R2 values indicates the goodness-of-fit of the solid line with the datapoints. For conciseness, some individual swallowing muscles and the contralateral, and ipsilateral submandibular gland are analyzed together in these graphs. The number of OARs included in these graphs can vary depending on whether they were designated to be spared in the original clinical plan
Fig. 7
Fig. 7
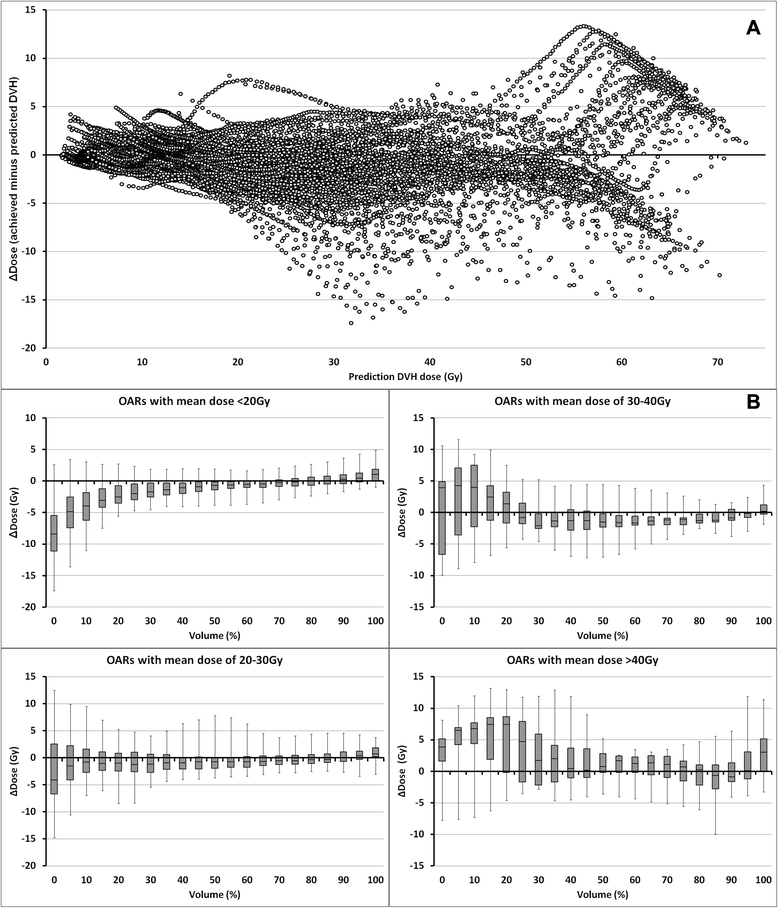
The prediction accuracy of RapidPlan along the dose-volume histogram (DVH) line. a Dose difference between the achieved and predicted DVH-line (ΔDose, y-axis) plotted against the dose of the predicted DVH-line (x-axis). b Box-whisker plots of ΔDose as a function of organ-at-risk (OAR) volume (x-axis) for four different ranges of OAR mean doses. Lower OAR volumes are typically associated with high doses
Fig. 8
Fig. 8
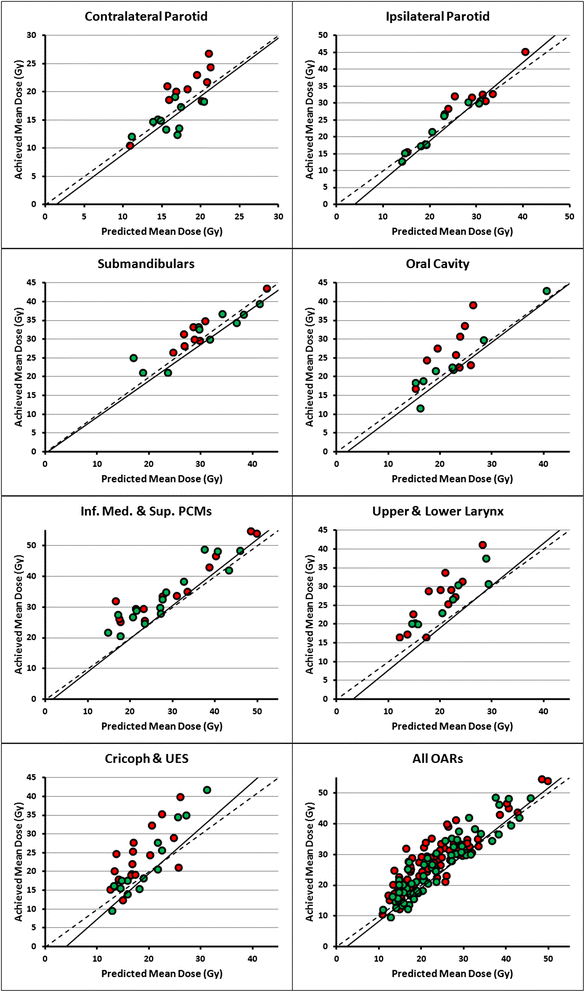
The organs-at-risk (OARs) of the clinical plans that passed (green circles) and failed (red circles) the evaluation criteria, along with the linear fit between the RapidPlan predicted and achieved mean dose found in Fig. 6. Thresholds of 3 Gy, 5 Gy and 7 Gy were used for quality evaluation of the composite (volume-weighted) salivary glands, oral cavity and composite swallowing muscles, respectively. Datapoints of individual OARs with similar predicted and achieved mean doses could still fail the criteria because the analysis was done based on composite OARs
Fig. 9
Fig. 9
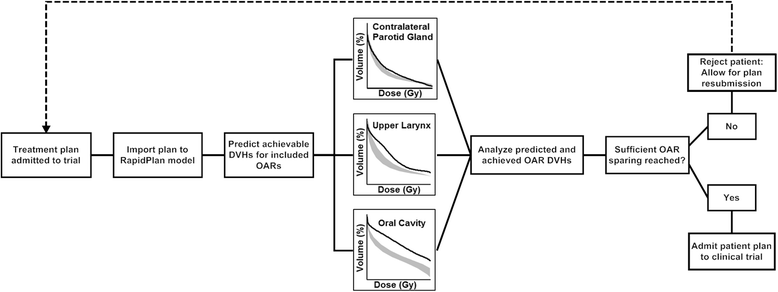
A flowchart proposing how the organ-at-risk (OAR) dose-volume histogram (DVH) predictions generated by a RapidPlan model could be used for fast plan quality assurance (QA) for clinical trials

References

    1. Nelms BE, Robinson G, Markham J, Velasco K, Boyd S, Narayan S, et al. Variation in external beam treatment plan quality: An inter-institutional study of planners and planning systems. Pract Radiat Oncol. 2012;2:296–305. doi: 10.1016/j.prro.2011.11.012. - DOI - PubMed
    1. Das IJ, Cheng C-W, Chopra KL, Mitra RK, Srivastava SP, Glatstein E. Intensity-modulated radiation therapy dose prescription, recording, and delivery: patterns of variability among institutions and treatment planning systems. J Natl Cancer Inst. 2008;100:300–7. doi: 10.1093/jnci/djn020. - DOI - PubMed
    1. Voet PWJ, Dirkx MLP, Breedveld S, Fransen D, Levendag PC, Heijmen BJM. Toward fully automated multicriterial plan generation: a prospective clinical study. Int J Radiat Oncol Biol Phys. 2013;85:866–72. doi: 10.1016/j.ijrobp.2012.04.015. - DOI - PubMed
    1. Breedveld S, Storchi PRM, Voet PWJ, Heijmen BJM. iCycle: Integrated, multicriterial beam angle, and profile optimization for generation of coplanar and noncoplanar IMRT plans. Med Phys. 2012;39:951–63. doi: 10.1118/1.3676689. - DOI - PubMed
    1. Fogliata A, Wang P-M, Belosi F, Clivio A, Nicolini G, Vanetti E, et al. Assessment of a model based optimization engine for volumetric modulated arc therapy for patients with advanced hepatocellular cancer. Radiat Oncol. 2014;9:236. doi: 10.1186/s13014-014-0236-0. - DOI - PMC - PubMed

Publication types

MeSH terms