. 2016 Jan;26(1):46-65.
doi: 10.1038/cr.2015.133. Epub 2015 Nov 20.

mTORC2 promotes type I insulin-like growth factor receptor and insulin receptor activation through the tyrosine kinase activity of mTOR

Affiliations

mTORC2 promotes type I insulin-like growth factor receptor and insulin receptor activation through the tyrosine kinase activity of mTOR

Yancun Yin et al. Cell Res. 2016 Jan.

Abstract

Mammalian target of rapamycin (mTOR) is a core component of raptor-mTOR (mTORC1) and rictor-mTOR (mTORC2) complexes that control diverse cellular processes. Both mTORC1 and mTORC2 regulate several elements downstream of type I insulin-like growth factor receptor (IGF-IR) and insulin receptor (InsR). However, it is unknown whether and how mTOR regulates IGF-IR and InsR themselves. Here we show that mTOR possesses unexpected tyrosine kinase activity and activates IGF-IR/InsR. Rapamycin induces the tyrosine phosphorylation and activation of IGF-IR/InsR, which is largely dependent on rictor and mTOR. Moreover, mTORC2 promotes ligand-induced activation of IGF-IR/InsR. IGF- and insulin-induced IGF-IR/InsR phosphorylation is significantly compromised in rictor-null cells. Insulin receptor substrate (IRS) directly interacts with SIN1 thereby recruiting mTORC2 to IGF-IR/InsR and promoting rapamycin- or ligand-induced phosphorylation of IGF-IR/InsR. mTOR exhibits tyrosine kinase activity towards the general tyrosine kinase substrate poly(Glu-Tyr) and IGF-IR/InsR. Both recombinant mTOR and immunoprecipitated mTORC2 phosphorylate IGF-IR and InsR on Tyr1131/1136 and Tyr1146/1151, respectively. These effects are independent of the intrinsic kinase activity of IGF-IR/InsR, as determined by assays on kinase-dead IGF-IR/InsR mutants. While both rictor and mTOR immunoprecitates from rictor(+/+) MCF-10A cells exhibit tyrosine kinase activity towards IGF-IR and InsR, mTOR immunoprecipitates from rictor(-/-) MCF-10A cells do not induce IGF-IR and InsR phosphorylation. Phosphorylation-deficient mutation of residue Tyr1131 in IGF-IR or Tyr1146 in InsR abrogates the activation of IGF-IR/InsR by mTOR. Finally, overexpression of rictor promotes IGF-induced cell proliferation. Our work identifies mTOR as a dual-specificity kinase and clarifies how mTORC2 promotes IGF-IR/InsR activation.


Figures

Figure 1
Figure 1
Rapamycin potentiates IGF-IR/InsR phosphorylation and activation. (A) HepG2 cells were treated with or without rapamycin for 24 h, followed by western blot analysis of indicated proteins. Values represent mean ± SD. *P < 0.05; ***P < 0.001. (B) HepG2 cells were treated with rapamycin for the indicated period, followed by western blot analysis. (C) Endogenous and GFP-tagged InsR and their phosphorylation in HepG2 cells treated with or without 10 nM rapamycin for 24 h. (D) The immunoprecipitated IGF-IR/InsR from rapamycin-treated or untreated HepG2 cells was incubated with 50 ng recombinant IRS1 in a kinase assay system, followed by western blot analysis and quantification. Values represent mean ± SD. ***P < 0.001. (E) The tyrosine kinase activity of immunoprecipitated IGF-IR/InsR from HepG2 cells treated with or without 10 nM rapamycin for 24 h was examined by in vitro kinase assay, using a synthetic peptide (300 ng) as the substrate. The relative kinase activity is plotted. The IGF-IR/InsR kinase activity in untreated cells is set as 100%. Values represent mean ± SD (n = 4). **P < 0.01. A representative of two or more experiments is shown.
Figure 2
Figure 2
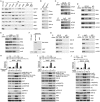
Rictor and mTOR promote rapamycin- and ligand-induced phosphorylation and activation of IGF-IR/InsR. (A) HepG2 and SMMC-7721 cells were transfected with negative control siRNA or mTOR siRNA, and treated with or without 10 nM rapamycin for 24 h, followed by western blot analysis of the indicated proteins. Values represent mean ± SD. ***P < 0.001. (B) HepG2 and SMMC-7721 cells were transfected with negative control siRNA or rictor siRNA, and treated with or without 10 nM rapamycin for 24 h, followed by western blot analysis. Values represent mean ± SD. ***P < 0.001. (C) MCF-10A (rictor+/+) and rictor-null MCF-10A (rictor−/−) cells were treated with or without 10 nM rapamycin for 24 h, followed by western blot analysis of the indicated proteins. (D) HepG2 and SMMC-7721 cells were transfected with negative control siRNA or mTOR siRNA, and treated with or without 1 nM IGF-I for 30 min, followed by western blot analysis. Values represent mean ± SD. ***P < 0.001. (E) HepG2 and SMMC-7721 cells were transfected with negative control siRNA or rictor siRNA, and treated with or without 1 nM IGF-I for 30 min, followed by western blot analysis. Values represent mean ± SD. ***P < 0.001. (F) HepG2 cells were transfected with negative control siRNA or mTOR siRNA, and treated with or without 10 μg/mL insulin for 30 min, followed by western blot analysis. Values represent mean ± SD. ***P < 0.001. (G) HepG2 cells were transfected with negative control siRNA or rictor siRNA, and treated with or without 10 μg/mL insulin for 30 min, followed by western blot analysis. Values represent mean ± SD. ***P < 0.001. (H) The effects of overexpression of siRictor-resistant rictor construct (myc-Rictor) on rapamycin-induced IGF-IR/InsR phoshorylation in HepG2 cells transfected with or without siRictor. Values represent mean ± SD. **P < 0.01; ***P < 0.001. (I) MCF-10A (rictor+/+) and rictor-null MCF-10A (rictor−/−) cells were treated with or without 1 nM IGF-I and 10 μg/mL insulin for 30 min, followed by western blot analysis of the indicated proteins. A representative of two or more experiments is shown.
Figure 3
Figure 3
IRS1/2 recruit rictor-mTOR to IGF-IR/InsR and promote their phosphorylation. (A) Immunoprecipitation of IGF-IR, InsR, rictor, mTOR, IRS1 and IRS2, and western blot analysis of the indicated proteins. (B) Immunoprecipitation of rictor from MCF-10A (rictor+/+) and rictor null MCF-10A cells (rictor−/−). (C) Immunoprecipitation of IGF-IR and InsR from HepG2 cells transfected with negative control siRNA or rictor siRNA. (D) Immunoprecipitation of IGF-IR from HepG2 cells transfected with negative control siRNA, IRS1 or IRS2 siRNA, and western blot analysis. (E) Immunoprecipitation of InsR from HepG2 cells transfected with negative control siRNA, IRS1 or IRS2 siRNA, and western blot analysis. (F) GST pull-down assay of purified GST-IRS1 and SIN1. (G) Immunoprecipitation of IGF-IR and InsR from HepG2 cells transfected with negative control siRNA or SIN1 siRNA. (H) The effects of simultaneous knockdown of both IRS1 and IRS2 on rapamycin-induced IGF-IR/InsR phosphorylation. (I) The effects of simultaneous knockdown of both IRS1 and IRS2 on IGF-I-induced IGF-IR/InsR phosphorylation. (J) The effects of simultaneous knockdown of both IRS1 and IRS2 on insulin-induced InsR phosphorylation. Values represent mean ± SD. ***P < 0.001. A representative of three experiments is shown.
Figure 4
Figure 4
mTOR promotes IGF-IR/InsR phosphorylation and activation. (A) Western blot analysis of IGF-IR/InsR, Akt, ERK1/2 and mTOR phosphorylation in HepG2 cells that were pre-treated with or without 2 nM Torin2 for 4 h, and treated with or without 1 nM IGF-I for 30 min, or 10 μg/mL insulin for 30 min. Values represent mean ± SD. ***P < 0.001. (B) MDA-MB-453 cell lysates (IGF-IR negative and InsR negative) were subjected to immunoprecipitation of raptor, rictor and mTOR complexes. Immunoprecipitated raptor, rictor and mTOR complexes were incubated with recombinant IGF-IR in the absence or presence of Torin2 in a kinase assay system, followed by western blot analysis. (C) Immunoprecipitated raptor, rictor and mTOR complexes were incubated with recombinant InsR in the absence or presence of Torin2 in a kinase assay system, followed by western blot analysis. (D) Rictor, mTOR and ATM were immunoprecipitated in a high salt buffer. The immunoprecipitates were incubated with kinase-dead IGF-IR (KD-IGF-IR, K1003R) in a kinase assay system, followed by western blot analysis. (E) Rictor, mTOR and ATM were immunoprecipitated in high salt buffer. The immunoprecipitates were incubated with KD-InsR (K1018A) in a kinase assay system, followed by western blot analysis. (F) Flag-tagged wild-type mTOR (wt-mTOR) or KD-mTOR (S2035T/D2357E) were overexpressed in MDA-MB-453 cells, followed by immunoprecipitation with anti-FLAG antibody. The immunoprecipitates were incubated with Akt2 or KD-IGF-IR (K1003R) in a kinase assay system, followed by western blot analysis. (G) Flag-tagged wt-mTOR or KD-mTOR were overexpressed in MDA-MB-453 cells, followed by immunoprecipitation with anti-FLAG antibody. The immunoprecipitates were incubated with Akt2 or KD-InsR (K1018A) in a kinase assay system, followed by western blot analysis. (H) Rictor and mTOR were immunoprecipitated from rictor+/+ and rictor−/− MCF-10A cells. The immunoprecipitates were incubated with kD-IGF-IR in a kinase assay system, followed by western blot analysis. (I) Rictor and mTOR were immunoprecipitated from rictor+/+ and rictor−/− MCF-10A cells. The immunoprecipitates were incubated with KD-InsR in a kinase assay system, followed by western blot analysis.
Figure 5
Figure 5
Recombinant mTOR promotes IGF-IR/InsR phosphorylation and activation. (A) 50 ng of recombinant IGF-IR was incubated with or without mTOR at the indicated amount in a kinase assay system, followed by western blot analysis and quantification. Values represent mean ± SD. *P < 0.05; **P < 0.01. (B) 50 ng of recombinant InsR was incubated with or without mTOR at the indicated amount in a kinase assay system, followed by western blot analysis. Values represent mean ± SD. *P < 0.05; **P < 0.01; ***P < 0.001. (C) 50 ng of recombinant IRS1 was incubated with or without 50 ng of mTOR and IGF-IR in a kinase assay system, followed by western blot analysis. Values represent mean ± SD. ***P < 0.001. (D) 50 ng of recombinant IRS1 was incubated with or without 50 ng of mTOR and InsR in a kinase assay system, followed by western blot analysis. Values represent mean ± SD. ***P < 0.001. (E) 15 ng of recombinant IGF-IR was incubated with or without 15 ng of mTOR protein, and 300 ng peptide substrate of IGF-IR in a kinase assay system, followed by detection of IGF-IR kinase activity. The relative kinase activity is plotted. Values represent mean ± SD (n = 4). **P < 0.01. (F) 15 ng of recombinant InsR was incubated with or without 15 ng of mTOR protein, and 300 ng peptide substrate of InsR in a kinase assay system, followed by detection of InsR kinase activity. The relative kinase activity is plotted. Values represent mean ± SD (n = 4). **P < 0.01. A representative of two or more experiments is shown.
Figure 6
Figure 6
mTOR exhibits tyrosine kinase activity and phosphorylates tyrosine residues in IGF-IR/InsR. (A-D) In vitro kinase assays. Tyrosine phosphorylation was detected by ELISA with 4G10 antibody. The plates in A were coated with poly(Glu-Tyr). The plates in B were coated with peptide fragment shared by IGF-IR and InsR (TRDIYETDYYRKG). The plates in C were coated with peptide fragment shared by IGF-IR and InsR (TRDIYETDYYRKG), followed by kinase assay in the presence of normal IgG or anti-mTOR antibody. The plates in D were coated with recombinant InsR protein. Values represent mean ± SD (n = 3). **P < 0.001. (E) Dot blot analysis of tyrosine phosphorylation in poly(Glu-Tyr) peptide reacted with or without InsR, mTOR and Torin2. (F) Dot blot analysis of tyrosine phosphorylation in IGF-IR/InsR peptide reacted with or without InsR, mTOR and Torin2. (G) Steady-state kinetic parameters of mTOR and InsR towards individual peptide substrates determined by ELISA with 4G10 or p-Akt (S473) antibody. (H) Immunoprecipitated raptor, rictor and mTOR complexes were incubated with poly(Glu-Tyr) in the absence or presence of Torin2 in a kinase assay system, followed by ELISA detection of tyrosine phosphorylation with 4G10. **P < 0.001. (I) Immunoprecipitated raptor, rictor and mTOR complexes were incubated with IGF-IR/InsR peptide in the absence or presence of Torin2 in a kinase assay system, followed by ELISA detection of tyrosine phosphorylation with 4G10. **P < 0.001. A representative of two or more experiments is shown.
Figure 7
Figure 7
mTOR phosphorylates tyrosine residues in IGF-IR/InsR. (A) In an in vitro kinase assay system, 15 ng of recombinant mTOR was incubated with 300 ng of peptide shared by IGF-IR and InsR (TRDIYETDYYRKG) with or without mutations within the triple tyrosine cluster. WT, wild-type. The mutated residues in IGF-IR and InsR are indicated by blue labels and green labels, respectively. The relative phosphorylation by mTOR kinase was plotted. The responsiveness to mTOR kinase in WT group is set as 100%. Values represent mean ± SD (n = 3). *P < 0.01; **P < 0.001. (B) ELISA detection of Y1131 (IGF-IR)/Y1146 (InsR) phosphorylation. Y1131A (IGF-IR)/Y1146A(InsR) mutant peptide served as a negative control. Values represent mean ± SD (n = 3). **P < 0.001. (C) ELISA detection of Y1135 (IGF-IR)/Y1150 (InsR) phosphorylation. Y1135A (IGF-IR)/Y1150A (InsR) peptide served as a negative control. Values represent mean ± SD (n = 3). **P < 0.001. (D) ELISA detection of Y1136 (IGF-IR)/Y1151 (InsR) phosphorylation. Y1136A (IGF-IR)/Y1151A (InsR) peptide served as a negative control. Values represent mean ± SD (n = 3). **P < 0.001. (E) ELISA detection of the effect of Y1131 (IGF-IR)/Y1146 (InsR) on Y1136 (IGF-IR)/Y1151 (InsR) phosphorylation. Values represent mean ± SD (n = 3). **P < 0.001. (F) Dot blot analysis of mTOR- or InsR-induced Y1131 (IGF-IR)/Y1146 (InsR) phosphorylation in peptide substrates. Y1131A (IGF-IR)/Y1146A (InsR) peptide served as a negative control. (G) Dot blot analysis of mTOR- or InsR-induced Y1135 (IGF-IR)/Y1150 (InsR) phosphorylation in IGF-IR/InsR peptide. Y1135A (IGF-IR)/Y1150A (InsR) peptide served as a negative control. (H) Dot blot analysis of mTOR-induced Y1136 (IGF-IR)/Y1151 (InsR) phosphorylation. Y1136A (IGF-IR)/Y1151A (InsR) peptide served as a negative control. (I) Dot blot analysis of the effect of Y1131 (IGF-IR)/Y1146 (InsR) mutation on mTOR-induced Y1136 (IGF-IR)/Y1151 (InsR) phosphorylation. A representative of three experiments is shown.
Figure 8
Figure 8
mTOR differentially affects the kinase activity of wild-type (WT) IGF-IR/InsR and their mutants. (A) Serum-starved MDA-MB-453 cells were transfected with WT or mutated IGF-IR (Y1131F, Y1131/1136F, kinase-dead K1003R), followed by immunoprecipitation with IGF-IR antibody. The immunoprecipitated proteins were incubated with or without recombinant mTOR and IRS1 in kinase assay system, followed by western blot analysis and quantification. Values represent mean ± SD. **P < 0.001. (B) Serum-starved MDA-MB-453 cells were transfected with vectors expressing GFP-tagged WT or mutated InsR (Y1146F, Y1146/1151F, kinase-dead K1018A), followed by immunoprecipitation with GFP antibody. The immunoprecipitated proteins were incubated with recombinant mTOR and/or IRS1 in kinase assay system, followed by western blot analysis. Values represent mean ± SD. **P < 0.001. A representative of three experiments is shown.
Figure 9
Figure 9
Rictor stimulates IGF-I-induced cellular proliferation. (A) The effect of rictor knockdown on IGF-I-induced HepG2 cell proliferation determined by EdU labeling. The percentage of EdU-labelled cells is plotted. Values represent mean ± SD (n = 3). *P < 0.05; **P < 0.01. A representative of two independent experiments in triplicate is shown. The efficiency of rictor knockdown is determined by western blotting. (B) The effect of rictor knockdown on insulin-induced SMMC-7721 cell proliferation determined by EdU labeling. The percentage of EdU-labelled cells is plotted. Values represent mean ± SD (n = 3). A representative of two independent experiments in triplicate is shown. *P < 0.05; **P < 0.01. The efficiency of rictor knockdown is determined by western blotting. (C) The effect of rictor overexpression, AG1024, Akt inhibitor IX and MEK inhibitor U0126 on HepG2 cell proliferation in serum-containing medium determined by EdU labeling. The proliferation rate was plotted. Values represent mean ± SD (n = 3). *P < 0.05; ***P < 0.001. A representative of two independent experiments in triplicate is shown. (D) Western blot analysis of rictor expression, IGF-IR, Akt and ERK1/2 phosphorylation in C is shown. (E) The effect of rictor overexpression, AG1024 and Akt inhibitor IX on HepG2 cell proliferation in serum-free medium with or without IGF-I. The proliferation rate is plotted. Values represent mean ± SD (n = 3). *P < 0.05; ***P < 0.001. A representative of two independent experiments in triplicate is shown. (F) Western blot analysis of rictor expression, IGF-IR and Akt phosphorylation in E is shown. (G) Immunoprecipitation of rictor from HepG2 cells transfected with or without rictor plasmid. (H) Model for mTOR in IGF-IR/InsR signaling. IRS1/2 recruits mTORC2 to IGF-IR/InsR, leading to the promotion of ligand-induced phosphorylation and activation of IGF-IR/InsR by mTORC2. As adaptor protein, IRS1/2 also connects IGF-IR/InsR to their downstream effector such as PI3K, which activates Akt/mTORC1/S6K1 axis and mTORC2. Activation of mTORC1 and S6K1 leads to feedback inhibition of IRS and rictor-mTOR complex.

References

    1. Kim J, Kundu M, Viollet B, Guan KL. AMPK and mTOR regulate autophagy through direct phosphorylation of Ulk1. Nat Cell Biol 2011; 13:132–141. - PMC - PubMed
    1. Laplante M, Sabatini DM. mTOR signaling in growth control and disease. Cell 2012; 149:274–293. - PMC - PubMed
    1. Ben-Sahra I, Howell JJ, Asara JM, Manning BD. Stimulation of de novo pyrimidine synthesis by growth signaling through mTOR and S6K1. Science 2013; 339:1323–1328. - PMC - PubMed
    1. Robitaille AM, Christen S, Shimobayashi M, et al. Quantitative phosphoproteomics reveal mTORC1 activates de novo pyrimidine synthesis. Science 2013; 339:1320–1323. - PubMed
    1. Jacinto E, Loewith R, Schmidt A, et al. Mammalian TOR complex 2 controls the actin cytoskeleton and is rapamycin insensitive. Nat Cell Biol 2004; 6:1122–1128. - PubMed

Publication types

MeSH terms