

Global, regional, and national levels and trends in maternal mortality between 1990 and 2015, with scenario-based projections to 2030: a systematic analysis by the UN Maternal Mortality Estimation Inter-Agency Group
- PMID: 26584737
- PMCID: PMC5515236
- DOI: 10.1016/S0140-6736(15)00838-7
Global, regional, and national levels and trends in maternal mortality between 1990 and 2015, with scenario-based projections to 2030: a systematic analysis by the UN Maternal Mortality Estimation Inter-Agency Group
Abstract
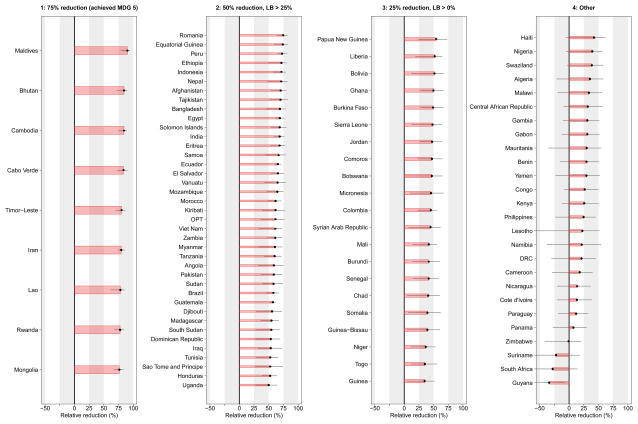
Background: Millennium Development Goal 5 calls for a 75% reduction in the maternal mortality ratio (MMR) between 1990 and 2015. We estimated levels and trends in maternal mortality for 183 countries to assess progress made. Based on MMR estimates for 2015, we constructed projections to show the requirements for the Sustainable Development Goal (SDG) of less than 70 maternal deaths per 100,000 livebirths globally by 2030.
Methods: We updated the UN Maternal Mortality Estimation Inter-Agency Group (MMEIG) database with more than 200 additional records (vital statistics from civil registration systems, surveys, studies, or reports). We generated estimates of maternal mortality and related indicators with 80% uncertainty intervals (UIs) using a Bayesian model. The model combines the rate of change implied by a multilevel regression model with a time-series model to capture data-driven changes in country-specific MMRs, and includes a data model to adjust for systematic and random errors associated with different data sources.
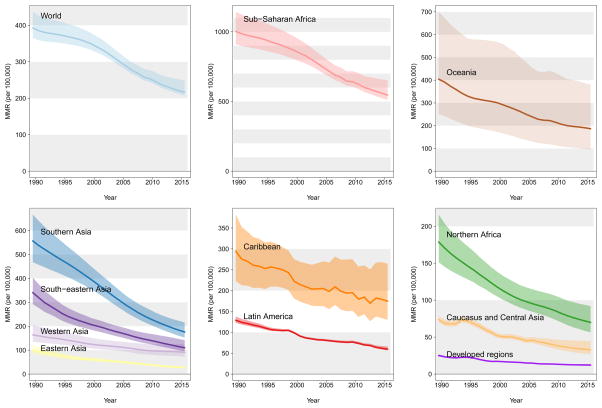
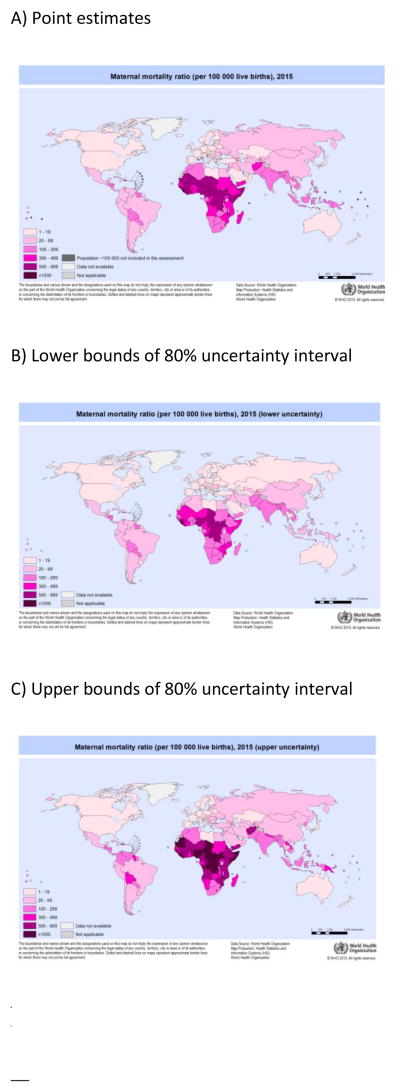
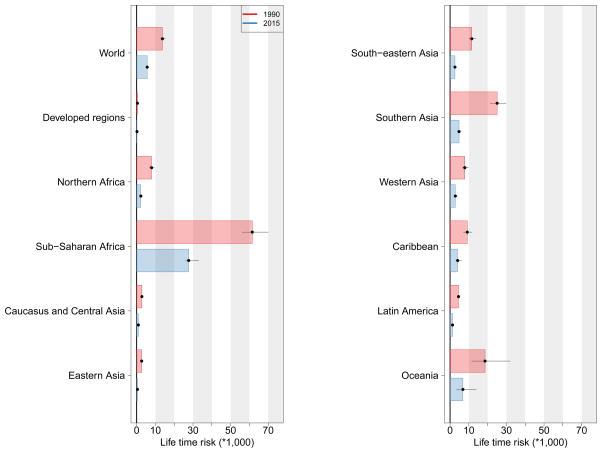
Results: We had data for 171 of 183 countries. The global MMR fell from 385 deaths per 100,000 livebirths (80% UI 359-427) in 1990, to 216 (207-249) in 2015, corresponding to a relative decline of 43·9% (34·0-48·7), with 303,000 (291,000-349,000) maternal deaths worldwide in 2015. Regional progress in reducing the MMR since 1990 ranged from an annual rate of reduction of 1·8% (0·0-3·1) in the Caribbean to 5·0% (4·0-6·0) in eastern Asia. Regional MMRs for 2015 ranged from 12 deaths per 100,000 livebirths (11-14) for high-income regions to 546 (511-652) for sub-Saharan Africa. Accelerated progress will be needed to achieve the SDG goal; countries will need to reduce their MMRs at an annual rate of reduction of at least 7·5%.
Interpretation: Despite global progress in reducing maternal mortality, immediate action is needed to meet the ambitious SDG 2030 target, and ultimately eliminate preventable maternal mortality. Although the rates of reduction that are needed to achieve country-specific SDG targets are ambitious for most high mortality countries, countries that made a concerted effort to reduce maternal mortality between 2000 and 2010 provide inspiration and guidance on how to accomplish the acceleration necessary to substantially reduce preventable maternal deaths.
Funding: National University of Singapore, National Institute of Child Health and Human Development, USAID, and the UNDP/UNFPA/UNICEF/WHO/World Bank Special Programme of Research, Development and Research Training in Human Reproduction.
Copyright © 2016 World Health Organization. Published by Elsevier Ltd/Inc/BV. All rights reserved. Published by Elsevier Ltd.. All rights reserved.
Conflict of interest statement
We declare that we have no conflicts of interest.
Figures
Comment in
-
Modest global achievements in maternal survival: more focus on sub-Saharan Africa is needed.Lancet. 2016 Jan 30;387(10017):410-1. doi: 10.1016/S0140-6736(16)00099-4. Lancet. 2016. PMID: 26869551 No abstract available.
-
Contemporary Issues in Women's Health.Int J Gynaecol Obstet. 2019 Jul;146(1):36-38. doi: 10.1002/ijgo.12845. Int J Gynaecol Obstet. 2019. PMID: 31173357
References
-
- UN General Assembly. United Nations Millennium Declaration, Resolution Adopted by the General Assembly; 18 September 2000; [accessed 14 September 2015]. A/RES/55/2.
-
- WHO, UNICEF. Revised 1990 estimates of maternal mortality: a new approach by WHO and UNICEF. Geneva: World Health Organization; 1996.
-
- WHO, UNICEF, UNPFA. Maternal mortality in 1995: estimates developed by WHO, UNICEF, UNFPA. Geneva: World Health Organization; 2001.
-
- WHO, UNICEF, UNFPA. Maternal mortality in 2000: estimates developed by WHO, UNICEF and UNFPA. Geneva: World Health Organization; 2003.
-
- WHO, UNICEF, UNFPA, The World Bank. Estimates developed by WHO, UNICEF and UNFPA. Geneva: World Health Organization; 2007. Maternal mortality in 2005.
Publication types
MeSH terms
Grants and funding
LinkOut - more resources
Full Text Sources
Other Literature Sources
Medical
