. 2015 Nov 23;35(4):497-512.
doi: 10.1016/j.devcel.2015.10.015. Epub 2015 Nov 12.

Proteomics of Primary Cilia by Proximity Labeling

Affiliations

Proteomics of Primary Cilia by Proximity Labeling

David U Mick et al. Dev Cell. .

Abstract

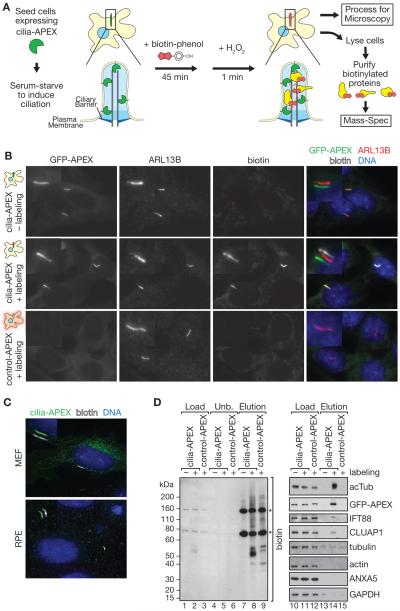
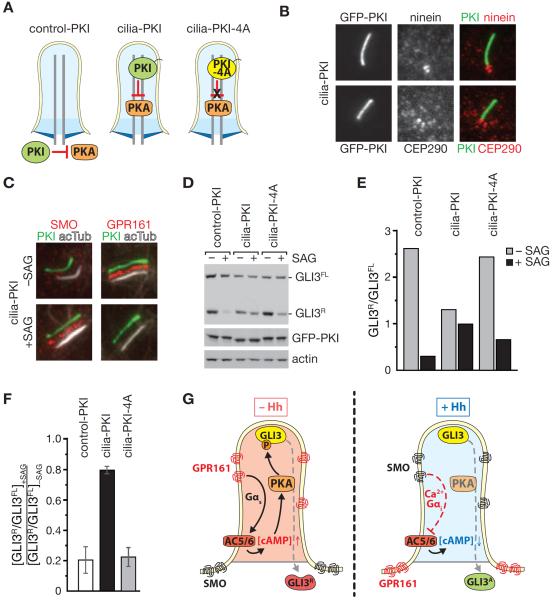
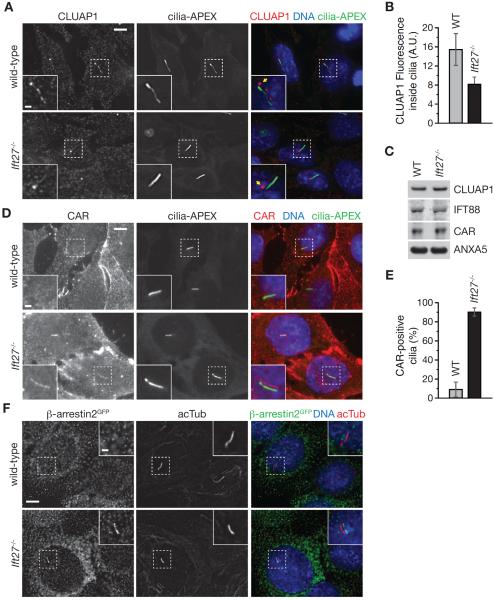
While cilia are recognized as important signaling organelles, the extent of ciliary functions remains unknown because of difficulties in cataloguing proteins from mammalian primary cilia. We present a method that readily captures rapid snapshots of the ciliary proteome by selectively biotinylating ciliary proteins using a cilia-targeted proximity labeling enzyme (cilia-APEX). Besides identifying known ciliary proteins, cilia-APEX uncovered several ciliary signaling molecules. The kinases PKA, AMPK, and LKB1 were validated as bona fide ciliary proteins and PKA was found to regulate Hedgehog signaling in primary cilia. Furthermore, proteomics profiling of Ift27/Bbs19 mutant cilia correctly detected BBSome accumulation inside Ift27(-/-) cilia and revealed that β-arrestin 2 and the viral receptor CAR are candidate cargoes of the BBSome. This work demonstrates that proximity labeling can be applied to proteomics of non-membrane-enclosed organelles and suggests that proteomics profiling of cilia will enable a rapid and powerful characterization of ciliopathies.


Figures

Figure 1
Figure 1. Cilia-APEX specifically biotinylates ciliary proteins
(A) Diagram of the cilia-APEX labeling strategy. Cells expressing cilia-APEX (or control-APEX) were seeded at high density and ciliation induced by serum-starvation. Cells were pre-incubated with 0.5 mM biotin-phenol for 45 min, labeled for 1 min by addition of 1 mM H2O2 and the reaction terminated by washing the cells in quenching buffer. Cells were either immediately lysed or fixed for processing for immunofluorescence microscopy. (B) Immunofluorescence of stable IMCD3 cell lines expressing control-APEX or cilia-APEX in the presence or the absence of labeling reagents. APEX fusion proteins were directly detected by GFP fluorescence, ARL13B is a cilium marker detected by antibody and biotinylated proteins were revealed by SA647. Merged insets show primary cilia with channels shifted to aid visualization. Scale bars in (B) and (C) are 5 μm (main panels) and 1 μm (insets). (C) Immunofluorescence microscopy of mouse embryo fibroblast (MEF) and human retina pigment epithelial (RPE) cells after transient transfection with cilia-APEX (see Figure S1 for individual channels). (D) Biotinylated proteins from cell lysates generated from control-APEX or cilia-APEX after APEX-labeling (+) or from cilia-APEX after mock-labeling (biotin-phenol was omitted; −) were isolated by Strepatvidin chromatography and samples analyzed by SDS-PAGE and Western Blotting. Biotinylated proteins were detected by streptavidin-HRP and indicated proteins by specific antibodies. Asterisks indicate endogenous biotinylated proteins. Note the slower migration of the control-APEX enzyme caused by the absence of the myristoyl moiety (lanes 11 vs. 12). Also note that the cilia-APEX enzyme is efficiently biotinylated whereas control-APEX is not, suggesting that APEX does not undergo self-biotinylation. Load and Unbound represent 0.1 % of the total lysate and Elution 10 % of the total eluate. See also Figure S1.
Figure 2
Figure 2. Ciliary proteins from APEX-labeling in IMCD3 cells
(A) Venn diagram showing identified proteins after streptavidin chromatography from the indicated APEX-labeling reactions. The number in the yellow segment represents cilia-specific proteins enriched at least 5-fold in the experimental sample compared to both controls. (B) Venn diagram showing the overlap of cilia-specific proteins between the three independent replicates. The yellow segment represents candidate ciliary proteins identified in at least 2 out of 3 experiments and with a total spectral count ≥6 (Tier 1). (C) Candidate ciliary proteins from (B) grouped into functional categories. Asterisks denote cilia-specific proteins from Tier 2 that are known interaction partners of Tier 1 proteins. Previously known ciliary proteins are shown in grey, novel candidate ciliary proteins in black. Blue are novel ciliary proteins confirmed by independent methods in this study (see Figures 3, 5 and S2). The complete list of identified proteins is shown in Table S1. (D) IMCD3 cells were transiently transfected with the indicated fusion proteins for 24 h, after which ciliation was induced for another 24 h before cells were fixed in 4% paraformaldehyde, permeabilized with 0.1% Triton-X100 and proteins detected by GFP fluorescence (LAP-SKA1), anti-FLAG or anti-HA antibodies. Cilia were counterstained using anti-ARL13B or anti-acTub antibodies as indicated. Only merged images are shown (see Figure S2 for individual channels). Merged insets show primary cilia with channels shifted to aid visualization. Scale bars represent 5 μm (main panels) and 1 μm (insets). (E) Table comparing prominent protein categories identified in primary cilia by PCP (Ishikawa et al., 2012) vs. cilia-APEX. Note the absence of ribosomal subunits and chaperones, frequent contamination of proteomic studies in the cilia-APEX proteome. See also Figure S2.
Figure 3
Figure 3. AC6 and PKA are present in IMCD3 cilia
(A) Cultured mouse cortical neurons (DIV 15) and serum-starved IMCD3 cells were fixed in 4% paraformaldehyde (PFA) and analyzed by immunostaining for AC3 and glutamylated tubulin (GluTub). AC3 channels were normalized to one another. (B) IMCD3 cells were starved for 16 h to induce ciliation and fixed in 4% PFA. After permeabilization with 0.1% saponin, cells were incubated overnight with antibodies against AC5/6 and acetylated tubulin. Images showing AC5/6 localization were deconvolved. (C) IMCD3 cells stably expressing NG-PKARIα were processed and imaged as in (B). Insets show primary cilia, merged insets are offset to aid visualization. All scale bars are 5 μm (main panels) and 1 μm (insets).
Figure 4
Figure 4. Cilium-specific inhibition of PKA perturbs GLI3 processing during Hedgehog signaling
(A) Diagrams of cell lines expressing cilia-PKI to inhibit PKA activity within primary cilia, the non-inhibiting mutant cilia-PKA-4A, and control-PKI expressed in the cytosol. (B) Ciliated IMCD3-[cilia-PKI] cells stained for ninein and CEP290. Cilia-PKI was detected by GFP fluorescence. Scale bar: 1 μm. (c–f) Ciliated cells were treated with 200 mM SAG or vehicle control for 16 h. (C) IMCD3-[cilia-PKI] cells were stained for acetylated Tubulin, GPR161 or SMO. Channels were shifted to aid visualization (see Figure S3 for individual channels and control cell lines). (D–E) Indicated cell lines were analyzed by immunoblotting for GLI3, GFP and actin (D), the GLI3R and GLI3FL signals were quantified by densitometry (ImageJ) and the GLI3R/GLI3FL ratios plotted in (E). (F) The effect of SAG addition on the GLI3R/GLI3FL ratios was measured. The average from 3 independent experiments is shown. Error bars depict standard deviations (n = 3). (G) Model depicting the ciliary AC/cAMP/PKA signaling axis during Hedgehog signaling. See text for details. See also Figure S3.
Figure 5
Figure 5. LKB1 localization to IMCD3 cilia is mediated by STRADβ palmitoylation
(A) IMCD3 cells were transiently transfected with STRADβ3xFLAG, serum-starved for 16 h and fixed in 4% PFA and stained with anti-FLAG, anti-LKB1 and anti-acTub antibodies to visualize the primary cilium. (B) Multiple sequence alignment of STRADα and STRADβ from five different organisms each using ClustalW 2.0.11. Black boxes indicate identical residues in at least 4 out of 5 species; grey boxes indicate similar amino acids. Black underlining indicates the STRAD core domain used for crystallization in (Zeqiraj et al., 2009). Only the N-terminal part of alignment is shown. Hs, Homo sapiens; Mm, Mus musculus; Bt, Bos taurus; Dr, Danio rerio; Xl, Xenopus laevis; Xt, Xenopus tropicalis. (C) IMCD3 cells were co-transfected with LKB1-NG and indicated STRAD isoforms and mutants and analyzed as in (A). (D) Ift27−/− and wild-type IMCD3 cells stably expressing NG-AMPKβ2 were analyzed as in Figure 3C. All scale bars are 5 μm (main panels) and 1 μm (insets).
Figure 6
Figure 6. Comparative cilia-APEX proteomics identifies proteins accumulating in or depleted from Ift27−/− cilia
(A) Cilia-APEX labeling, streptavidin chromatography and LC-MS/MS were performed in three independent experiments in WT and Ift27−/− cells. The y-axis represents the log2-transformed ratios of average spectral counts between Ift27−/− and wild-type samples (see Methods for analytical approach). Each vertical line represents one protein. The mean (μ) and standard deviation (σ) of log2[SpC(Ift27−/−)/SpC(WT)] calculated for a control group of 118 mitochondrial proteins are 0.29 and 0.62, respectively, leading to significance thresholds of 1.98 (μ + 2.75σ) and −1.40 (μ − 2.75σ) indicated by dashed red lines. Insets show magnified views of the significantly enriched (top) and depleted (bottom) proteins. BBSome subunits and LZTFL1 are shown in green and proteins whose abundance is altered by IFT27 deletion and was confirmed by fluorescence microscopy are shown in orange. (B) Proteins from selected functional groups are displayed. See also Figure S4.
Figure 7
Figure 7. Validation of CLUAP1 depletion and CAR and β-arrestin 2 enrichment in Ift27−/− cilia
(A) Wild-type and Ift27−/− cells expressing cilia-APEX were starved for 16 h to induce ciliation, fixed in 4% PFA, permeabilized using 0.1% saponin and stained for endogenous CLUAP1. Merged insets show primary cilia with channels shifted to aid visualization. Yellow arrows point at the basal body. (B) Ciliary CLUAP1 signals in cilia were quantified in wild-type (n = 52) and Ift27−/−(n = 42). Error bars depict standard error of the mean. (C) Western blots of wild-type and Ift27−/− cell lysates. (D) Immunofluorescence microscopy as in (A) using anti-CAR antibody to stain native CAR. (E) Number of CAR-positive (CAR+) and CAR-negative (CAR−) cilia were counted in indicated cell lines and displayed as bar graphs. Error bars depict standard deviations (n = 3). (F) Wild-type and Ift27−/− cells stably expressing β-arrestin2-GFP were analyzed by fluorescent microscopy as in (A). All scale bars are 5 μm (main panels) and 1 μm (insets). See also Figure S5.

Comment in

References

    1. Anholt RR. Molecular physiology of olfaction. Am J Physiol. 1989;257:C1043–C1054. - PubMed
    1. Barzi M, Berenguer J, Menendez A, Alvarez-Rodriguez R, Pons S. Sonic-hedgehog-mediated proliferation requires the localization of PKA to the cilium base. J Cell Sci. 2010;123:62–69. - PubMed
    1. Barzi M, Kostrz D, Menendez A, Pons S. Sonic Hedgehog-induced proliferation requires specific Gα inhibitory proteins. Journal of Biological Chemistry. 2011;286:8067–8074. - PMC - PubMed
    1. Bettencourt-Dias MB, Hildebrandt F, Pellman D, Woods G, Godinho SA. Centrosomes and cilia in human disease. Trends Genet. 2011;27:307–315. - PMC - PubMed
    1. Bishop GA, Berbari NF, Lewis J, Mykytyn K. Type III adenylyl cyclase localizes to primary cilia throughout the adult mouse brain. J Comp Neurol. 2007;505:562–571. - PubMed

Publication types

MeSH terms