. 2015 Dec 14;28(6):800-814.
doi: 10.1016/j.ccell.2015.10.003. Epub 2015 Nov 12.

Mist1 Expressing Gastric Stem Cells Maintain the Normal and Neoplastic Gastric Epithelium and Are Supported by a Perivascular Stem Cell Niche

Affiliations

Mist1 Expressing Gastric Stem Cells Maintain the Normal and Neoplastic Gastric Epithelium and Are Supported by a Perivascular Stem Cell Niche

Yoku Hayakawa et al. Cancer Cell. .

Abstract

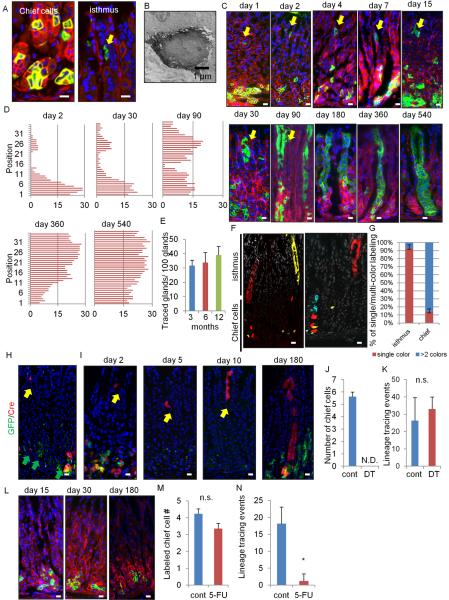
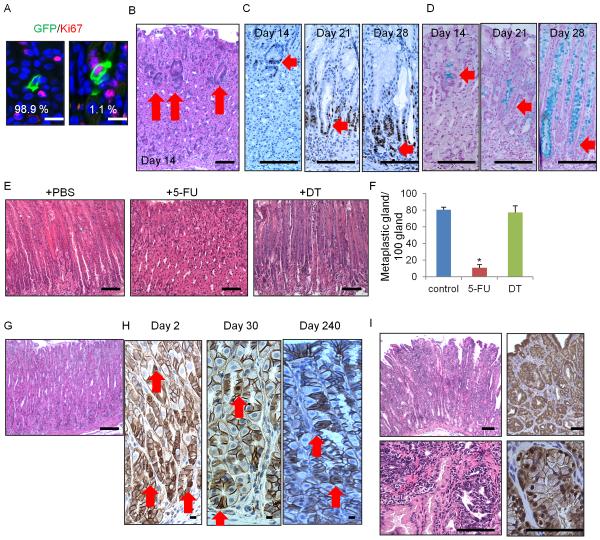
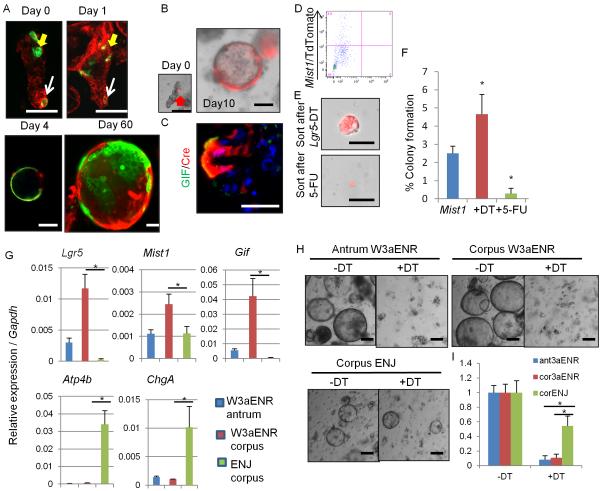
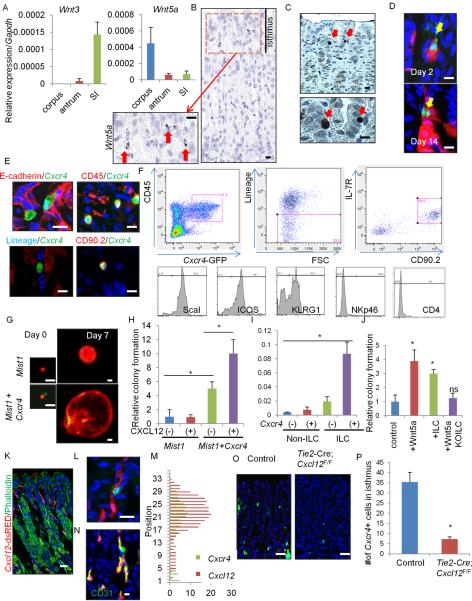
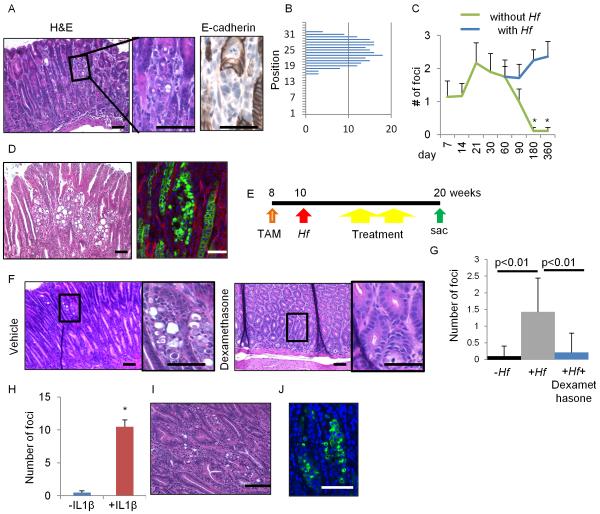
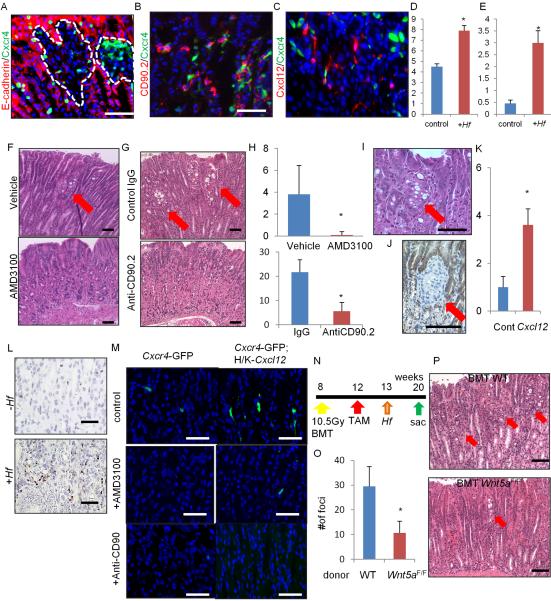
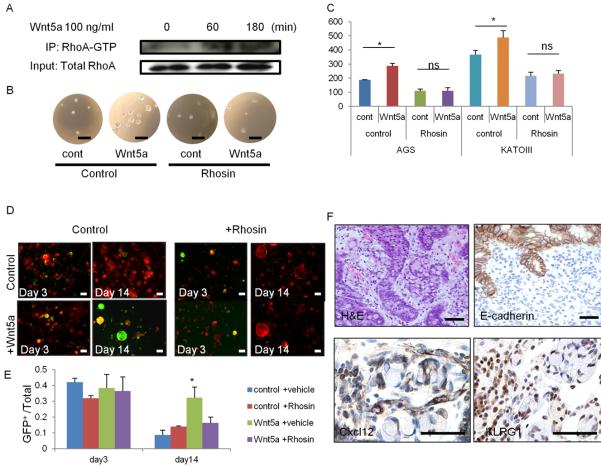
The regulation and stem cell origin of normal and neoplastic gastric glands are uncertain. Here, we show that Mist1 expression marks quiescent stem cells in the gastric corpus isthmus. Mist1(+) stem cells serve as a cell-of-origin for intestinal-type cancer with the combination of Kras and Apc mutation and for diffuse-type cancer with the loss of E-cadherin. Diffuse-type cancer development is dependent on inflammation mediated by Cxcl12(+) endothelial cells and Cxcr4(+) gastric innate lymphoid cells (ILCs). These cells form the perivascular gastric stem cell niche, and Wnt5a produced from ILCs activates RhoA to inhibit anoikis in the E-cadherin-depleted cells. Targeting Cxcr4, ILCs, or Wnt5a inhibits diffuse-type gastric carcinogenesis, providing targets within the neoplastic gastric stem cell niche.


Figures

Figure 1
Figure 1. Mist1 is a marker of quiescent stem cells in the corpus isthmus
(A) The corpus of Mist1-CreERT2;R26-mTmG mice day 1 after 3 mg TAM. Left: chief cells; right: isthmus cells (arrow). (B) Electron microscopy of Mist1+ cells in the isthmus. (C) Lineage tracing in Mist1-CreERT2;R26-mTmG mice from day 1 – 540. The arrow indicates the isthmus cells. (D) Mist1-traced cell position. Total 50 glands are analyzed at each time points. (E) The number of traced glands per 100 glands at 3, 6, and 12 months. Total 300 glands from 3 mice are used at each time points. (F–G) Mist1-CreERT2;R26-Confetti mice 8 months after TAM (F). Single color and multi-color clones in the isthmus and chief cells are quantified (G). Total 50 glands are analyzed. (H–I) Mist1-CreERT2;Lgr5-DTR-GFP (green);R26-TdTomato (red) mouse corpus 24 hr after TAM (H), and 2, 5, 10, and 180 days after TAM + DT ablation (I). Yellow arrows; Mist1+ isthmus cell tracing, green arrows; Lgr5+ chief cells. (J–K) The numbers of labeled chief cells per gland (J, day 4) and lineage tracing events per 100 gland (K, day 30) with or without DT ablation. (L) Lineage tracing in 5-FU-treated Mist1-CreERT2;R26-mTmG mouse corpus. Refer to Figure 1C for control images. (M–N) The numbers of labeled chief cells per gland 4 days after TAM (cont) or TAM + 5-FU (5-FU) treatments (M) and the number of lineage tracing events per 100 gland on day 30 (N). Total 500 glands from 5 mice/group are analyzed for (J–K) and (M–N). Bars=1 μm (B), 10 μm (A, C, F, H–I, L). Means ± SEM. *p < 0.05. See also Figure S1.
Figure 2
Figure 2. Mist1+ isthmus cells give rise to IM and IGC
(A) Ki67 (red) and GFP staining (green) of Mist1-CreERT2;R26-mTmG mice at day2. (B–D) H&E (B), Ki67 (C), and alcian blue (D) staining in Mist1-CreERT2;LSL-KrasG12D mice on days 14, 21, and 28 after induction. Arrows indicate itshmus-derived dysplastic cells. (E–F) H&E staining (E) and numbers of metaplastic glands per 100 glands (F) of Mist1-CreERT2;LSL-KrasG12D;Lgr5-DTR-GFP mice treated with PBS (left), 5-FU (middle), or DT (right) 30 days after TAM. Total 300 glands from 3 mice/group are analyzed. (G–H) H&E (G, day 240) and β-catenin (H) staining in Mist1-CreERT2;Apcflox/flox mouse. Arrows indicate nuclear β-catenin+ cells. (I) H&E (left) and β-catenin (right) staining in Mist1-CreERT2;LSL-KrasG12D;Apcflox/flox mouse corpus on day 120 post-induction. Means ± SEM. *p < 0.05. Bars=10 μm (A), 100 μm (B–E, G–I). See also Figure S2.
Figure 3
Figure 3. Mist1+ isthmus cells can form corpus organoids in a Lgr5-independent fashion
(A) Corpus gland culture of TAM-induced Mist1-CreERT2;R26-mTmG mice. Yellow arrows; isthmus cells, white arrows; chief cells. (B–C) Lineage tracing (B) and GIF staining (C, green) of corpus gland culture from Mist1-CreERT2;Lgr5-DTR-GFP;R26-TdTomato mice treated with DT. (D–F) TdTomato+ cells were sorted and cultured from DT or 5-FU-treated Mist1-CreERT2;Lgr5-DTR-GFP;R26-TdTomato mice corpus after TAM. FACS plot (D), images (E), and colony formation efficiency (F) at day 7 are shown. n = 4/group. (G) Relative gene expression per Gapdh in antral or corpus organoids cultured with the indicated media for 10 days. n = 3/group. (H–I) Organoid growth of antrum and corpus glands cultured with W3aENR or ENJ media. Day 10 images (H) and the relative numbers of organoids cultured in the indicated media (I). Numbers in non-DT organoids in each groups are set as 1.0. n = 3/group. Means ± SEM. *p < 0.05. Bars=50 μm. See also Figure S3.
Figure 4
Figure 4. Cxcl12+ vascular endothelial and Cxcr4+ ILCs contribute to corpus stem cell niche through Wnt5a production
(A) Relative expression of Wnt3 and Wnt5a in the corpus, antrum, and small intestine. n = 3/group. (B) In situ hybridization of Wnt5a in the corpus. Arrows indicate Wnt5a+ cells in the isthmus stroma. (C) GFP staining in the Cxcr4-EGFP mouse corpus gland. Arrows indicate GFP+ cells in the isthmus. (D) Lineage tracing in Mist1-CreERT2;Cxcr4-EGFP;R26-TdTomato mice on days 2 and 14. Arrows indicate GFP+ cells. (E) E-cadherin (red), CD45 (red), Lineage (blue), and CD90.2 (red) staining of Cxcr4-EGFP+ cells. (F) FACS plots of gastric Cxcr4+ cells. Top left; gating by CD45+ and Cxcr4-EGFP+. Top middle; gating by Lin. Top right; ILCs are identified by IL-7R+CD90.2+. Bottom; histograms of indicated ILC markers. (G) Single-cell culture of Mist1+ cells (red) with or without Cxcr4+ cell (green) co-culture. (H) Relative colony forming efficiency of Mist1+ cells with Cxcl12 treatment and Cxcr4+ cell co-culture. n = 4/group. Colony formation efficiency of control group is set as 1.0 in (H) and (J). (I) Wnt5a gene expression in Cxcr4+/− ILCs and non-ILC CD45+ cells. n = 3/group. (J) Relative colony forming efficiency of Mist1+ cells with Wnt5a (100 ng/ml), Cxcr4+ ILCs, or Cag-CreERT;Wnt5aflox/flox ILCs. n = 4/group. (K) Cxcl12-dsRED mouse stomach with phalloidin staining (green). (L) Cxcr4-EGFP;Cxcl12-dsRED mouse stomach. (M) Cell positions of Cxcr4+ cells and Cxcl12+ cells. (N) Immunostaining (green) of CD31 in Cxcl12+ cells (red). (O–P) GFP expression (O) and the numbers of GFP+ cells (P) in Cxcr4-EGFP and Tie2-Cre;Cxcl12flox/flox;Cxcr4-EGFP mouse corpus. n = 30/group. Means ± SEM, *p < 0.05. Bars=10 μm (B–E, K, N), 25 μm (G, L, O). See also Figure S4 and Table S1.
Figure 5
Figure 5. E-cadherin loss in Mist1+ cells develops DGC dependent on chronic inflammation
(A–B) H&E and E-cadherin staining (A), and the location (B) of atypical foci in Cdh1ΔMist1 mice (day 10). (C) Numbers of atypical foci per section with or without Hf infection. n = 3 mice/group at each time points. (D) H&E staining (left) and GFP expression (right) in Hf-infected Mist1-CreERT2;Cdh1flox/flox;R26-mTmG mice 18 months after TAM induction. (E) Protocols for TAM, Hf, and therapies (dexamethasone, AMD3100, and anti-CD90.2 Ab). (F–G) H&E staining (F), and numbers of atypical foci per section (G) in Hf-infected Cdh1ΔMist1 mice treated with or without dexamethasone. n = 4 mice/group and 4 sections/mouse are analyzed. (H–J) Numbers of atypical foci per section (H), H&E (I), and GFP staining (J) in Cdh1ΔMist1and Cdh1ΔMist1 mice crossed with H/K-ATPase-IL1β mice after 4 months TAM induction. Means ± SEM. *p < 0.05. Bars=50 μm. See also Figure S5.
Figure 6
Figure 6. Cxcl12/Cxcr4 perivascular niche regulates DGC progression through Wnt5a production
(A–E) E-cadherin (A) and CD90.2 staining (B) (red) of Mist1-CreERT2;Cdh1flox/flox;Cxcr4-EGFP (green) mice, and Mist1-CreERT2;Cdh1flox/flox;Cxcl12-dsRED (red);Cxcr4-EGFP (green) (C) mice treated with TAM and Hf (6 months). Numbers of Cxcl12+ cells (D) and Cxcr4+CD90.2+ cells (E) per gland with or without Hf infection. Total 20 glands per group were analyzed. (F–H) H&E staining of Hf-infected Cdh1ΔMist1 mice treated with or without AMD3100 (F), or treated with control IgG Ab or anti-CD90.2 Ab (G). The numbers of atypical foci per section (H). n = 4 mice/group and 4 sections/mouse are analyzed. Arrows indicate atypical foci. (I–K) H&E (I) and E-cadherin (J) staining, and numbers of atypical foci per section (K) in Cdh1ΔMist1 mice crossed to H/K-ATPase-Cxcl12 mice 3 months after TAM. n = 3 mice/group and 4 sections/mouse are analyzed. Arrows indicate atypical foci. (L) In situ hybridization of Wnt5a in Cdh1ΔMist1 mice with or without Hf infection. (M) Cxcr4-EGFP expression in WT and H/K-ATPase-Cxcl12 mouse stomach treated with control, AMD-3100, or anti-CD90.2 Abs. (N–P) Control or Cag-CreERT;Wnt5aflox/flox mouse bone marrow cells were transplanted into Mist1-CreERT2;H/K-ATPase-Cxcl12;Cdh1flox/flox mice after 10.5 Gy whole body irradiation (N). The numbers (O) of atypical foci per section and H&E staining (P) are shown. n = 4 mice/group and 4 sections/mouse are analyzed. Arrows indicate atypical foci. Means ± SEM. *p < 0.05. Bars=50 μm (A–C, F–G, L–M), 100 μm (I–J, P). See also Figure S6.
Figure 7
Figure 7. RhoA activation by Wnt5a plays a role in DGC development
(A) AGS cells were treated with 100 ng/ml Wnt5a for the indicated times. Cell lysates were immunoprecipitated with RhoA-GTP Ab and immunoblotted with total RhoA Ab. (B–C) Soft-agar sphere forming assay of Wnt5a-treated AGS and KATO-III cells. Cells were treated with vehicle or 30 μM Rhosin. Sphere images (B) and numbers (C) of spheres at day 10. n = 4/group. (D–E) Corpus organoids from TAM-treated Mist1-CreERT2; Cdh1flox/flox; R26-mTmG mice treated with 100 ng/ml Wnt5a and/or 30 μM Rhosin. Images (D) and numbers (E) of GFP+Cdh1 organoids per total organoid number on days 3 and 14. n = 4/group. (F) H&E, E-cadherin, Cxcl12, and KLRG1 staining in human DGC. Bars=100 μm (D), 50 μm (B, F). Means ± SEM. *p < 0.05.

Comment in

References

    1. Arnold K, Sarkar A, Yram MA, Polo JM, Bronson R, Sengupta S, Seandel M, Geijsen N, Hochedlinger K. Sox2(+) adult stem and progenitor cells are important for tissue regeneration and survival of mice. Cell Stem Cell. 2011;9:317–329. - PMC - PubMed
    1. Bando JK, Liang HE, Locksley RM. Identification and distribution of developing innate lymphoid cells in the fetal mouse intestine. Nat Immunol. 2015;16:153–160. - PMC - PubMed
    1. Barker N, Huch M, Kujala P, van de Wetering M, Snippert HJ, van Es JH, Sato T, Stange DE, Begthel H, van den Born M, et al. Lgr5(+ve) stem cells drive self-renewal in the stomach and build long-lived gastric units in vitro. Cell Stem Cell. 2010;6:25–36. - PubMed
    1. Barker N, Ridgway RA, van Es JH, van de Wetering M, Begthel H, van den Born M, Danenberg E, Clarke AR, Sansom OJ, Clevers H. Crypt stem cells as the cells-of-origin of intestinal cancer. Nature. 2009;457:608–611. - PubMed
    1. Buonamici S, Trimarchi T, Ruocco MG, Reavie L, Cathelin S, Mar BG, Klinakis A, Lukyanov Y, Tseng JC, Sen F, et al. CCR7 signalling as an essential regulator of CNS infiltration in T-cell leukaemia. Nature. 2009;459:1000–1004. - PMC - PubMed

Publication types

MeSH terms