. 2015 Nov 20:6:8938.
doi: 10.1038/ncomms9938.

Single-cell analysis and stochastic modelling unveil large cell-to-cell variability in influenza A virus infection

Affiliations

Single-cell analysis and stochastic modelling unveil large cell-to-cell variability in influenza A virus infection

Frank S Heldt et al. Nat Commun. .

Abstract

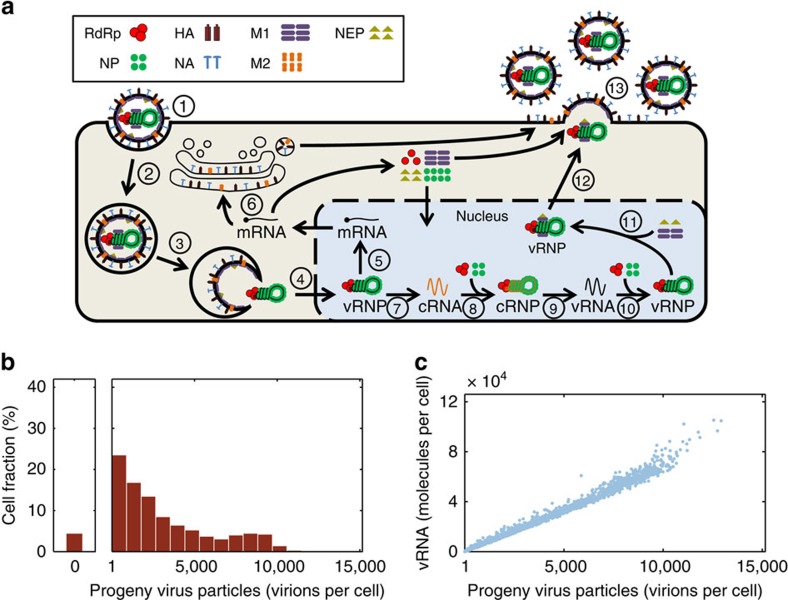
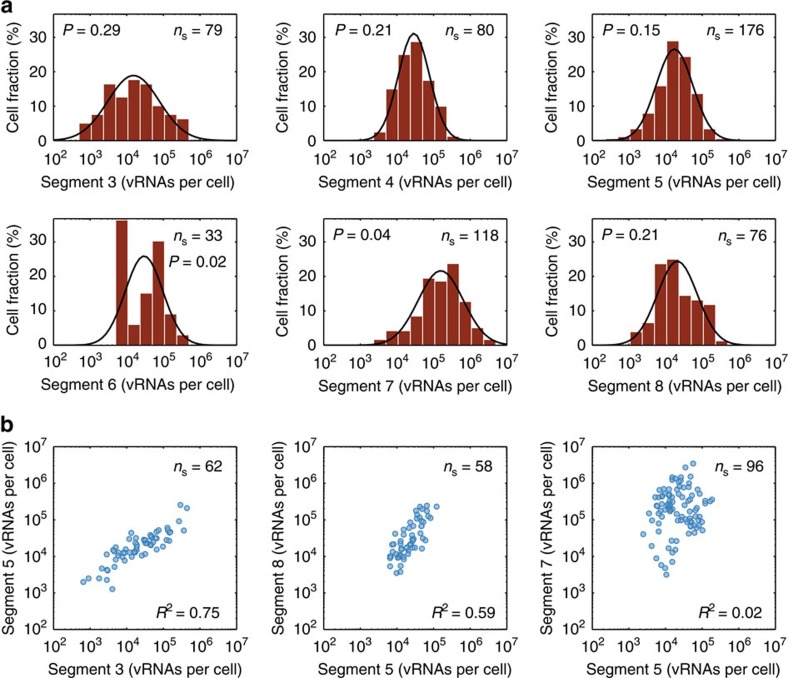
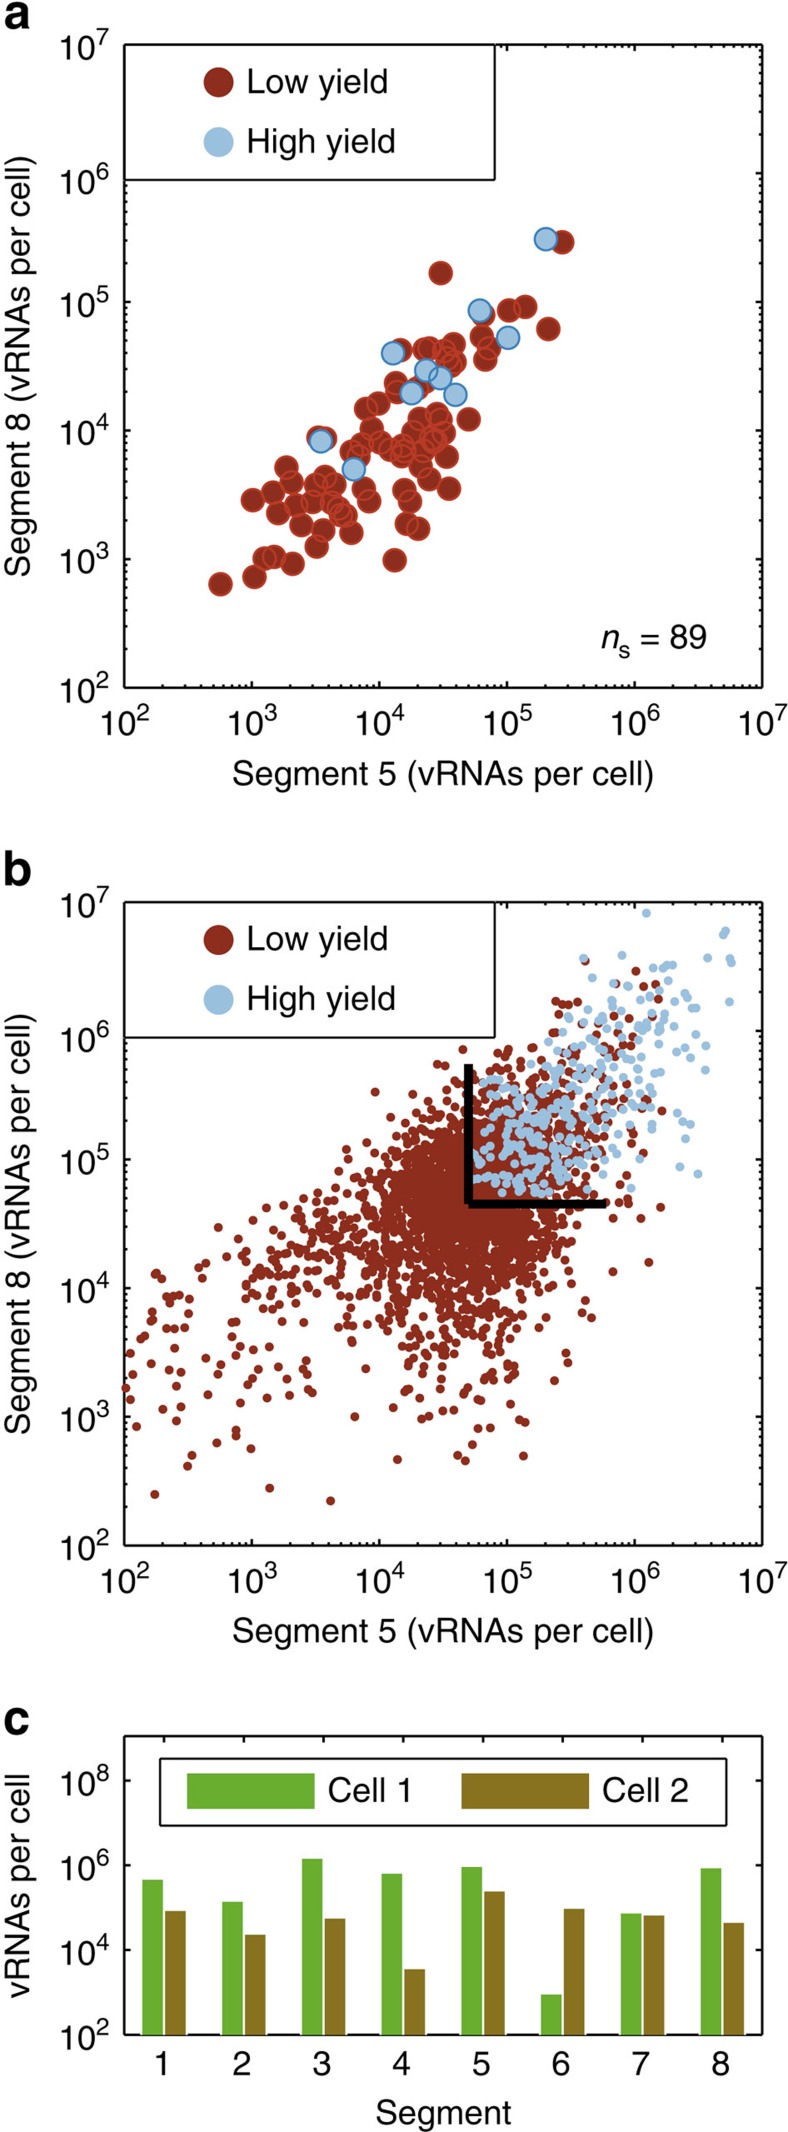
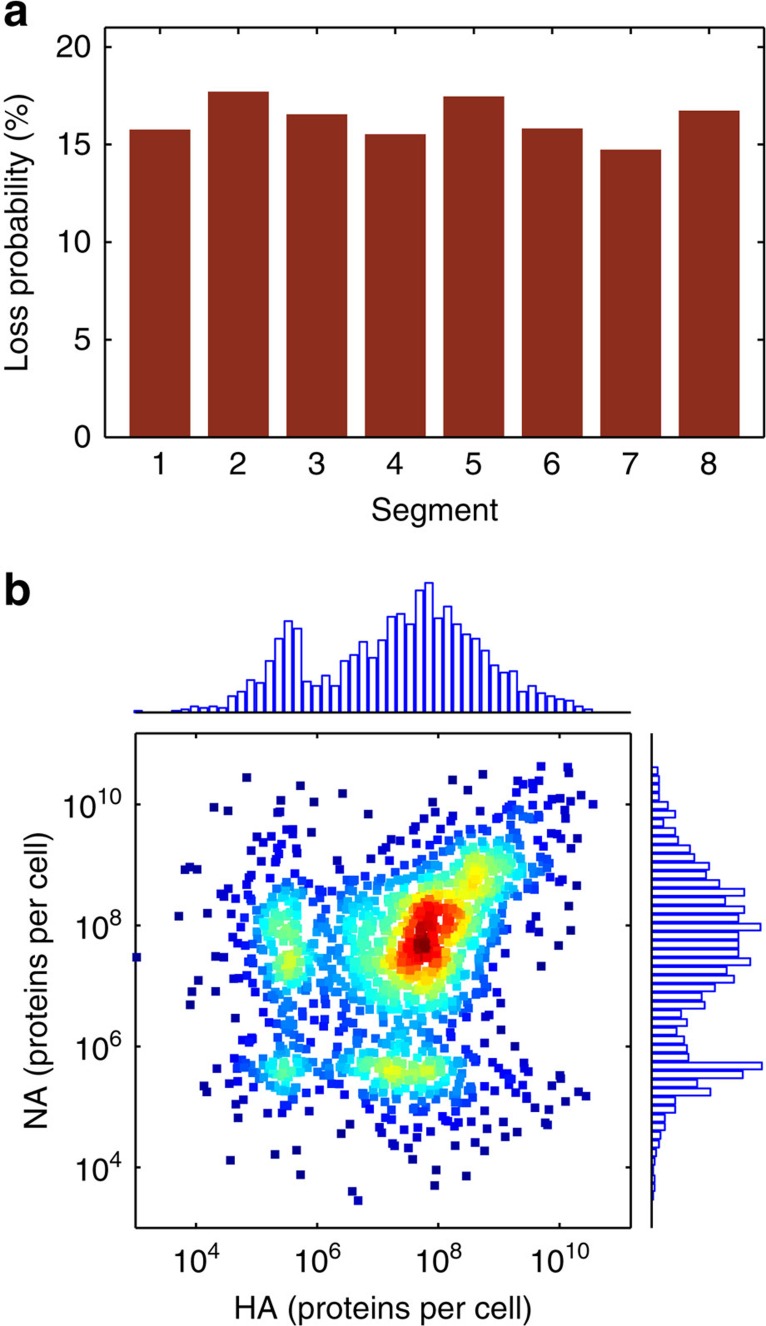
Biochemical reactions are subject to stochastic fluctuations that can give rise to cell-to-cell variability. Yet, how this variability affects viral infections, which themselves involve noisy reactions, remains largely elusive. Here we present single-cell experiments and stochastic simulations that reveal a large heterogeneity between influenza A virus (IAV)-infected cells. In particular, experimental data show that progeny virus titres range from 1 to 970 plaque-forming units and intracellular viral RNA (vRNA) levels span three orders of magnitude. Moreover, the segmentation of IAV genomes seems to increase the susceptibility of their replication to noise, since the level of different genome segments can vary substantially within a cell. In addition, simulations suggest that the abortion of virus entry and random degradation of vRNAs can result in a large fraction of non-productive cells after single-hit infection. These results challenge current beliefs that cell population measurements and deterministic simulations are an accurate representation of viral infections.


Figures

Figure 1
Figure 1. Single-cell analysis approach and virus yields of IAV-infected cells.
(a) Scheme of the experimental procedure. A population of adherent MDCK cells was infected with influenza PR8 virus at an MOI of 10, incubated and afterwards trypsinized to obtain a cell suspension. Subsequently, the diluted cell suspension was transferred to a 384-well plate and wells containing single cells were identified by phase-contrast microscopy. At 12 h.p.i., virus titres in the supernatant were determined by the plaque assay and intracellular vRNAs were quantified by real-time RT–qPCR. (b) Distribution of virus yield. The first bar on the left of the histogram indicates the fraction of cells that show no virus release (0 PFU). Illustration includes pooled data of multiple independent experiments (n=8). (c) Correlation between virus titre and cell size. The pooled results of multiple independent experiments (n=4) are depicted. ns indicates the number of single cells analysed.
Figure 2
Figure 2. Stochastic simulation of IAV replication.
(a) Schematic depiction of the model. Different steps are assigned by numbers: 1, attachment; 2, endocytosis; 3, fusion with late endosomes; 4, nuclear import of vRNPs; 5, viral mRNA transcription; 6, protein translation; 7, replication (cRNA synthesis); 8, cRNA encapsidation; 9, replication (vRNA synthesis); 10, vRNA encapsidation; 11, binding of matrix protein 1 (M1) and nuclear export protein (NEP); 12, nuclear export; 13, virus assembly and budding. HA, haemagglutinin; M2, matrix protein 2; NA, neuraminidase; RdRp, viral RNA-dependent RNA polymerase. (b) Number of progeny virions released by individual infected cells until 12 h.p.i. for an infection at an MOI of 10. (c) Correlation between the vRNA level of the least-abundant genome segment in a cell at 12 h.p.i. and the number of progeny virions produced by that cell for an infection at an MOI of 10.
Figure 3
Figure 3. Distributions of vRNA levels between infected single cells and correlation of vRNA segments.
Cells were infected at an MOI of 10 and analysed for their intracellular vRNA content at 12 h.p.i. via real-time RT–qPCR. nS indicates the number of single cells analysed. (a) Frequency distributions of vRNA levels of segments 3–8. The illustrations comprise pooled data of multiple independent experiments (n=2 for segment 3, 4 and 7; n=5 for segment 5; n=1 for segment 6; n=3 for segment 7). The solid lines describe log-normal distributions fitted to the data. The P value from Shapiro–Wilk normality test is indicated. (b) Intersegment dependencies of vRNAs. The illustrations comprise pooled data of multiple independent experiments (n=2 for segment 3 and 5; n=2 for segment 5 and 8; n=3 for segments 5 and 7). The coefficient of determination (R2) is provided.
Figure 4
Figure 4. Origin of noise in virus replication.
Simulation results for an infection at an MOI of 10 are shown. (a) vRNA level of segments 3 and 5 in individual infected cells at 12 h.p.i. Black Xs and numbers correspond to the example cells shown in b. Colours from blue to red indicate higher density. Histograms of the data in the x and y direction are provided. (b) Early dynamics of segment 3 and 5 vRNA for the two cells indicated in a (1: upper panel; 2: lower panel). (c) Noise in vRNA levels over the course of an infection. The noise was calculated by dividing the s.d. of log10 vRNA levels by their mean (see equation (26) for details). (d) Number of viral polymerases and NP proteins in individual infected cells at 12 h.p.i. Colours indicate density. Histograms of the data are provided.
Figure 5
Figure 5. Effect of vRNA level on virus titre.
(a) Experimental results of the dependency of virus yield on vRNA level. Cells were infected at an MOI of 10 and simultaneously assayed for their virus titres (by the plaque assay) and vRNA levels of segments 5 and 8 (by RT–qPCR) at 12 h.p.i. High-yielding cells (upper 10% of cells with respect to progeny virus release) are indicated in blue and all remaining cells are coloured in red. The illustration includes pooled data of multiple independent experiments (n=4). nS indicates the number of single-cell measurements. (b) Simulated levels of segment 5 and 8 vRNAs in relation to the virus yield. High-yielding cells (upper 10%) are coloured in blue and all remaining cells are shown in red. Black lines indicate the influence of intrinsic noise on virus production. (c) RNA levels of two example cells from the simulation in b that showed high levels of segments 5 and 8 but were of the low-productive phenotype.
Figure 6
Figure 6. Increase in noise at low MOI.
Simulation results at 12 h.p.i. for infections at different MOIs are shown. (a) Average number of progeny virions per infected cell after a single round of infection. (b) Histogram of the number of progeny virions at an MOI of 1 (upper panel) and 10 (lower panel), respectively. Only productive cells are shown. (c) Fraction of non-productive cells at an MOI of 1 and 10. (d) Probability that an infected cell does not release infectious virus progeny until 12 h.p.i. for different MOIs. The probabilities that virus fusion fails and that at least one viral genome segment is absent are indicated. (e) Early vRNA dynamics in two exemplary non-productive cells (upper and lower panel, respectively) that were infected at an MOI of 1 and in which virus fusion was successful.
Figure 7
Figure 7. Loss of genome segments in simulations.
(a) Probability that the indicated segment is absent at 12 h.p.i. in a cell that was infected by one virus particle, which successfully underwent virus fusion. (b) Number of NA against HA proteins at 12 h.p.i. for an infection at an MOI of 1. Colours from blue to red indicate higher density. Histograms of the data in the x and y direction are provided.

References

    1. Raj A. & van Oudenaarden A. Nature, nurture, or chance: stochastic gene expression and its consequences. Cell 135, 216–226 (2008). - PMC - PubMed
    1. Delbruck M. The burst size distribution in the growth of bacterial viruses (bacteriophages). J. Bacteriol. 50, 131–135 (1945). - PubMed
    1. Zhu Y., Yongky A. & Yin J. Growth of an RNA virus in single cells reveals a broad fitness distribution. Virology 385, 39–46 (2009). - PMC - PubMed
    1. Timm A. & Yin J. Kinetics of virus production from single cells. Virology 424, 11–17 (2012). - PMC - PubMed
    1. Elowitz M. B., Levine A. J., Siggia E. D. & Swain P. S. Stochastic gene expression in a single cell. Science 297, 1183–1186 (2002). - PubMed