. 2015 Nov 24;13(8):1610-22.
doi: 10.1016/j.celrep.2015.10.030. Epub 2015 Nov 12.

Chromatin Dynamics and the RNA Exosome Function in Concert to Regulate Transcriptional Homeostasis

Affiliations

Chromatin Dynamics and the RNA Exosome Function in Concert to Regulate Transcriptional Homeostasis

Mayuri Rege et al. Cell Rep. .

Abstract

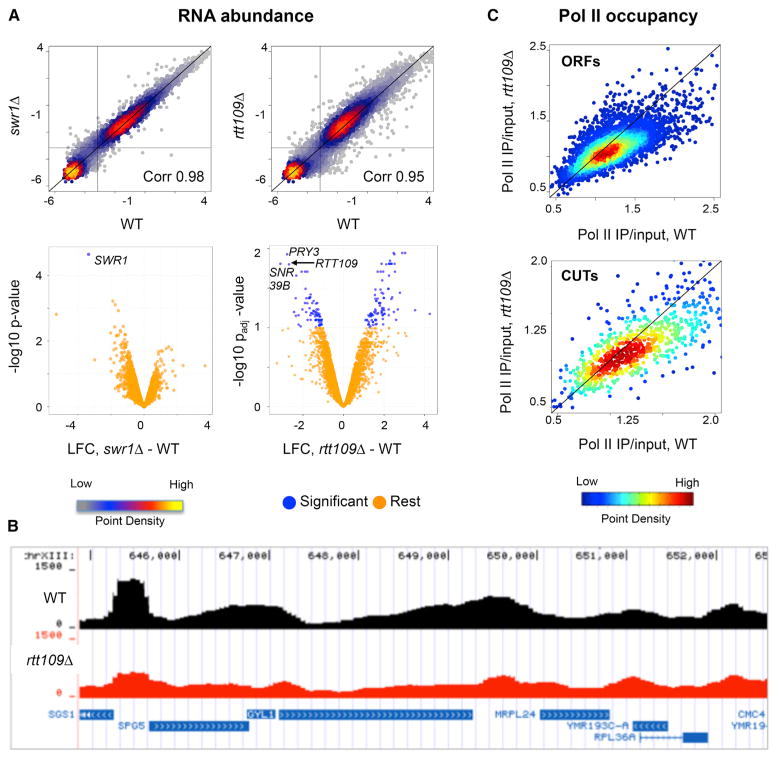
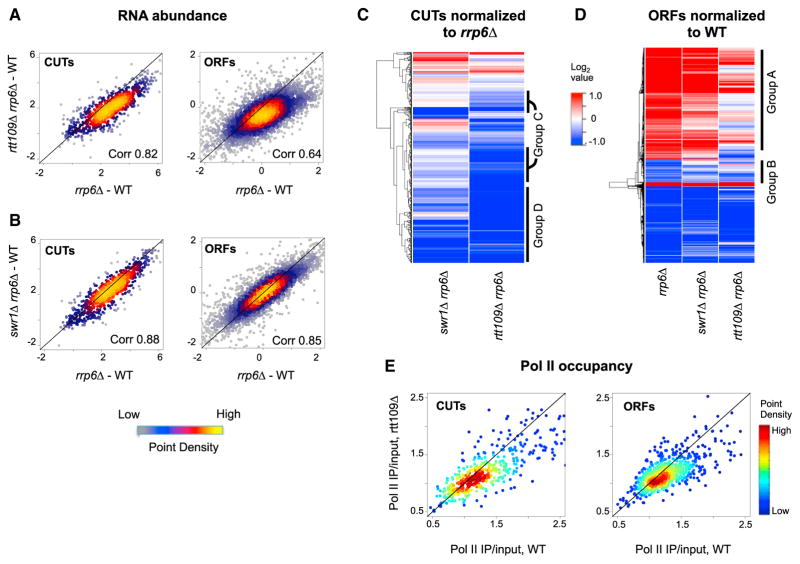
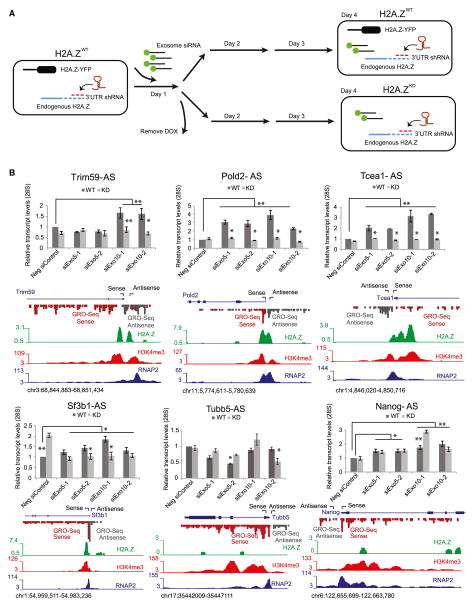
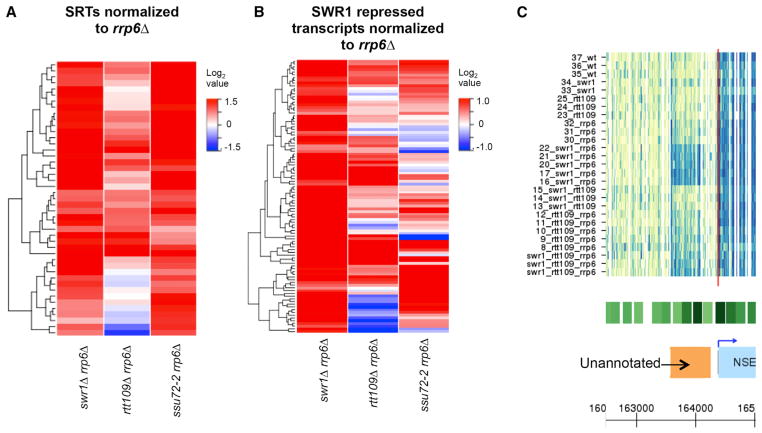
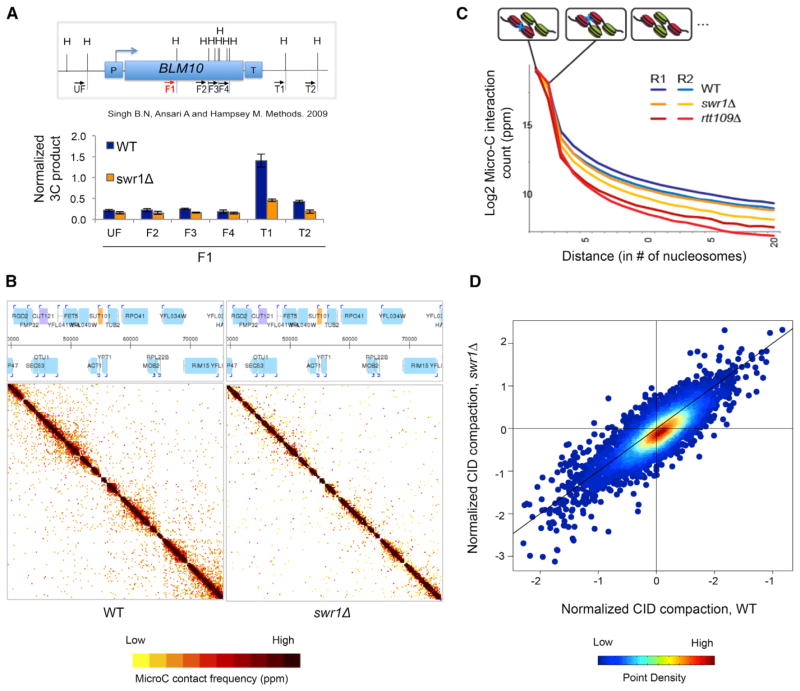
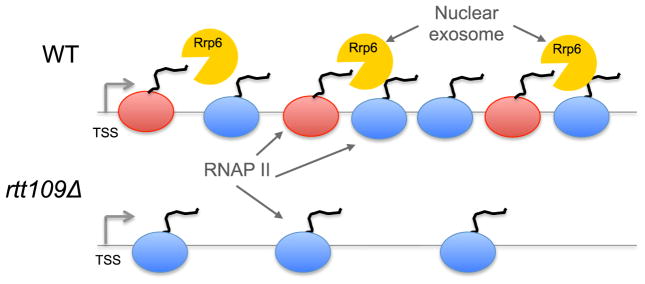
The histone variant H2A.Z is a hallmark of nucleosomes flanking promoters of protein-coding genes and is often found in nucleosomes that carry lysine 56-acetylated histone H3 (H3-K56Ac), a mark that promotes replication-independent nucleosome turnover. Here, we find that H3-K56Ac promotes RNA polymerase II occupancy at many protein-coding and noncoding loci, yet neither H3-K56Ac nor H2A.Z has a significant impact on steady-state mRNA levels in yeast. Instead, broad effects of H3-K56Ac or H2A.Z on RNA levels are revealed only in the absence of the nuclear RNA exosome. H2A.Z is also necessary for the expression of divergent, promoter-proximal noncoding RNAs (ncRNAs) in mouse embryonic stem cells. Finally, we show that H2A.Z functions with H3-K56Ac to facilitate formation of chromosome interaction domains (CIDs). Our study suggests that H2A.Z and H3-K56Ac work in concert with the RNA exosome to control mRNA and ncRNA expression, perhaps in part by regulating higher-order chromatin structures.


Figures

Figure 1
Figure 1. H3-K56Ac Regulates Pol II Recruitment, although RNA Levels Are Less Affected
(A) RNA abundance measured by strand-specific tiling microarrays in swr1Δ and rtt109Δ strains. Density scatterplots (top panels) show median signal intensity values in comparison to wild-type (WT) arrays. The black diagonal line indicates x = y (no change) and the horizontal and vertical lines indicate the noise threshold cut-off. Volcano plots (bottom panels) show the transcripts that change significantly in the mutant compared to WT highlighted in blue (padj = FDR < 0.1 and log2 fold change > 0.59). The y axis shows the p value (without FDR correction) for swr1Δ and padj value (after FDR correction) for rtt109Δ. See also Table S1. (B) Representative genome browser view of Pol II ChIP-seq data for the wild-type (black) and rtt109Δ (red), normalized to the respective total library read count. (C) Density scatterplots of Pol II IP/input values in the rtt109Δ compared to WT at 5171 ORFs (top) and 925 CUTs (bottom). The black line indicates x = y (no change).
Figure 2
Figure 2. H3-K56Ac and H2A.Z Positively Regulate Transcription in the Absence of the Nuclear Exosome
(A and B) RNA abundance measured by strand-specific tiling microarrays in the rtt109Δ rrp6Δ, swr1Δ rrp6Δ, and rrp6Δ mutants normalized to WT. Density scatterplots show log2 median intensity values for rtt109Δ rrp6Δ (top) and swr1Δ rrp6Δ (bottom) plotted against the corresponding value for CUT (left) or ORF (right) transcripts from the rrp6Δ strain. The black line indicates x = y (no change). See also Table S1. (C) Heatmap of normalized RNA abundance for CUTs (n = 728) in rtt109Δ rrp6Δ and swr1Δ rrp6Δ compared to rrp6Δ. H3K56Ac-dependent CUTs (group C) as well as H2A.Z- and H3K56Ac-dependent CUTs (group D) are highlighted after hierarchical clustering (Euclidean distance and the complete linkage agglomeration method). CUTs in group C are defined as (1) significantly upregulated in the rrp6Δ compared to WT and (2) reduced by > −0.59 LFC in rtt109Δ rrp6Δ compared to the rrp6Δ. Group D CUTs are defined as (1) significantly upregulated in the rrp6Δ compared to WT and (2) reduced by > −0.59 LFC in rtt109Δ rrp6Δ as well as swr1Δ rrp6Δ compared to the rrp6Δ. See also Table S4. (D) Heatmap of normalized RNA abundance for ORFs (n = 1,836) in rrp6Δ, swr1Δ rrp6Δ, and rtt109Δ rrp6Δ compared to WT. Group A and group B ORFs are highlighted after hierarchical clustering (Euclidean distance and the median linkage agglomeration method). Group A ORFs are defined as (1) significantly up-regulated in the rrp6Δ compared to WT and (2) reduced by > 0.59 LFC in rtt109Δ rrp6Δ compared to the rrp6Δ. Group B ORFs are defined as (1) significantly downregulated in rrp6Δ compared to WT and (2) increased by > 0.59 LFC in rtt109Δ rrp6Δ compared to rrp6Δ. See also Table S4. This group includes ORFs subject to transcriptional interference by adjacent CUTs. (E) Density scatterplots of Pol II IP/input values in the rtt109Δ compared to wild-type at group C+D CUTs (left) and group A ORFs (right).
Figure 3
Figure 3. H2A.Z Regulates Divergent ncRNA Expression in Mouse ESCs
(A) Schematic representing the transgenic mouse ESC system used to investigate H2A.Z function in regulation of antisense transcription. (B) qRT-PCR representing the relative levels of TSS-associated antisense transcripts (AS) in H2A.ZWT (dark gray) and H2A.ZKD (light gray) mESCs. Transcript levels were normalized to 28S rRNA levels and measured relative to transcript levels in cells treated with non-specific siRNA (Neg siControl). siExo5-1 and 2 and siExo10-1 and 2 refer to two independent siRNAs targeting either exosome component, respectively. Error bars represent standard deviations from a triplicate set of experiments. Trim59S, Pold2, Tcea1, and Sf3b1 are targets of H2A.Z that display bimodal distribution (+1 and −1 nucleosomes) at the TSS. Tubb5 and Nanog are not targets of H2A.Z and serve as controls. Global run-on sequencing (GRO-seq) read density plots (both sense and antisense) from Core et al. (2008), H2A.ZWT (Subramanian et. al., 2013), H3K4me3, and RNAPII (Wamstad et al., 2012) gene tracks of the indicated gene promoter region are depicted below each gene.
Figure 4
Figure 4. H2A.Z Inhibits Two Classes of Transcripts Associated with NFR Regions
(A) Heatmap of normalized RNA abundance for SRTs in the swr1Δ rrp6Δ, rtt109Δ rrp6Δ, and ssu72-2 rrp6Δ strains compared to rrp6Δ and clustered as in Figure 2D. Only SRTs that significantly upregulated in swr1Δ rrp6Δ compared to rrp6Δ (n = 45) were used for the analysis. See also Table S4. (B) Heatmap of normalized RNA abundance levels for SWR1 repressed transcripts observed in this study for the swr1Δ rrp6Δ, rtt109Δ rrp6Δ and ssu72-2 rrp6Δ arrays compared to their respective rrp6Δ and clustered as in Figure 2D. Transcripts that significantly upregulated in swr1Δ rrp6Δ compared to rrp6Δ (n = 100) were used for the analysis. See also Tables S3 and S4. (C) Tiling array heatmap with array replicates as rows illustrate an example of genomic transcription of a previously unannotated transcript observed in swr1Δ rrp6Δ adjacent to a gene promoter. The green boxes shown above the gene browser view represent nucleosome positions, with dark green marking well-positioned nucleosomes. For the complete genome, see http://steinmetzlab.embl.de/cgi-bin/viewPeterssonLabArray.pl?showSamples=data&type=heatmap&gene=CUT505 (bottom). See also Data S1B.
Figure 5
Figure 5. SWR-C Promotes Formation of Chromosome Interaction Domains
(A) Chromosome conformation capture (3C) analysis of the BLM10 locus (top: schematic) in wild-type (WT) and swr1Δ shows the frequency of interaction of each restriction fragment with the F1 fragment. Data are normalized to a control region on chromosome VI as the baseline contact probability. Error bars represent the mean of three biological replicates. See also Figure S6B. (B) Contact frequency matrix from Micro-C analyses for wild-type (left) and swr1Δ (right) for a region on chromosome VI with the gene annotations listed at the top. (C) Micro-C analyses show the log2 interaction count of one nucleosome with its successive neighboring nucleosomes in wild-type, swr1Δ, or rtt109Δ strains. (D) Density scatterplot for the compaction scores of chromosome interaction domains (CIDs) in the swr1Δ (y axis) compared to WT (x axis) (Kolmogorov-Smirnov test of the distributions yielded a p = 2.109e-15). The black line indicates x = y (no change).
Figure 6
Figure 6. Model for How the RNA Exosome and Nucleosome Dynamics May Regulate Steady-State RNA Levels
A model gene is shown in wild-type (WT) or rtt109Δ strains. In WT cells, a part of the population of elongating RNAPII molecules (red) are targeted by the RNA exosome (yellow) while the remainder RNAP II (blue) produce fully functional transcripts. In the absence of H3-K56Ac (rtt109Δ), RNAPII density is reduced, and the remaining RNAPII produces functional (blue) transcripts. Note that the RNA exosome may be present at both types of target genes, but its activity may only be apparent during cases of high RNAPII density.

References

    1. Airoldi EM, Huttenhower C, Gresham D, Lu C, Caudy AA, Dunham MJ, Broach JR, Botstein D, Troyanskaya OG. Predicting cellular growth from gene expression signatures. PLoS Comput Biol. 2009;5:e1000257. - PMC - PubMed
    1. Albert I, Mavrich TN, Tomsho LP, Qi J, Zanton SJ, Schuster SC, Pugh BF. Translational and rotational settings of H2A.Z nucleosomes across the Saccharomyces cerevisiae genome. Nature. 2007;446:572–576. - PubMed
    1. Alcid EA, Tsukiyama T. ATP-dependent chromatin remodeling shapes the long noncoding RNA landscape. Genes Dev. 2014;28:2348–2360. - PMC - PubMed
    1. Amberg DC, Burke DJ, Strathern JN. Methods in Yeast Genetics: A Cold Spring Harbor Laboratory Course Manual, 2005 Edition. Cold Spring Harbor Laboratory Press; 2005.
    1. Arigo JT, Eyler DE, Carroll KL, Corden JL. Termination of cryptic unstable transcripts is directed by yeast RNA-binding proteins Nrd1 and Nab3. Mol Cell. 2006;23:841–851. - PubMed

Publication types

Associated data