. 2016 May;23(5):853-64.
doi: 10.1038/cdd.2015.149. Epub 2015 Nov 20.

Autophagy is dispensable for B-cell development but essential for humoral autoimmune responses

Affiliations

Autophagy is dispensable for B-cell development but essential for humoral autoimmune responses

J Arnold et al. Cell Death Differ. 2016 May.

Abstract

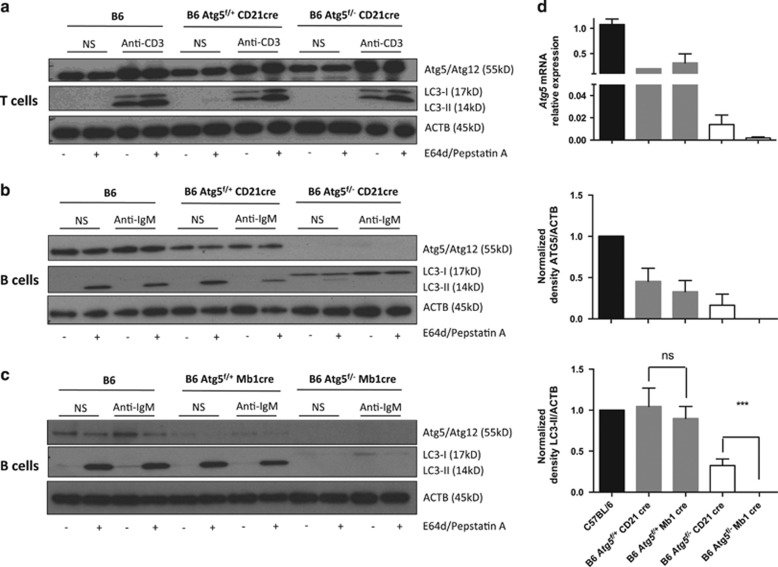
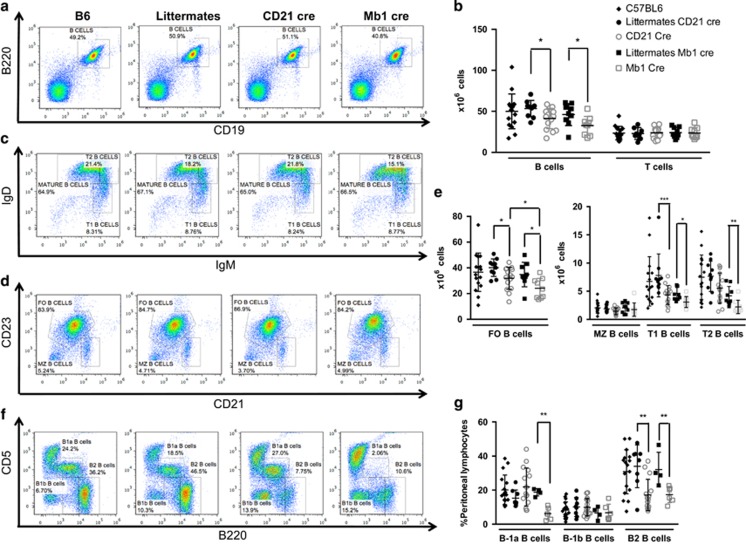
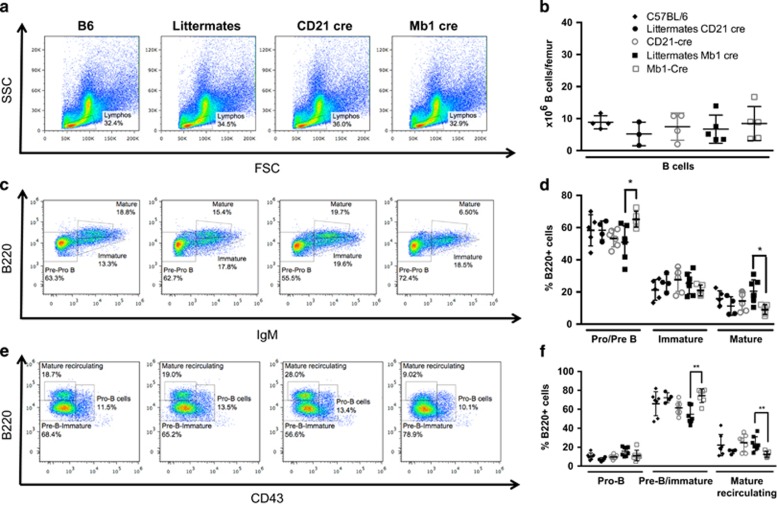
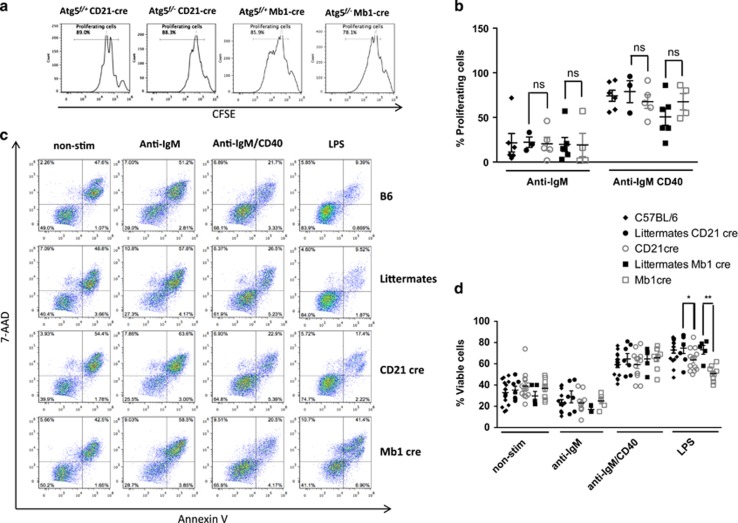
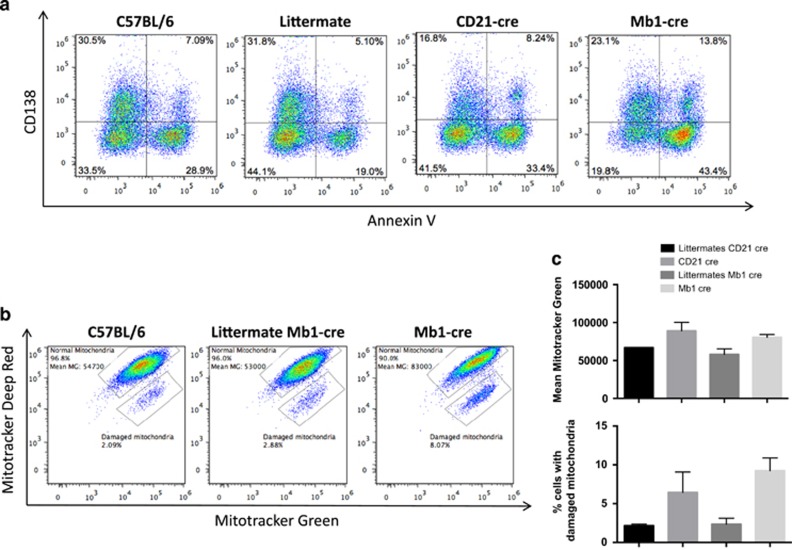
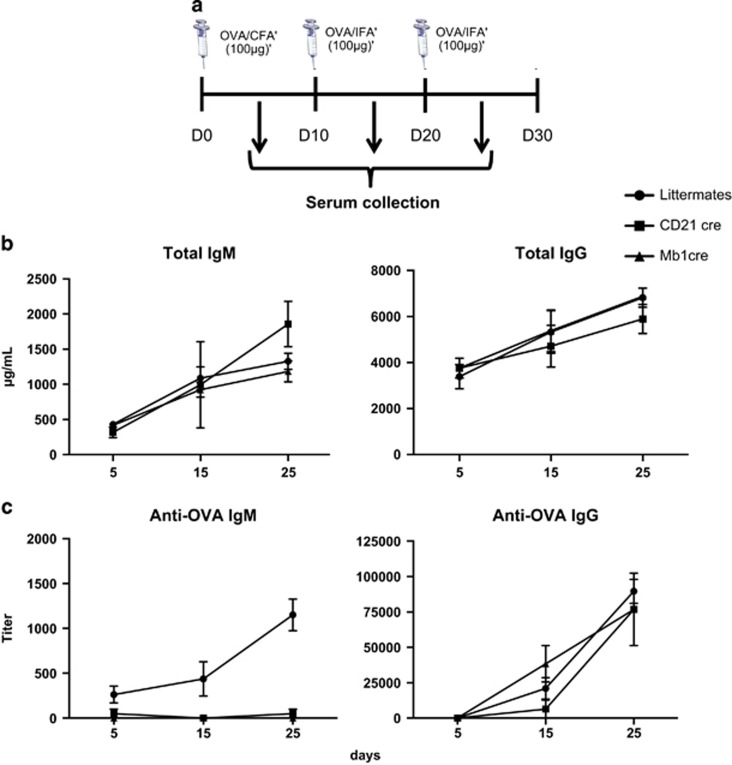
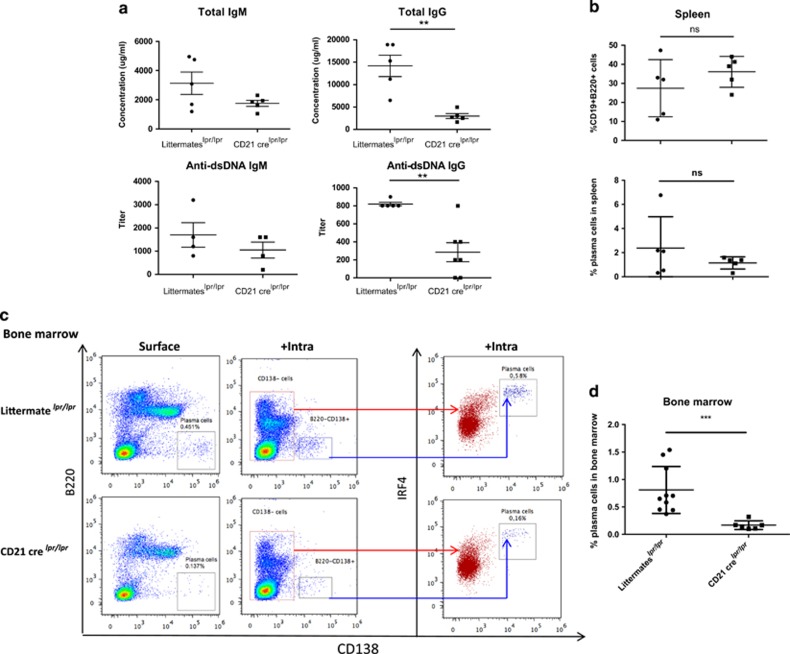
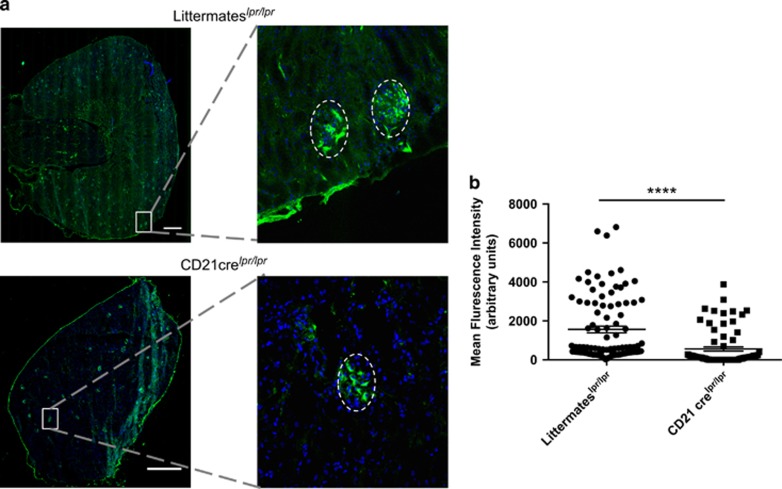
To gain new insight into the role of B-cell autophagy, we generated two novel mouse models deficient for the autophagy-related gene (Atg)5, one from the outset pro-B cell stage (Atg5(f/-) Mb1 cre) and the other in mature B cells only (Atg5(f/-) CD21 cre). We show that autophagy is dispensable for pro- to pre-B cell transition, but necessary at a basal level to maintain normal numbers of peripheral B cells. It appears non-essential for B-cell activation under B-cell receptor stimulation but required for their survival after lipopolysaccharide stimulation that drives plasmablast differentiation and for specific IgM production after immunization. Results obtained using Atg5(f/-) CD21 cre × C57BL/6(lpr/lpr) autoimmune-prone mice show that B-cell autophagy is involved in the maintenance of anti-nuclear antibody secretion, elevated number of long-lived plasma cells, and sustains IgG deposits in the kidneys. Thus, treatments specifically targeting autophagy might be beneficial in systemic autoimmune diseases.


Figures

Figure 1
Figure 1
Efficient invalidation of autophagy in B cells from Atg5f/− CD21 cre mice and Atg5f/− Mb1 cre mice. Atg5f/+ CD21 cre, Atg5f/− CD21 cre, Atg5f/− Mb1 cre, and Atg5f/+ Mb1 cre were generated. B or T cells were purified from the spleen and cultured in vitro in the presence of different stimuli. Lysosomal protease inhibitors pepstatin A and E64d were added (+) or not (−) in the indicated conditions. (a) T cells from wild-type C57BL/6 mice (B6), Atg5f/+ CD21 cre, or Atg5f/− CD21 cre were left unstimulated (non-stim) or stimulated by anti-CD3 Ab for 18 h. Cells were lysed and immunoblots were performed against ATG5, LC3, and ACTB. (b and c) B cells from wild-type B6, Atg5f/+ CD21 cre or Atg5f/− CD21 cre (b), Atg5f/− Mb1 cre or Atg5f/+ Mb1 cre (c) were left unstimulated (non-stim) or stimulated by anti-IgM Ab for 18 h. Cells were lysed and immunoblots were performed against ATG5, LC3, and ACTB. (d) Upper panel. Quantification of Atg5 transcripts in B cells by real-time PCR relative to Gapdh expression. One sample from B6 mouse was used for each plate for normalization and its value is arbitrarily set to 1. Middle and lower panels. Densitometric analysis of ATG5 and LC3-II expressions relative to ACTB. The values corresponding to the non-stimulated condition in the presence of protease inhibitors were collected, and normalized to the ratios obtained from B6 wild-type mice on each blot to normalize results. The histograms represent the means with S.E.M. obtained for at least three and seven different blots, respectively, for ATG5 and LC3-II quantification. ns, non-significant; ***P<0.001 (Mann–Whitney U-test)
Figure 2
Figure 2
Basal levels of autophagy are necessary for B-cell survival in the periphery. Spleen cells from wild-type C57BL/6 mice (B6), Atg5f/+ CD21cre (littermates CD21 cre) or Atg5f/+ Mb1cre (littermates Mb1 cre), Atg5f/− CD21 cre (CD21 cre) or Atg5f/− CD21 cre (Mb1 cre) were stained with anti-B220 and anti-CD19 Abs. (a and b) Representative dot plots obtained after flow-cytometry analysis are depicted in (a) showing the percentages of B220+CD19+ B cells. (b) Individual values for each mouse tested of absolute numbers of B and T cells, in the spleen obtained from B6 mice n=16, littermate CD21 cre mice n=10, littermate Mb1 cre mice n=9, CD21 cre mice n=15, and Mb1 cre mice n=9. Means and standard deviations (S.D.) are indicated. (ce) Expression was assessed for the spleen of the same animals for the expression of (c) IgD, IgM and (d) CD21 and CD23. Representative dot plots after flow-cytometry analysis show the percentages among B220+ cells of mature B cells (IgMlowIgDhi), transitional 1 and 2 (T1 and T2, respectively, IgMhiIgDlo and IgMhiIgDhi), follicular (FO) B cells (CD21+CD23hi), and marginal zone (MZ) B cells (CD21hiCD23lo). (e) Individual values for each mouse tested of absolute numbers different B-cell populations, in the spleen obtained from B6 mice n=16, littermate CD21 cre mice n=10, littermate Mb1 cre mice n=9, CD21 cre mice n=15, and Mb1 cre mice n=9. Means and S.D. are indicated. (f and g) Peritoneal lavage was also performed on some animals and the cells obtained were stained by anti-CD5 and anti-B220 Abs. Representative histogram obtained after analysis of cells from the peritoneal lavage by flow cytometry, with the different populations indicated: B-2 B cells (B220hiCD5), B-1a B cells (CD5+B220lo), and B-1b B cells (CD5B220lo). (g) Individual values for each mouse tested of percentages of different B-cell populations, in spleens obtained from B6 mice n=17, littermate CD21 cre mice n=8, littermate Mb1 cre mice n=4, CD21 cre mice n=15, and Mb1 cre mice n=6. *P<0.05, **P<0.01, ***P<0.001 (Mann–Whitney U-test). Hi, high; lo, low
Figure 3
Figure 3
Autophagy is dispensable for B-cell development. Bone marrow cells from one femur of each wild-type C57BL/6 mice (B6), Atg5f/+ CD21 cre (littermates CD21 cre) or Atg5f/+ Mb1 cre (littermates Mb1 cre), Atg5f/− CD21 cre (CD21 cre) or Atg5f/− Mb1 cre (Mb1 cre) were stained with anti-IgM, anti-B220, and anti-CD43 Abs and analysed by flow cytometry. (a) Representative dot plots of FSC and SSC profiles of bone marrow cells. (b) Individual values for each mouse tested of absolute B220+ cell numbers, in the bone marrow obtained from B6 mice n=4, littermate CD21 cre mice n=3, littermate Mb1 cre mice n=5, CD21 cre mice n=5, and Mb1 cre mice n=5. Means and standard deviations (S.D.) are indicated. (c) Representative dot plots for the expression of B220 and surface IgM, allowing definition of pre-/pro-B cells (IgMB220lo), immature B cells (IgM+B220lo), and mature B cells (IgM+B220hi). (d) Individual values for each mouse tested of percentages of different B-cell precursors populations depicted in (c), in bone marrows obtained from B6 mice n=5, littermate CD21 cre mice n=4, littermate Mb1 cre mice n=7, CD21 cre mice n=4, and Mb1 cre mice n=5. Means and S.D. are indicated. (e) Representative dot plots obtained by flow-cytometry analysis, showing the percentages among B220+ cells of pre-B/immature B cells (CD43B220lo), pro-B cells (B220+CD43+), and mature recirculating B cells (B220hiCD43). (f) Individual values for each mouse tested of percentages of different B-cell precursors populations depicted in (e), in bone marrows obtained from B6 mice n=7, littermate CD21 cre mice n=4, littermate Mb1 cre mice n=7, CD21 cre mice n=7, and Mb1 cre mice n=8. Means and S.D. are indicated. *P<0.05, **P<0.01 significant after Mann–Whitney U-test
Figure 4
Figure 4
Autophagy is dispensable for B-cell proliferation and survival upon BCR stimulation. Purified splenic B cells from wild-type C57BL/6 mice (B6), Atg5f/+ CD21cre (littermates CD21 cre) or Atg5f/+ Mb1cre (littermates Mb1 cre), Atg5f/− CD21 cre (CD21 cre), or Atg5f/− Mb1 cre (Mb1 cre) were cultured without any stimulation (non-stim) or with 5 μg/ml anti-IgM in combination or not with 5 μg/ml anti-CD40 Abs or with LPS (5 μg/ml). (a) Cells from the indicated mice were stained with CFSE before culture, and proliferation was assessed by measuring the dilution of the fluorescent signal by flow cytometry after 3 days of culture. Percentages of proliferating cells are indicated in the histograms, for one representative anti-IgM/CD40 stimulation experiment, for each CD21 cre and Mb1 cre mice with their controls. (b) Mean and standard deviation (S.D.) values of the percentages of proliferating cells obtained in four independent experiments. (c) Alternatively, cells were stimulated as described and cell death was assessed by double annexin-V/7-AAD staining allowing to distinguish viable cells (annexin-V7-AAD) early apoptotic cells (annexin-V+7-AAD) and late apoptotic/necrotic cells (annexin-V+7-AAD+). (d) The mean and S.D. values of viable cell proportions obtained in six independent experiments are indicated. ns, non-significant; *P<0.05, **P<0.01 (Mann–Whitney U-test)
Figure 5
Figure 5
Differentiation of B cells into plasma cells in the absence of ATG5. (a) C57BL/6, Atg5f/+ CD21 cre (littermate CD21 cre), Atg5f/− CD21 cre (CD21 cre), Atg5/+ Mb1 cre (littermate Mb1 cre) and Atg5f/− Mb1 cre (Mb1 cre) were stimulated by 5 μg LPS for 48 h. Cells were stained by Annexin-V and anti-CD138 antibody, and analysed by flow cytometry. The percentages indicate the proportion of cells among total events after debris exclusion based on FSC/SSC profile, in the corresponding quadrants. (b and c) The same cells were stained with mitotracker green and deep red. (b) Representative dot plots obtained after analysis of the indicated samples, after gating on live cells based on FSC/SSC profile, showing the repartition of cells that display proportional staining for both markers indicative of normal mitochondrial membrane potential (normal mitochondria). The fluorescence mean of mitotracker green in this population is indicated. The proportion of cells with specific decrease in mitotracker deep red, indicative of a disturbed mitochondrial membrane potential is also indicated (damaged mitochondria). (c) Histograms showing the means of fluorescence in the population 'normal mitochondria' and the means of cell percentage of 'damaged mitochondria' population. The results are obtained on n=2 mice for each genotype, the bars stand for S.D.
Figure 6
Figure 6
Functional autophagy is important in vivo for short-term humoral response. (a) Schematic representation of the immunization protocol used. C57BL/6 mice (B6), Atg5f/+ CD21 cre or Atg5f/+ Mb1cre (littermates), Atg5f/− CD21 cre (CD21 cre) or Atg5f/− Mb1 cre (Mb1 cre) mice were injected i.p. with OVA in the presence of FA at days 0, 10, and 20. Blood was collected at days 5, 15, and 25. (b) Absolute concentrations (+S.E.M. values) of total IgM and IgG in the serum of immunized animals (littermate mice n=3, CD21 cre n=2, and Mb1 cre mice n=2). (c) Measurement of anti-OVA IgM and IgG Ab titres (+S.E.M. values) in the serum from the immunized animals (littermate mice n=3; CD21 cre mice n=2; Mb1 cre mice n=2)
Figure 7
Figure 7
Autophagy is necessary for survival of long-lived plasma cells during autoimmune responses. Mice harbouring the lpr mutation on the C57BL/6 background were crossed with Atg5f/− CD21 cre mice (CD21 crelpr/lpr). They were compared with littermate Atg5f/+ CD21 cre mice, also crossed with lpr mice (littermateslpr/lpr), at the age of 9 months. (a) Individual values for each mouse assayed for absolute IgG and IgM concentrations in the serum, determined by ELISA and titres of anti-dsDNA IgM and IgG Abs. Means and SEM are represented (at least four mice in each group). (b) The spleens of the animals were collected, cells were stained by anti-CD19, anti-CD138, and anti-B220 Abs, and analysed by flow cytometry. Each point represents the value for an individual mouse. The central bar represents the means and the upper and lower bars symbolize the S.D. (c) Staining of bone marrow cells collected from one femur per mouse. Each dot plot stands for one representative case for each genotype. On the left, the gate delimiting B220CD138+ cells should indicate the percentages of plasma cells resident in the bone marrow (surface). In the middle, results obtained after an intracellular staining of IRF4 molecule performed after surface staining of the previous markers (+intra). The red population corresponding to CD138 cells is IRF4low or IRF4int. The CD138+ blue population corresponding to plasma cells is IRF4hi. This latter staining was performed on four littermatelpr/lpr mice and one CD21 crelpr/lpr mouse. (d) Percentage of plasma cells among the bone marrow cells for individual mice analysed as in (c). n=10 for littermateslpr/lpr and n=6 for CD21 crelpr/lpr. Mean and S.D. are indicated. **P<0.01, ***P<0.001 (Mann–Whitney U-test)
Figure 8
Figure 8
Invalidation of autophagy in B cells reduces IgG deposits in the kidney of lupus-prone mice. Mice bearing the lpr mutation on the C57BL/6 background were crossed with Atg5f/− CD21 cre mice (CD21 crelpr/lpr) and their kidneys were collected at the age of 9 months. Atg5f/+ CD21 cre littermate mice harbouring the lpr mutation were used for comparison (littermateslpr/lpr). Organ sections stained with anti-mouse IgG Abs before analysis on a spinning disk confocal microscope. (a) The total section was scanned and a representative image for each genotype is shown on the left. The white bars represent 500 μm. A magnification is indicated on the right to exemplify a glomerulus positive for IgG deposition, delimited by the dotted line. (b) The intensity of IgG staining was determined for each glomerulus as indicated in Materials and methods. Individual values of littermateslpr/lpr n=5 and CD21 cre lpr/lpr n=4 (n=20 glomeruli per animal) for each genotype were pooled and plotted on the graph. The bars represent the mean of glomerular IgG staining intensity for each genotype. ****P<0.001 (Mann–Whitney U-test)

References

    1. Deretic V, Saitoh T, Akira S. Autophagy in infection, inflammation and immunity. Nat Rev Immunol 2013; 13: 722–737. - PMC - PubMed
    1. Romao S, Gannage M, Munz C. Checking the garbage bin for problems in the house, or how autophagy assists in antigen presentation to the immune system. Semin Cancer Biol 2013; 23: 391–396. - PubMed
    1. He MX, McLeod IX, Jia W, He YW. Macroautophagy in T lymphocyte development and function. Front Immunol 2012; 3: 22. - PMC - PubMed
    1. Paul S, Kashyap AK, Jia W, He YW, Schaefer BC. Selective autophagy of the adaptor protein Bcl10 modulates T cell receptor activation of NF-kappaB. Immunity 2012; 36: 947–958. - PMC - PubMed
    1. Kovacs JR, Li C, Yang Q, Li G, Garcia IG, Ju S et al. Autophagy promotes T-cell survival through degradation of proteins of the cell death machinery. Cell Death Differ 2012; 19: 144–152. - PMC - PubMed

Publication types

LinkOut - more resources