. 2015 Nov 20;350(6263):928-32.
doi: 10.1126/science.aad0843.

Stable recombination hotspots in birds

Affiliations

Stable recombination hotspots in birds

Sonal Singhal et al. Science. .

Abstract

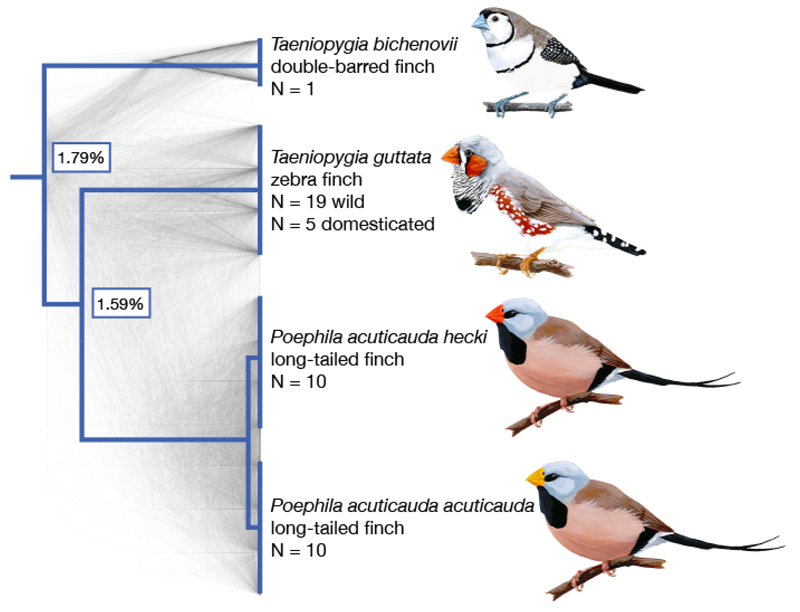
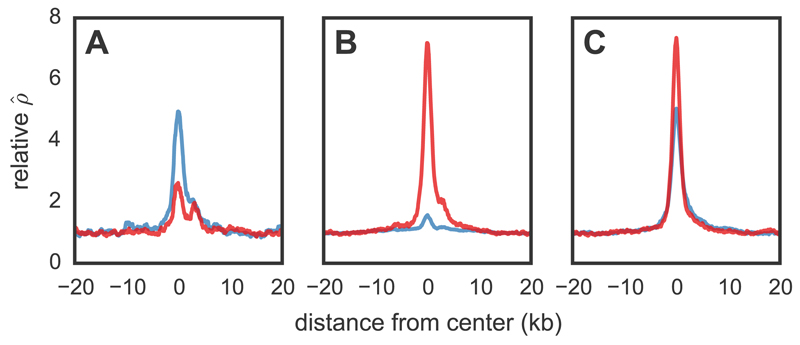
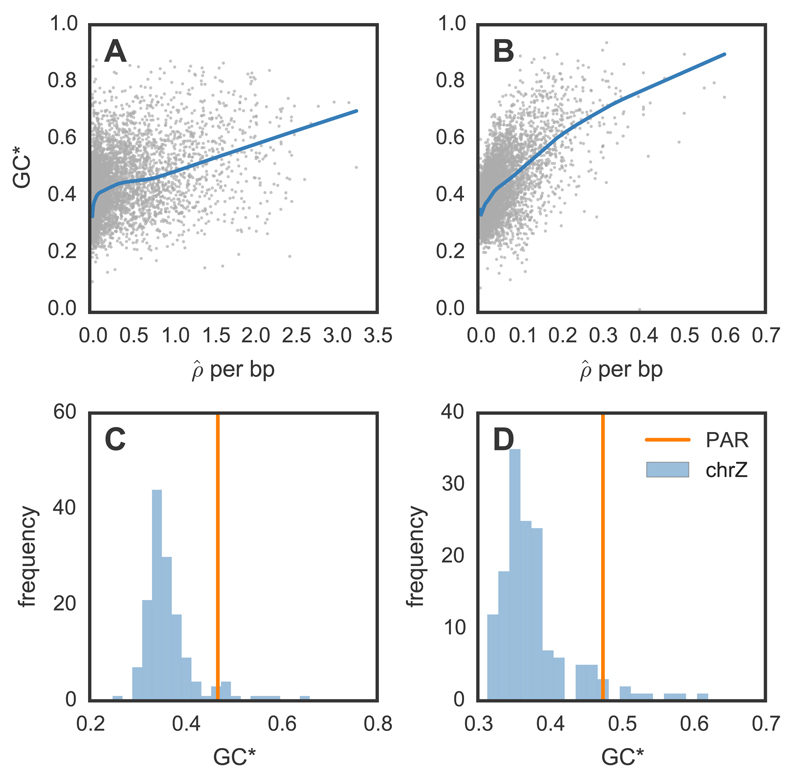
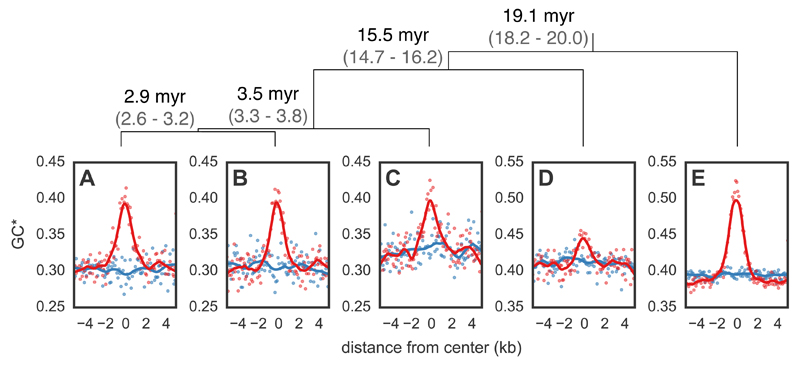
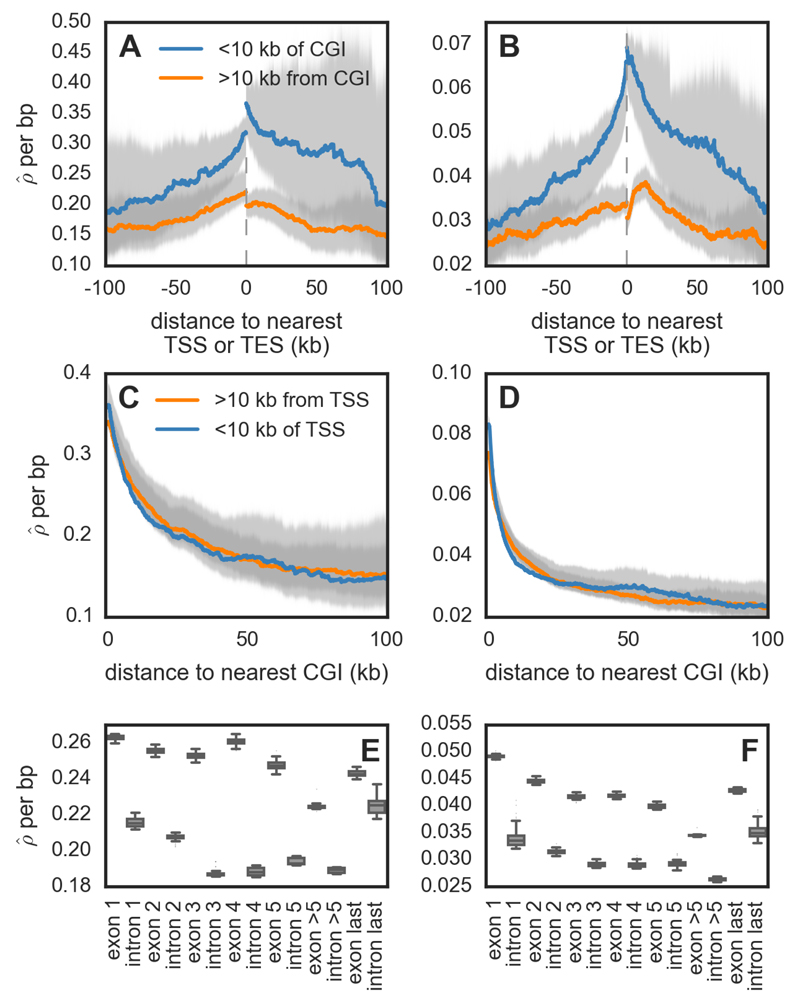
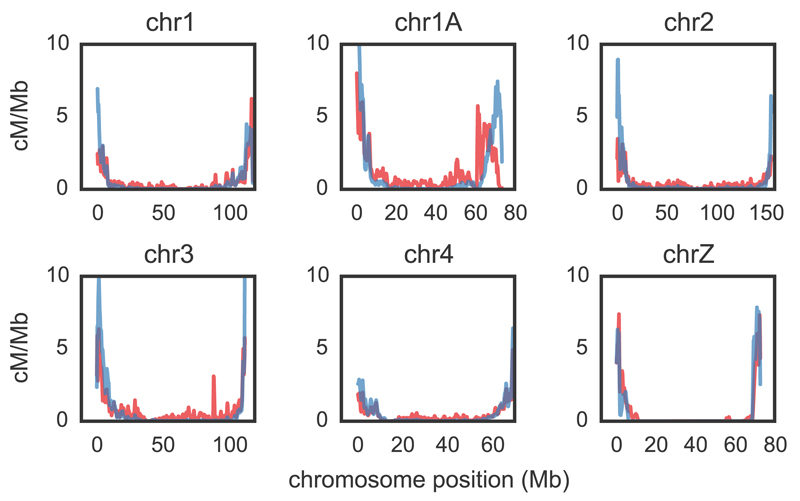
The DNA-binding protein PRDM9 has a critical role in specifying meiotic recombination hotspots in mice and apes, but it appears to be absent from other vertebrate species, including birds. To study the evolution and determinants of recombination in species lacking the gene that encodes PRDM9, we inferred fine-scale genetic maps from population resequencing data for two bird species: the zebra finch, Taeniopygia guttata, and the long-tailed finch, Poephila acuticauda. We found that both species have recombination hotspots, which are enriched near functional genomic elements. Unlike in mice and apes, most hotspots are shared between the two species, and their conservation seems to extend over tens of millions of years. These observations suggest that in the absence of PRDM9, recombination targets functional features that both enable access to the genome and constrain its evolution.


Figures

Figure 1
Figure 1
Species tree for the finch species in this study. Species sampled were double-barred finch (Taeniopygia bichenovii), zebra finch (T. guttata), and the two long-tailed finch subspecies (Poephila acuticauda hecki and P. a. acuticauda). Tree rooted with medium ground finch and collared flycatcher (Geospiza fortis and Ficedula albicollis; full phylogeny shown in Fig. 4). Shown in gray are 1000 gene trees, which were used to infer the species tree (18). The pairwise divergence between species is indicated at nodes, as measured by the genome-wide average across autosomes. Images of birds from Wikimedia Commons.
Figure 2
Figure 2
Recombination rates across hotspots in zebra finch and long-tailed finch. Average relative recombination rate (p^/bp divided by the background p^ of 20 kb on either side of the hotspot) across (A) hotspots detected only in zebra finch (n=1075; shown in blue), (B) those detected only in long-tailed finch (middle; n=2059; shown in red), and (C) those inferred as shared in the two species (right; n=2874). Shared hotspots are those whose midpoints occur within 3 kb of each other. The orientation of hotspots is with respect to the genomic sequence.
Figure 3
Figure 3
Equilibrium GC content and broad-scale recombination rates in zebra finch (A, C) and long-tailed finch (B, D). (A-B) Relationship between equilibrium GC content [GC*; 18]) and p^/bp for zebra finch and long-tailed finch across all autosomal chromosomes. Both GC* and p^ were calculated across 50 kb windows with LOESS curves shown for span of 0.2. (C-D) GC* and the pseudoautosomal region (PAR). The histogram shows GC* for chromosome Z across 500 kb windows; GC* for the 450 kb PAR shown by the vertical line.
Figure 4
Figure 4
Expected equilibrium GC content (GC*) around hotspots and matched coldspots for five bird species. Points (hotspots shown in red and coldspots in blue) represent GC* estimated from the lineage-specific substitutions aggregated in 100 bp bins from the center of all hotspots in (A) zebra finch and (B) long-tailed finch. GC* for (C) double-barred finch, (D) medium ground finch, and (E) collared flycatcher was calculated around hotspots identified as shared between zebra finch and long-tailed finch. LOESS curves are shown for a span of 0.2. The orientation of hotspots is with respect to the genomic sequence. Species tree (18) shown with estimated divergence times in millions of years (myr) and its 95% Highest Posterior Density in gray; top.
Figure 5
Figure 5
Recombination rates across genomic features for zebra finch (A, C, E) and long-tailed finch (B, D, F). (A-B) Estimated recombination rates (p^/bp) around annotated transcription start sites (TSSs) and end sites (TESs), conditional on whether they are within 10 kb of a CpG island (CGI) or not. The gray dotted line represents the location of the gene, and the distances are shown accounting for the 5' → 3' orientation of genes. (C-D) p^ shown as a function of distance to nearest CGI, conditional on whether the CGI is within 10 kb of an annotated TSS or not. See Fig. S17 for the pattern of CGIs relative to TESs. For figures A – D, uncertainty in rate estimates (shown in gray) was estimated by drawing 100 bootstrap samples and recalculating means. (E-F) p^ within exons and introns for genes that have ≥5 exons (n=7,131). See Fig. S28 for simulation results that suggest the inference of higher background p^ in exons does not reflect differences in diversity levels between exons and introns.
Figure 6
Figure 6
Comparative recombination rates for zebra finch and long-tailed finch. Zebra finch rates shown in red; long-tailed finch in blue. Estimated rates [cM/Mb; obtained from p^/bp (18)] are shown as rolling means calculated across 100 kb windows. We show here the five largest autosomal chromosomes and chromosome Z; see Fig. S20 for all chromosomes. Rate estimates for chromosome Z should be taken with caution for both biological and technical reasons (see for more information).

Comment in

References

    1. de Massy B. Annual review of genetics. 2013;47:563. - PubMed
    1. Myers S, et al. Science. 2010;327:876. - PMC - PubMed
    1. Berg IL, et al. Nature genetics. 2010;42:859. - PMC - PubMed
    1. Baudat F, et al. Science. 2010;327:836. - PMC - PubMed
    1. Williams AL, et al. eLife. 2015;4:e04637. - PubMed

Publication types

Substances