. 2015 Nov 20;10(11):e0142972.
doi: 10.1371/journal.pone.0142972. eCollection 2015.

Dendritic Cell-Specific Deletion of β-Catenin Results in Fewer Regulatory T-Cells without Exacerbating Autoimmune Collagen-Induced Arthritis

Affiliations

Dendritic Cell-Specific Deletion of β-Catenin Results in Fewer Regulatory T-Cells without Exacerbating Autoimmune Collagen-Induced Arthritis

C Henrique Alves et al. PLoS One. .

Abstract

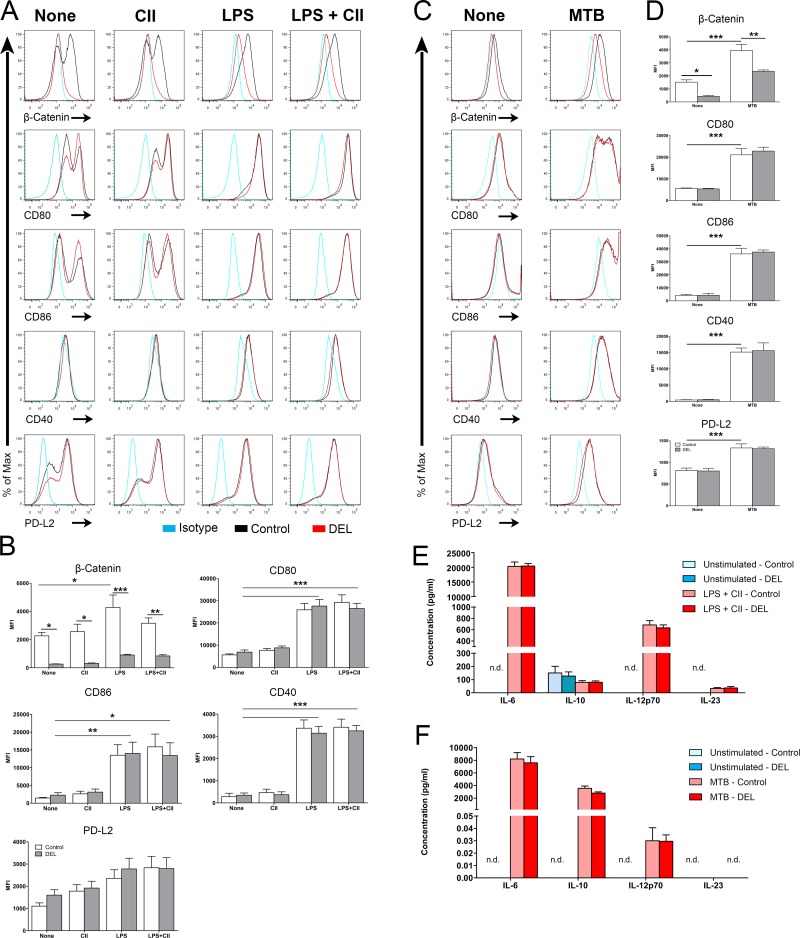
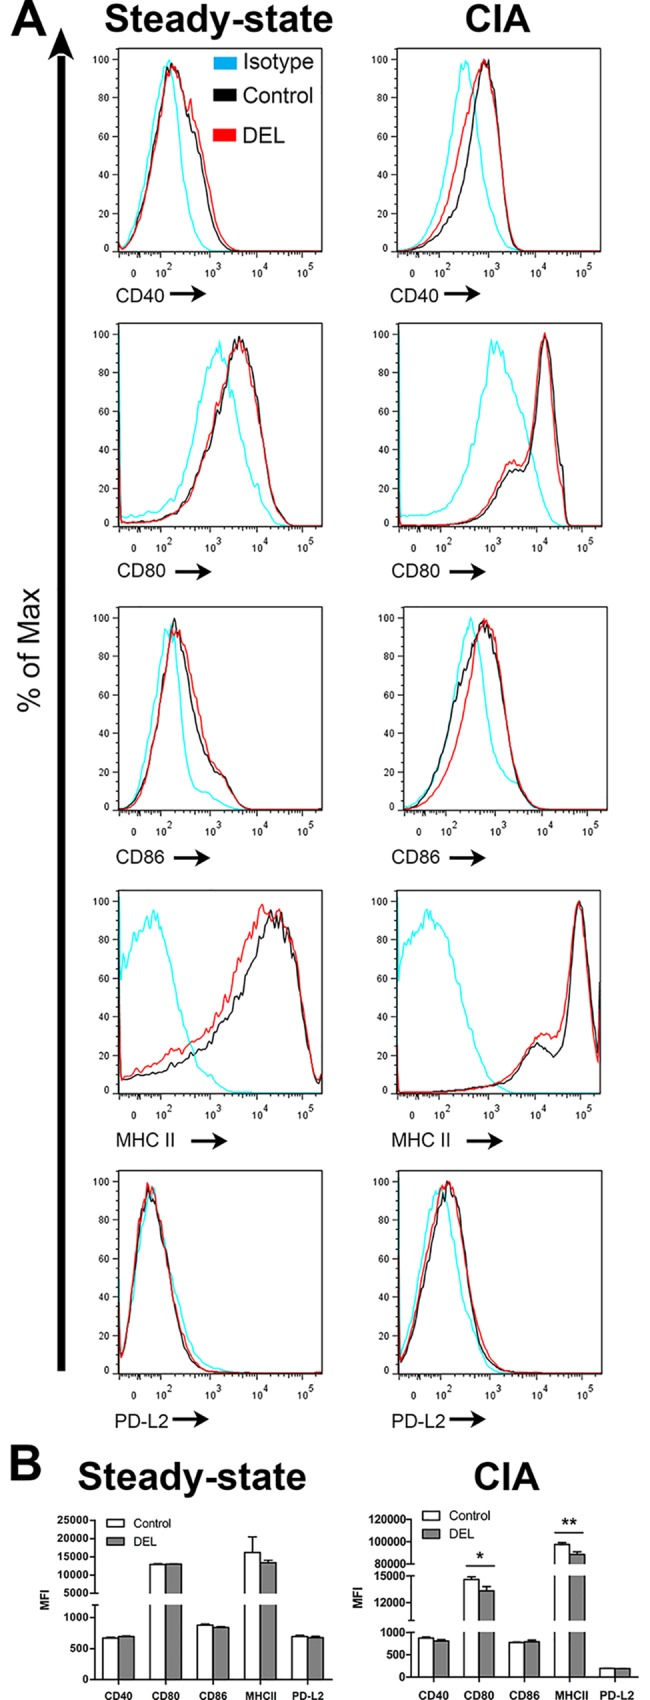
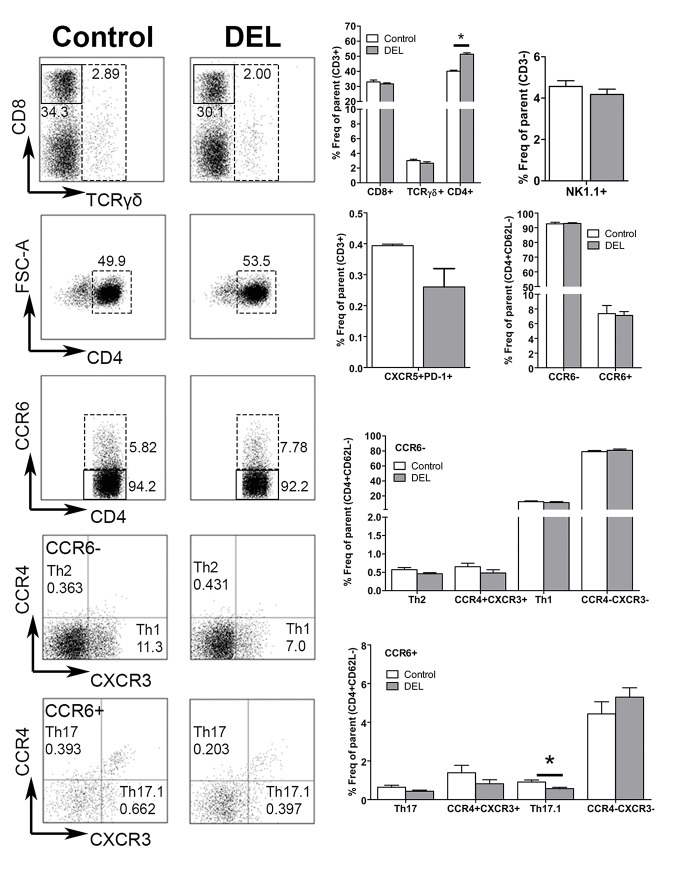
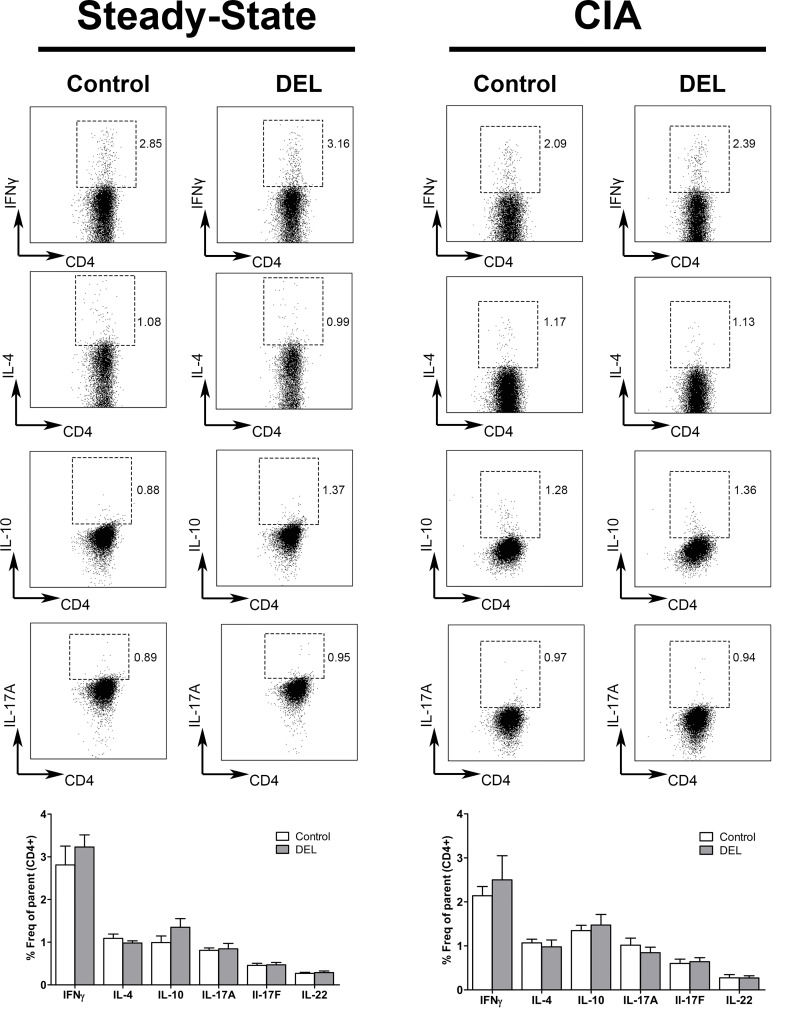
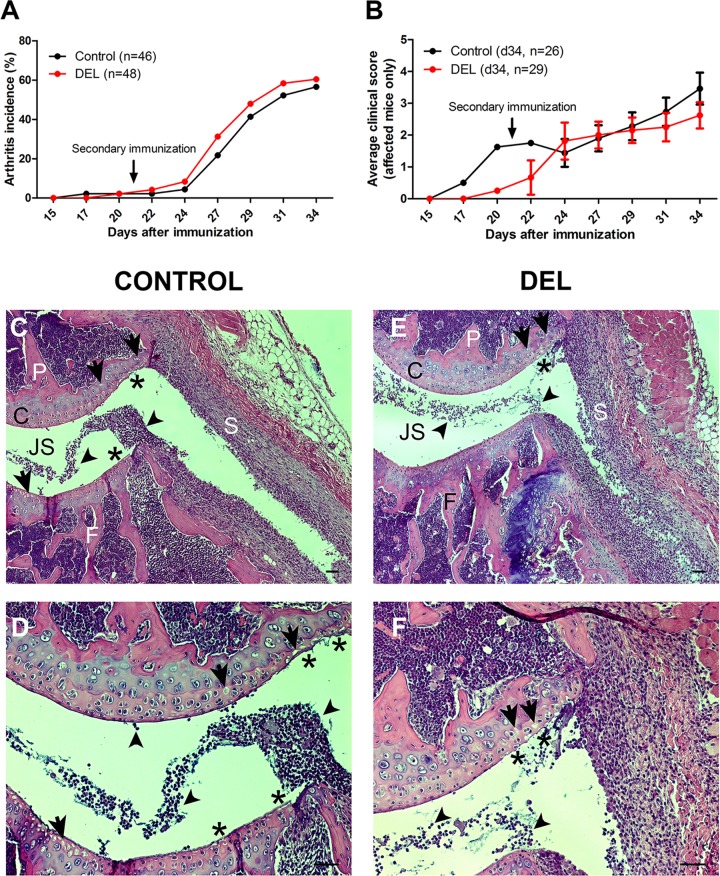
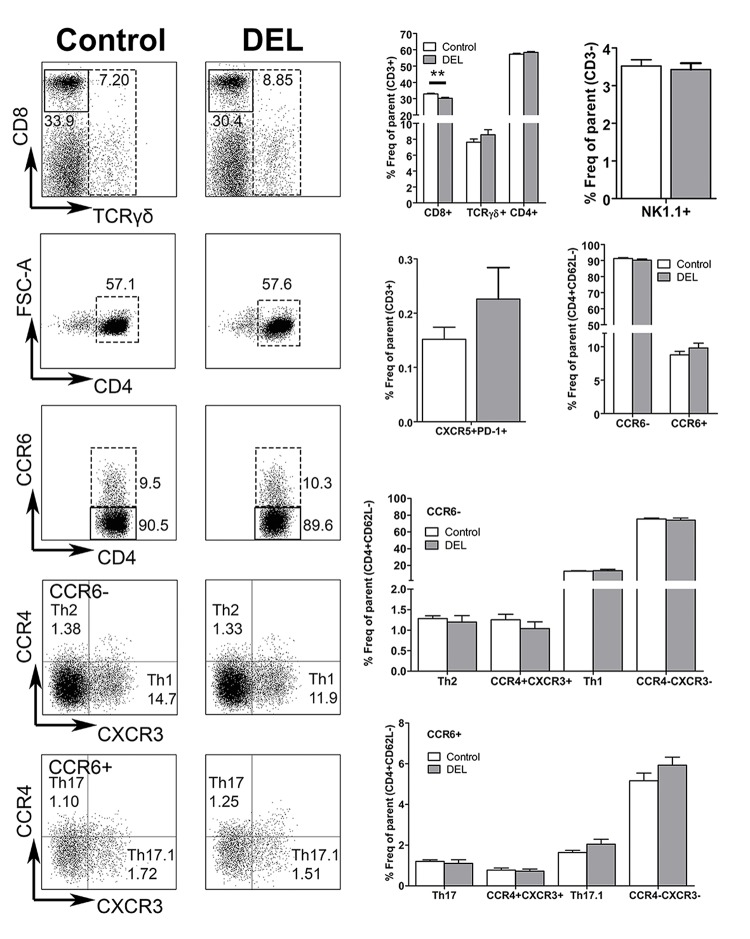
Dendritic cells (DCs) are professional antigen presenting cells that have the dual ability to stimulate immunity and maintain tolerance. However, the signalling pathways mediating tolerogenic DC function in vivo remain largely unknown. The β-catenin pathway has been suggested to promote a regulatory DC phenotype. The aim of this study was to unravel the role of β-catenin signalling to control DC function in the autoimmune collagen-induced arthritis model (CIA). Deletion of β-catenin specifically in DCs was achieved by crossing conditional knockout mice with a CD11c-Cre transgenic mouse line. Bone marrow-derived DCs (BMDCs) were generated and used to study the maturation profile of these cells in response to a TLR2 or TLR4 ligand stimulation. CIA was induced by intra-dermal immunization with 100 μg chicken type II collagen in complete Freund's adjuvant on days 0 and 21. CIA incidence and severity was monitored macroscopically and by histology. The T cell profile as well as their cytokine production were analysed by flow cytometry. Lack of β-catenin specifically in DCs did not affect the spontaneous, TLR2- or TLR4-induced maturation and activation of BMDCs or their cytokine production. Moreover, no effect on the incidence and severity of CIA was observed in mice lacking β-catenin in CD11c+ cells. A decreased frequency of splenic CD3+CD8+ T cells and of regulatory T cells (Tregs) (CD4+CD25highFoxP3+), but no changes in the frequency of splenic Th17 (CCR6+CXCR3-CCR4+), Th2 (CCR6-CXCR3-CCR4+) and Th1 (CCR6-CXCR3+CCR4-) cells were observed in these mice under CIA condition. Furthermore, the expression of IL-17A, IL-17F, IL-22, IL-4 or IFNγ was also not affected. Our data indicate that ablation of β-catenin expression in DCs did not alter the course and severity of CIA. We conclude that although deletion of β-catenin resulted in a lower frequency of Tregs, this decrease was not sufficient to aggravate the onset and severity of CIA.


Conflict of interest statement

Competing Interests: The authors have declared that no competing interests exist.

Figures

Fig 1
Fig 1. Ablation of β-catenin did not influence the maturation and activation of BMDCs.
BMDCs were cultured in the presence of GM-CSF for 10 days, and either left unstimulated (spontaneous maturation), treated with LPS (1 ng/ml), or (chicken) CII (50 μg/ml) or LPS and CII (50 μg/ml; 1 ng/ml respectively) (A, B) or with Mycobacterium tuberculosis (MTB, 25 μg/ml) (C, D). Twenty-four hours after stimulation, BMDCs were collected and analysed by flow cytometry for their maturation status. The levels of β-catenin, co-stimulatory molecules (CD40, CD80, CD86), the co-inhibitory molecule PD-L2 were measured in CD11c+ BMDCs derived from control and β-catDEL mice. Levels of cytokines associated with tolerance (IL-10) and T cell skewing (IL-23, IL12p70 and IL-6) were determined by ELISA of the supernatants of control and β-catDEL BMDCs, left unstimulated or pulsed with CII and LPS (E) Or of the supernatants from BMDCs, left unstimulated or stimulated with MTB (F). All culture conditions were performed in triplicates. Data are representative of two to three independent experiments (n = 6–9 mice/group). Data on (B and D) were analysed by one-way ANOVA followed by a Bonferroni post-test and data on (E and F) was analysed by Mann-Whitney U test. Data are presented as mean ± SEM. *p< 0.05; **p<0.01; ***p<0.001. N.d. Not detectable.
Fig 2
Fig 2. Deletion of β-catenin in DCs during CIA resulted in a reduction of the co-stimulatory molecules CD80 and MHC-II in CIA.
Representative histogram of CD40, CD80, CD86, MHC-II and PD-L2 expression by CD11c+ DCs isolated from the spleen under steady-state condition (left column) and during CIA (right column) from control and β-catDEL mice (A). Spleen from CIA mice were collected at day 35 after initial immunization. Bar diagrams show the quantification of the MFI relative to the expression of costimulatory molecules (B). No differences in the expression of costimulatory molecules between naïve control and β-catDEL naïve mice were observed (CD40: p = 0.132; CD80: p = 0.289; CD86: p = 0.132; MHC-II: p = 0.575; PD-L2: p = 0.589; n = 6 mice per group). In the CIA group (n = 10 mice per group), differences in CD80 (p = 0.028) and MHC-II (p = 0.009) were found between control and β-catDEL mice. No differences were found in the expression of CD40 (p = 0.121), CD86 (p = 0.082) and PD-L2 (p = 0.325) in the CIA group. Data are presented as mean + SEM. Asterisks indicate a significant difference compared with the control (Mann-Whitney U test). *p< 0.05; **p<0.01.
Fig 3
Fig 3. Ablation of β-catenin in DCs resulted in elevated total CD4+ T-cell numbers under steady state condition.
The left panels depict representative FACS plots of CD8+, TCRγδ+, CD4+, CD4+CCR6- and CD4+CCR6+, Th17 or Th17.1 and Th2 or Th1 T cells isolated from the spleens of control and β-catDEL mice under steady state condition. The right panels illustrate the quantification of the percentages of CD8+, TCRγδ+, CD4+, Tfh (CXCR5+PD-1+), CD4+CCR6+ and CD4+CCR6- T cells, expressed in frequency of total T cells (CD3+); the frequency of NK T cells (NK1.1+) is expressed in percentage of CD3- cells. The percentages of Th cells were expressed in frequency of effector T-cells (CD3+CD4+CD62L-). N = 6 mice per group. Data are presented as mean + SEM. Asterisks indicate a significant difference compared with the control (Mann-Whitney U test). *p< 0.05.
Fig 4
Fig 4. Ablation of β-catenin in DCs downregulates Tregs during CIA but not under steady state condition.
Representative FACS plots of Tregs (CD4+CD62L-CD25highFoxP3+) isolated from splenocytes from control and β-catDEL mice in the steady state and subjected to CIA (35 days after the first immunization) (A). Bar diagrams depicting the frequency of Tregs, expressed as the percentage of effector T cells (CD4+CD62L-), in control and β-catDEL groups in the steady state (n = 6 mice per group, left) and in mice subjected to CIA (n = 10 mice per group, right) (B). While in the steady state no differences in the percentage of Tregs were found between the two groups (control = 13.41% ± 4.624 versus β-catDEL = 13.31% ± 2.188, p = 0.9372), in the CIA mice we observed a reduction of 20% in the β-catDEL compared to the control group (control = 12.93% ± 0.5691 versus β-catDEL = 10.21% ± 0.9003, p = 0.0435). Data are presented as mean + SEM. Asterisks indicate a significant difference compared with the control (Mann-Whitney U test). *p< 0.05.
Fig 5
Fig 5. β-catenin deletion in DCs did not affect the cytokine production by CD4+ T cells in the steady state or during CIA.
Representative FACS plots illustrating the pro-inflammatory cytokines IFNγ, IL-4, IL-17A and anti-inflammatory IL-10 produced by CD4+ T cells isolated from spleens of steady-state (left panel, n = 8 mice per group) and CIA (right panel, n = 10 mice per group) mice, on day 35 after the first immunization. Cells were stimulated for 4 hours with phorbolmyristate acetate (PMA) (0.05 μg/ml) and ionomycin (0.5 μg/ml) in the presence of GolgiStop. The frequencies of the different cytokine-secreting Th cells were similar in the β-catDEL and control groups in both conditions. Data are presented as mean ± SEM.
Fig 6
Fig 6. Deletion of β-catenin in DCs did not alter the onset and severity of autoimmune CIA.
Arthritis induction could be observed in mice as early as 17 days after immunization (A). There was no difference in the CIA incidence between the control (arthritis incidence = 56.5%, n = 46) and β-catDEL (arthritis incidence = 60.4%, n = 48) group (A). In addition, no difference in the disease severity was observed between the control (n = 26) and β-catDEL group (n = 29) (B). The disease severity reached a maximal average score of 3.5 ± 0.5 in the control and 2.6 ± 0.4 in the β-catDEL group on day 34 (p = 0.3765) (B). Representative histological images of the knees of CIA control (C and D) and β-catDEL (E and F) mice collected on day 35 after the first immunization. The tissue sections were stained with hematoxylin and eosin. Scale bar: 50 μm. JS = joint space; P = patella; S = synovial membrane; F = femur; C = cartilage.
Fig 7
Fig 7. Serum levels of CII-specific antibodies in CIA mice.
Enzyme-linked immunosorbent assay (ELISA) of chicken and mouse CII-specific IgG1, IgG2c, or total IgG in the serum of β-catDEL mice and control littermates at days 14 and 35 after initial immunization (n = 10 mice per group). Data are presented as mean + SEM.
Fig 8
Fig 8. DC-specific ablation of β-catenin modulated the percentage of CD4+ T cell subsets in CIA mice.
Left panels: Representative FACS plots depicting CD8+, TCRγδ+, CD4+, CD4+ CCR6- and CD4+ CCR6+, Th17 or Th17.1 and Th2 or Th1 T cells isolated from the spleens of CIA control and β-catDEL mice at day 35 after initial immunization. Right panels: Quantification of the percentages of CD8+, TCRγδ+, CD4+, Tfh(CXCR5+PD-1+) and CD4+CCR6+ and CD4+CCR6- T cells, expressed as frequency of total T cells (CD3+); NK T cells (NK1.1+) are plotted as percentage of CD3- cells. The percentages of Th cells were expressed as frequency of effector T cells (CD3+CD4+CD62L-). N = 10 mice per group. Data are presented as mean ± SEM. Asterisks indicate a significant difference compared with the control (Mann-Whitney U test). *p< 0.05; **p<0.01.
Fig 9
Fig 9. Differential expression of wnt ligands in the synovium and cortex.
Transcript levels measured by quantitative real time PCR in the synovial (A) and cortical (B) tissues of control and β-catDEL mice under steady state condition. Wnt2b, wnt5a, wnt5b and wnt9a were expressed in both tissues, while Wnt3, wnt7a, wnt8b were expressed in the cortical but not in synovial tissue. The expression of wnt5a (p = 0.0044), wnt5b (p = 0.0260), wnt7a (p = 0.0488) and wnt9a (p = 0.0411) was lower in cortices of β-catDEL compared to control mice. N = 6 mice per group. Data are presented as mean ± SEM. Asterisks indicate a significant difference compared with the control (Mann-Whitney U test). *p< 0.05; **p<0.01. N.d. Not detectable.

References

    1. Isaacs JD. The changing face of rheumatoid arthritis: sustained remission for all? Nat Rev Immunol. 2010;10(8):605–11. 10.1038/nri2804 - DOI - PubMed
    1. McInnes IB, Schett G. The pathogenesis of rheumatoid arthritis. N Engl J Med. 2011;365(23):2205–19. 10.1056/NEJMra1004965 - DOI - PubMed
    1. Takayanagi H. Osteoimmunology: shared mechanisms and crosstalk between the immune and bone systems. Nat Rev Immunol. 2007;7(4):292–304. - PubMed
    1. Steinman RM, Hawiger D, Liu K, Bonifaz L, Bonnyay D, Mahnke K, et al. Dendritic cell function in vivo during the steady state: a role in peripheral tolerance. Ann N Y Acad Sci. 2003;987:15–25. - PubMed
    1. Steinman RM, Hawiger D, Nussenzweig MC. Tolerogenic dendritic cells. Annu Rev Immunol. 2003;21:685–711. - PubMed

Publication types

MeSH terms

LinkOut - more resources