

EphA4 has distinct functionality from EphA7 in the corticothalamic system during mouse brain development
- PMID: 26587807
- PMCID: PMC4860152
- DOI: 10.1002/cne.23933
EphA4 has distinct functionality from EphA7 in the corticothalamic system during mouse brain development
Abstract
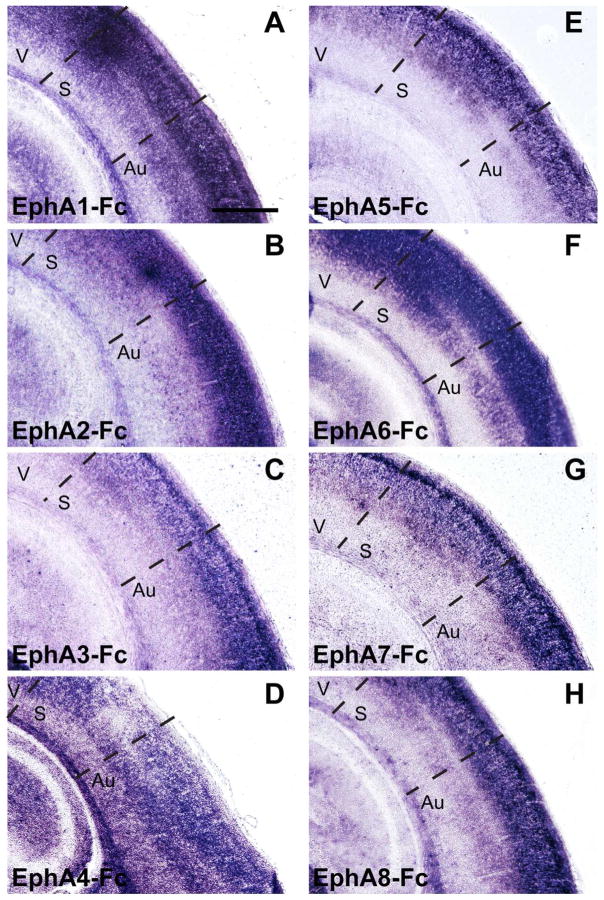
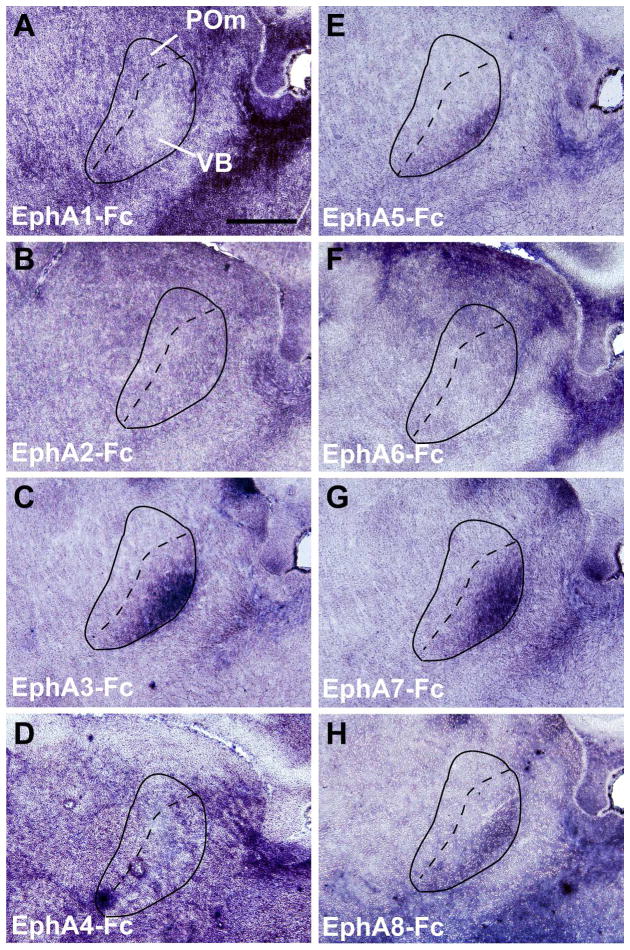
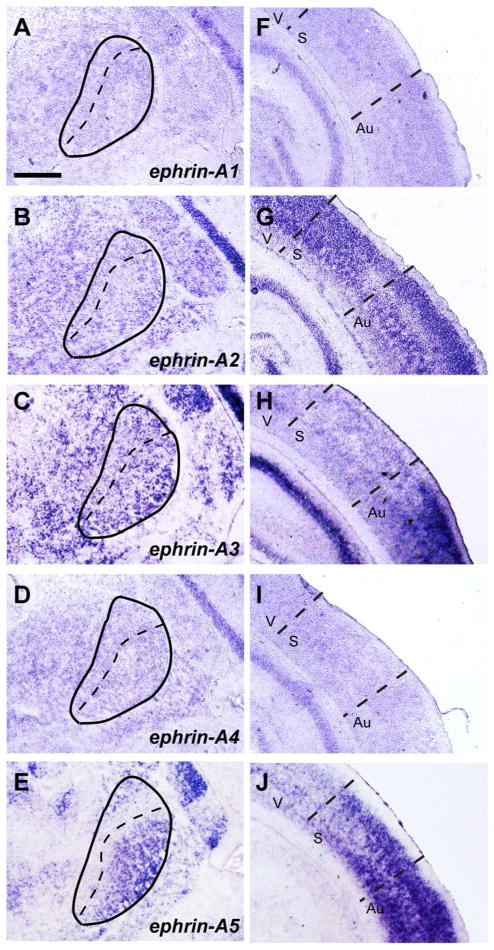
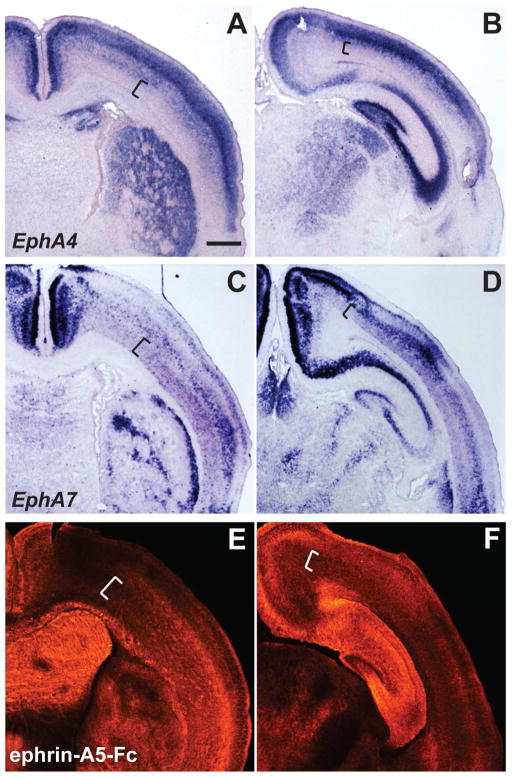
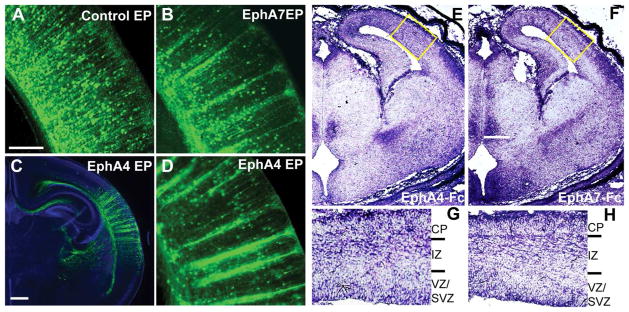
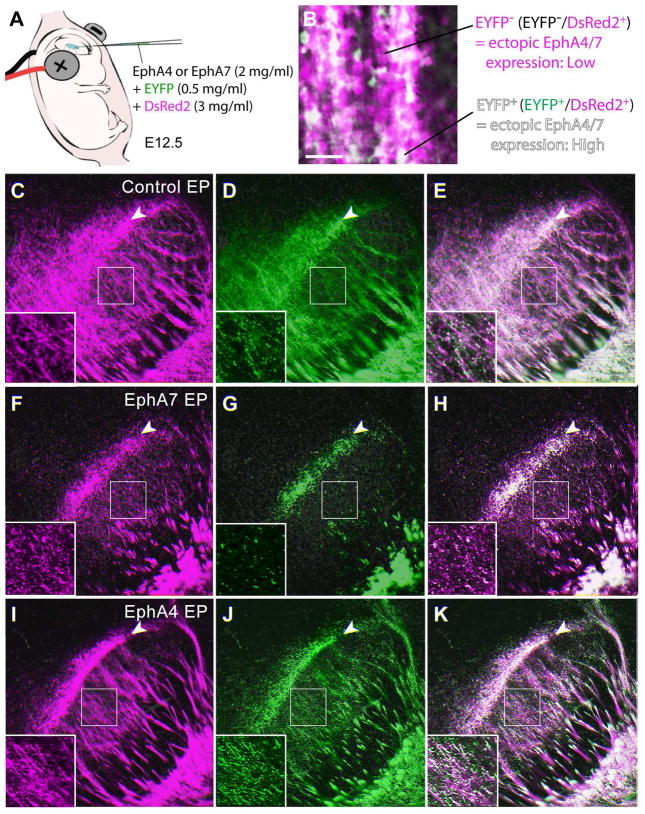
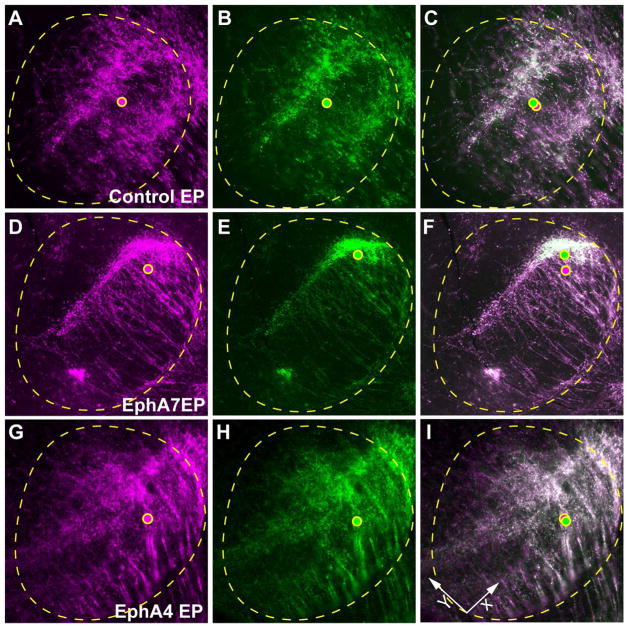
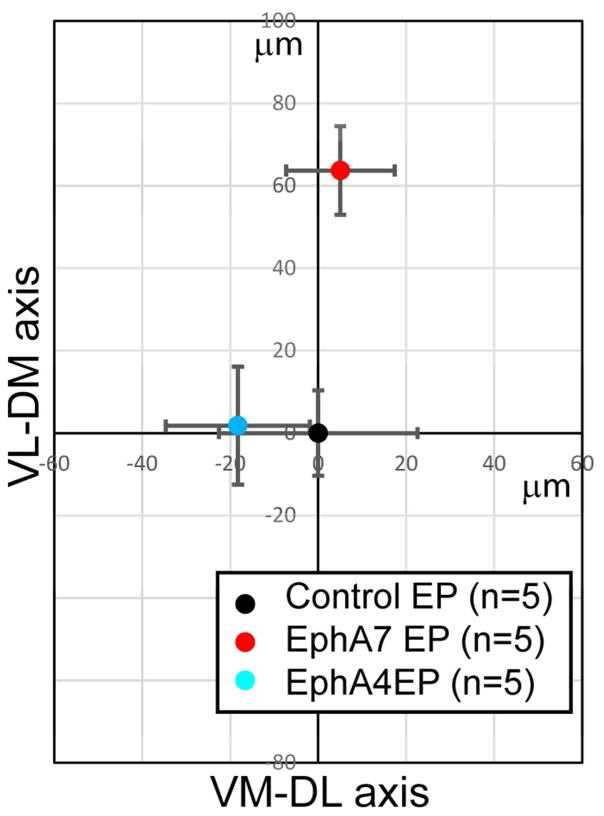
Deciphering the molecular basis for guiding specific aspects of neocortical development remains a challenge because of the complexity of histogenic events and the vast array of protein interactions mediating these events. The Eph family of receptor tyrosine kinases is implicated in a number of neurodevelopmental activities. Eph receptors have been known to be capable of responding to several ephrin ligands within their subgroups, often eliciting similar downstream effects. However, several recent studies have indicated specificity between receptor-ligand pairs within each subfamily, the functional relevance of which is not defined. Here we show that a receptor of the EphA subfamily, EphA4, has effects distinct from those of its close relative, EphA7, in the developing brain. Both EphA4 and EphA7 interact similarly with corresponding ligands expressed in the developing neocortex. However, only EphA7 shows strong interaction with ligands in the somatosensory thalamic nuclei; EphA4 affects only cortical neuronal migration, with no visible effects on the guidance of corticothalamic (CT) axons, whereas EphA7 affects both cortical neuronal migration and CT axon guidance. Our data provide new evidence that Eph receptors in the same subfamily are not simply interchangeable but are functionally specified through selective interactions with distinct ligands in vivo. J. Comp. Neurol. 524:2080-2092, 2016. © 2015 Wiley Periodicals, Inc.
Keywords: AB_10015282; AB_221569; AB_2313608; AB_514496; AB_777699; Eph receptor; cortex; corticothalamic projections; ephrin; nif-0000-30467; rid_000042; thalamus.
© 2015 Wiley Periodicals, Inc.
Conflict of interest statement
CONFLICT OF INTEREST
The authors declare no potential conflict of interest.
Figures
Similar articles
-
Effects of altered ephrin-A5 and EphA4/EphA7 expression on tumor growth in a medulloblastoma mouse model.J Hematol Oncol. 2015 Sep 7;8:105. doi: 10.1186/s13045-015-0202-9. J Hematol Oncol. 2015. PMID: 26345456 Free PMC article.
-
EphA family gene expression in the developing mouse neocortex: regional patterns reveal intrinsic programs and extrinsic influence.J Comp Neurol. 2003 Feb 10;456(3):203-16. doi: 10.1002/cne.10498. J Comp Neurol. 2003. PMID: 12528186
-
Role of EphA/ephrin--a signaling in the development of topographic maps in mouse corticothalamic projections.J Comp Neurol. 2013 Feb 15;521(3):626-37. doi: 10.1002/cne.23195. J Comp Neurol. 2013. PMID: 22821544 Free PMC article.
-
[Molecular mechanisms of thalamocortical circuit formation].Brain Nerve. 2008 Apr;60(4):415-23. Brain Nerve. 2008. PMID: 18421983 Review. Japanese.
-
Multiple roles of ephrins during the formation of thalamocortical projections: maps and more.J Neurobiol. 2004 Apr;59(1):82-94. doi: 10.1002/neu.10346. J Neurobiol. 2004. PMID: 15007829 Review.
Cited by
-
Overexpression of EphB6 and EphrinB2 controls soma spacing of cortical neurons in a mutual inhibitory way.Cell Death Dis. 2023 May 6;14(5):309. doi: 10.1038/s41419-023-05825-w. Cell Death Dis. 2023. PMID: 37149633 Free PMC article.
-
An Implantable Micro-Caged Device for Direct Local Delivery of Agents.Sci Rep. 2017 Dec 15;7(1):17624. doi: 10.1038/s41598-017-17912-y. Sci Rep. 2017. PMID: 29247175 Free PMC article.
-
Cortex-Specific Tmem169 Deficiency Induces Defects in Cortical Neuron Development and Autism-Like Behaviors in Mice.J Neurosci. 2025 Feb 26;45(9):e1072242024. doi: 10.1523/JNEUROSCI.1072-24.2024. J Neurosci. 2025. PMID: 39779369 Free PMC article.
-
EphA7 isoforms differentially regulate cortical dendrite development.PLoS One. 2020 Dec 4;15(12):e0231561. doi: 10.1371/journal.pone.0231561. eCollection 2020. PLoS One. 2020. PMID: 33275600 Free PMC article.
-
Integrative analysis of long noncoding RNAs dysregulation and synapse-associated ceRNA regulatory axes in autism.Transl Psychiatry. 2023 Dec 6;13(1):375. doi: 10.1038/s41398-023-02662-5. Transl Psychiatry. 2023. PMID: 38057311 Free PMC article.
References
-
- Bergemann AD, Zhang L, Chiang MK, Brambilla R, Klein R, Flanagan JG. Ephrin-B3, a ligand for the receptor EphB3, expressed at the midline of the developing neural tube. Oncogene. 1998;16(4):471–480. - PubMed
-
- Blits-Huizinga CT, Nelersa CM, Malhotra A, Liebl DJ. Ephrins and their receptors: binding versus biology. IUBMB life. 2004;56(5):257–265. - PubMed
-
- Bolz J, Uziel D, Muhlfriedel S, Gullmar A, Peuckert C, Zarbalis K, Wurst W, Torii M, Levitt P. Multiple roles of ephrins during the formation of thalamocortical projections: maps and more. Journal of neurobiology. 2004;59(1):82–94. - PubMed
-
- Brown A, Yates PA, Burrola P, Ortuno D, Vaidya A, Jessell TM, Pfaff SL, O’Leary DD, Lemke G. Topographic mapping from the retina to the midbrain is controlled by relative but not absolute levels of EphA receptor signaling. Cell. 2000;102(1):77–88. - PubMed
Publication types
MeSH terms
Substances
Grants and funding
LinkOut - more resources
Full Text Sources
Other Literature Sources
Miscellaneous
