. 2016 Jan 7;16(1):153-62.
doi: 10.1039/c5lc00820d. Epub 2015 Nov 20.

3D cardiac μtissues within a microfluidic device with real-time contractile stress readout

Affiliations

3D cardiac μtissues within a microfluidic device with real-time contractile stress readout

Aereas Aung et al. Lab Chip. .

Abstract

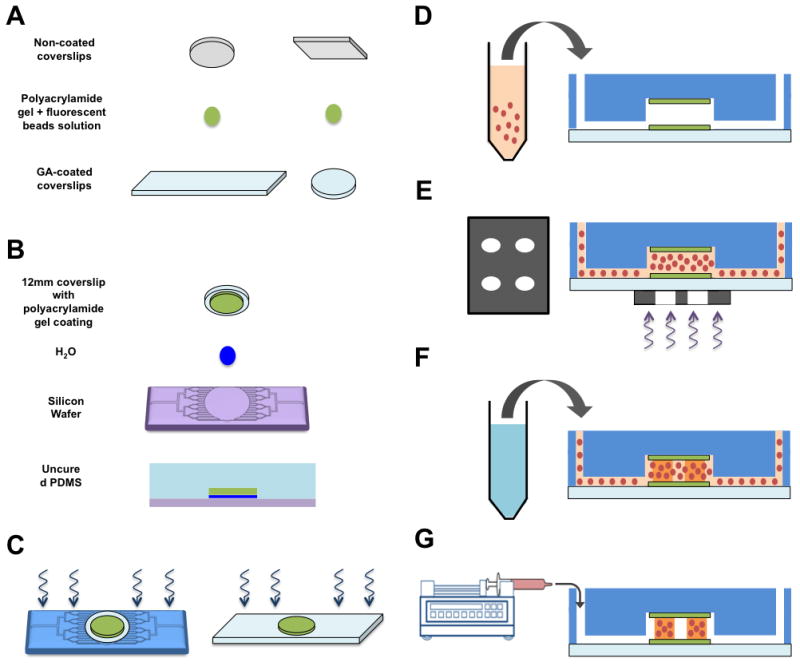
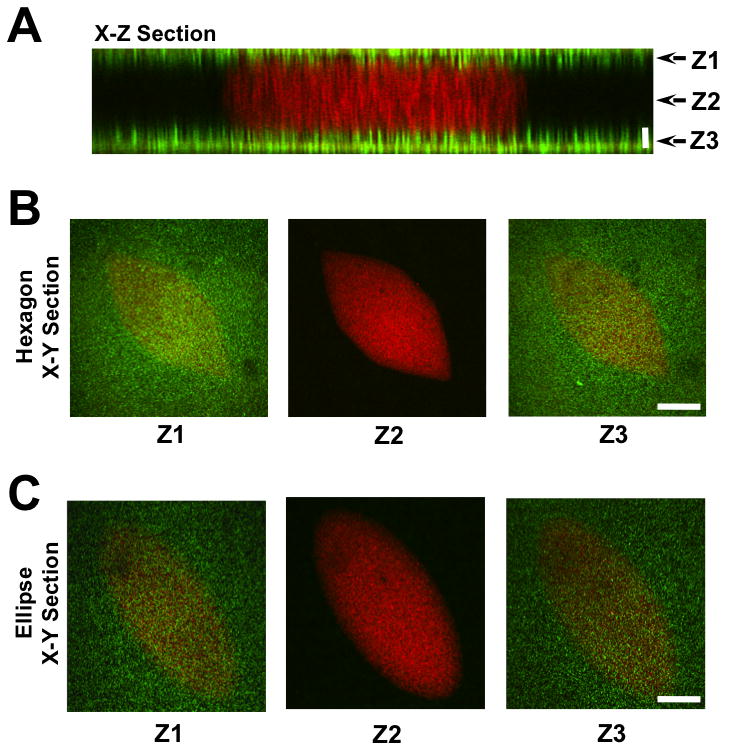
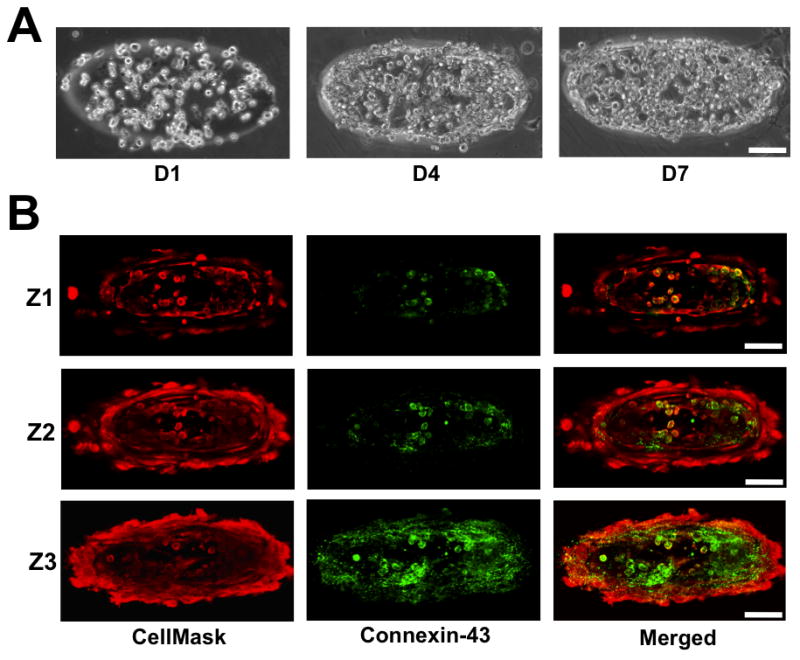
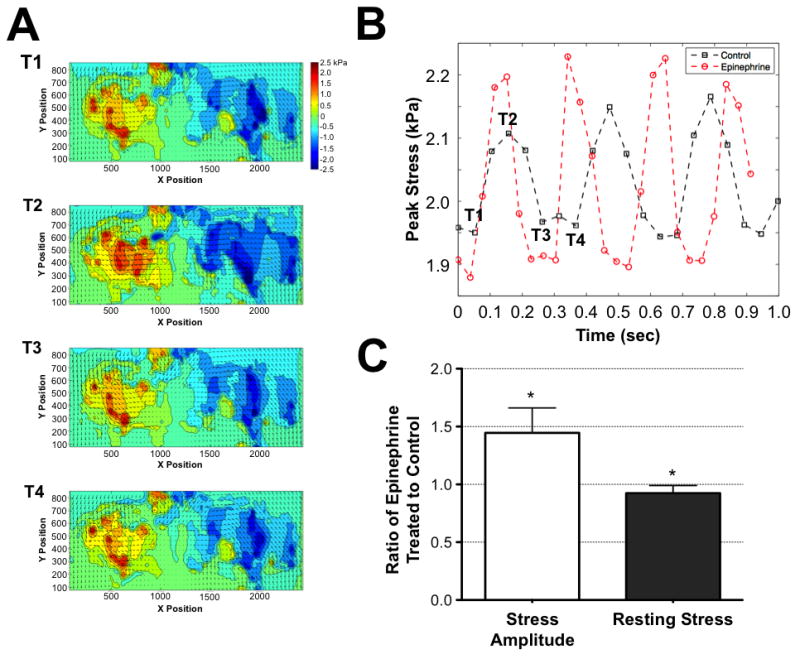
We present the development of three-dimensional (3D) cardiac microtissues within a microfluidic device with the ability to quantify real-time contractile stress measurements in situ. Using a 3D patterning technology that allows for the precise spatial distribution of cells within the device, we created an array of 3D cardiac microtissues from neonatal mouse cardiomyocytes. We integrated the 3D micropatterning technology with microfluidics to achieve perfused cell-laden structures. The cells were encapsulated within a degradable gelatin methacrylate hydrogel, which was sandwiched between two polyacrylamide hydrogels. The polyacrylamide hydrogels were used as "stress sensors" to acquire the contractile stresses generated by the beating cardiac cells. The cardiac-specific response of the engineered 3D system was examined by exposing it to epinephrine, an adrenergic neurotransmitter known to increase the magnitude and frequency of cardiac contractions. In response to exogenous epinephrine the engineered cardiac tissues exhibited an increased beating frequency and stress magnitude. Such cost-effective and easy-to-adapt 3D cardiac systems with real-time functional readout could be an attractive technological platform for drug discovery and development.


Figures

Figure 1
Figure 1. Schematic of microfluidic device fabrication and 3D cell encapsulation
(A) Two PAm hydrogels were polymerized by sandwiching the precursor solution mixed with fluorescent nanoparticles between regular and GA-treated coverslips. (B) A small droplet of DI water was deposited onto a Teflon-coated silicon wafer prior to placing a PAm hydrogel tethered on a circular coverslip on top. PDMS solution containing the curing agent (10:1 ratio) was gently poured onto the construct and cured at 37 °C overnight. (C) The PDMS mold attached to the PAm hydrogel was removed from the wafer and inlet and outlet ports of the device were generated using a hole punch. This construct was bonded to a rectangular coverslip tethered to a PAm hydrogel using UV/Ozone treatment. Care was taken to align the two hydrogels during the process. The device was placed in 60°C for an hour within a humidity chamber prior to moving to a 37°C chamber overnight. (D) Cells mixed with GelMA, photoinitiator, and ascorbic acid were injected into the chamber. (E) A patterned transparency photomask was placed underneath the PAm hydrogels before exposing the region to UV light. (F) PBS solution was injected into the device to remove GelMA mixture in the non-polymerized region. (G) The device was attached to a syringe pump containing maintenance media to culture the cells encapsulated within patterned GelMA matrices.
Figure 2
Figure 2. Characterization of tri-layer hydrogels
Z-stack images of the hydrogels (GelMA hydrogel sandwiched between acellular PAm hydrogels) were obtained using a laser scanning confocal microscope. The X-Z cross-section (A) and the corresponding X-Y planes at different Z locations are shown for hexagon (B) and ellipse (C) geometries. GelMA and the PAm hydrogels were embedded with red and green fluorescent nanoparticles, respectively, to visualize these structures. Horizontal scale bar: 100 μm. Vertical scale bar: 40 μm.
Figure 3
Figure 3. Characterization of encapsulated cardiomyocytes
(A) Cell density within the GelMA structures increased as a function of culture time. (B) X-Y confocal sections of cells ubiquitously stained with CellMask and immunostained for Connexin-43. Connexin-43 negative staining amongst the encapsulated cells suggests the presence of cardiac fibroblasts. The Confocal sections proceed from the top, Z1, to the bottom, Z3, of the GelMA structures. Scale bar: 100 μm.
Figure 4
Figure 4. Quantification of contractile stresses generated by the encapsulated cardiomyocytes
(A) The displacements of the PAm hydrogel, shown as a vector field, overlaid onto the heat map of the shear stresses applied on the PAm hydrogel along the major axis of the GelMA ellipse structures. The positive and negative stresses indicate the direction of the shear stresses. Positive and negative means towards the right and left, respectively. The X- and Y- axis of the graphs indicate the physical location of the measured quantities while the values within the heat map are indicated by the color bar. The T1 to T4 represents the time points during the contraction-relaxation cycles of the beating tissue for which the stress heat maps shown in (A) are generated. The peak stresses associated with each heat map labeled with T1 through T4 are shown in (B). (B) A representative plot of the peak traction stress as a function of time in the absence (black squares) and presence (red circles) of epinephrine. The stresses along the major axis of the GelMA structures were used for determining the peak value. (C) The ratio of stress amplitude and resting stress in the presence and absence of epinephrine measured from multiple cell-laden structures. Values lower than or higher than 1 indicates a decrease or increase in stress amplitude and resting stress, respectively, while a value of 1 suggests the lack of change. * indicates statistically significant difference (p < 0.05) obtained from t-test in the measured stress amplitude and resting stresses from microtissues before and after addition of epinephrine. The contractile stresses were calculated from 4 different chips with 3–5 different microtissues in each chip.

References

    1. Heylman C, Sobrino A, Shirure VS, Hughes CC, George SC. Experimental biology and medicine. 2014;239:1240–1254. - PMC - PubMed
    1. Haycock JW. Methods in molecular biology. 2011;695:1–15. - PubMed
    1. Kim J, Park J, Na K, Yang S, Baek J, Yoon E, Choi S, Lee S, Chun K, Park J, Park S. Journal of biomechanics. 2008;41:2396–2401. - PubMed
    1. Wang F, Weaver VM, Petersen OW, Larabell CA, Dedhar S, Briand P, Lupu R, Bissell MJ. Proceedings of the National Academy of Sciences of the United States of America. 1998;95:14821–14826. - PMC - PubMed
    1. Anders M, Hansen R, Ding RX, Rauen KA, Bissell MJ, Korn WM. Proceedings of the National Academy of Sciences of the United States of America. 2003;100:1943–1948. - PMC - PubMed

Publication types