. 2015 Nov 20;11(11):e1005652.
doi: 10.1371/journal.pgen.1005652. eCollection 2015 Nov.

Conserved piRNA Expression from a Distinct Set of piRNA Cluster Loci in Eutherian Mammals

Affiliations

Conserved piRNA Expression from a Distinct Set of piRNA Cluster Loci in Eutherian Mammals

Gung-Wei Chirn et al. PLoS Genet. .

Abstract

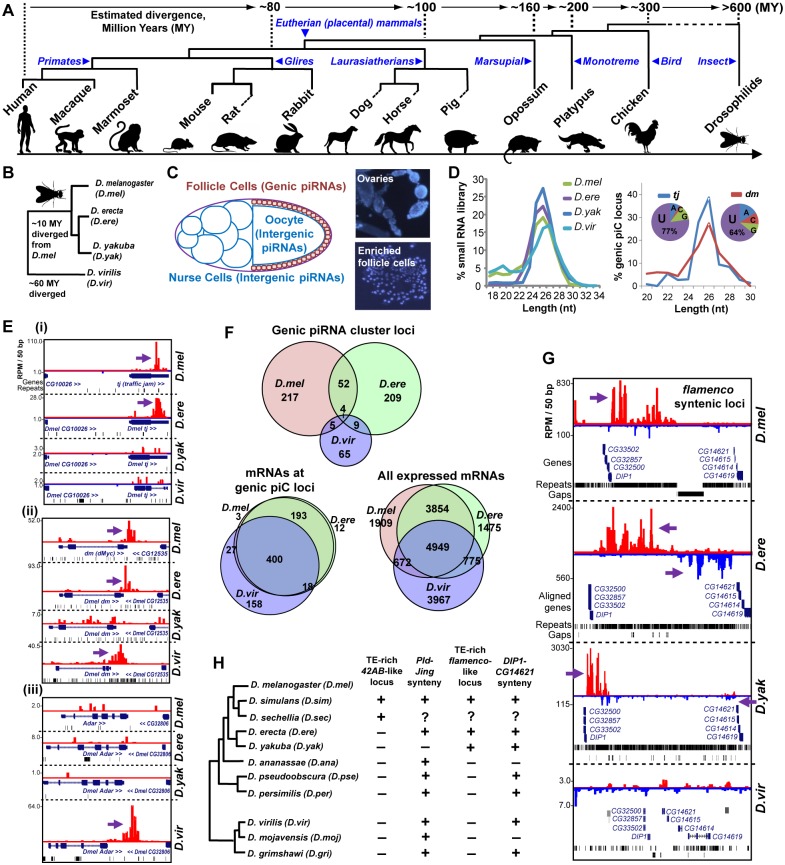
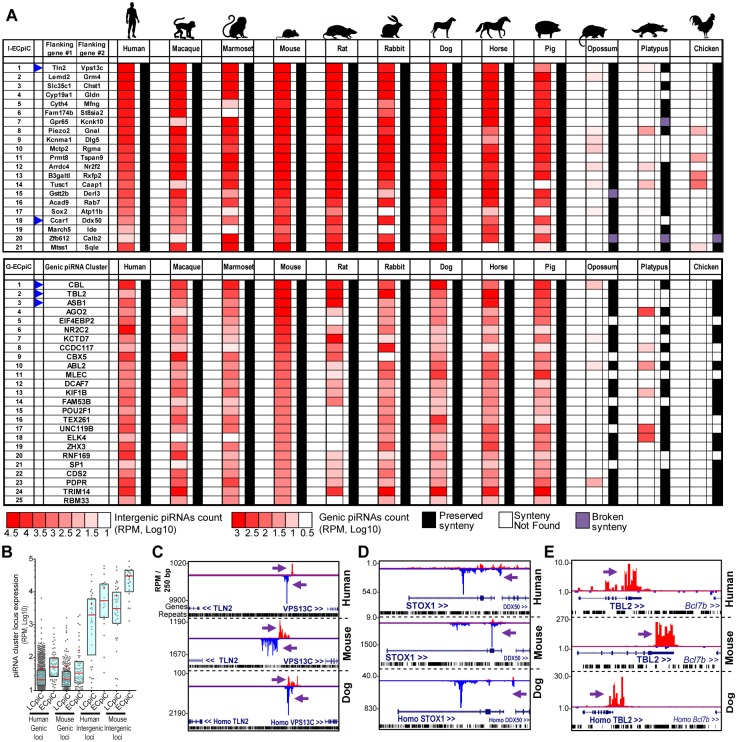
The Piwi pathway is deeply conserved amongst animals because one of its essential functions is to repress transposons. However, many Piwi-interacting RNAs (piRNAs) do not base-pair to transposons and remain mysterious in their targeting function. The sheer number of piRNA cluster (piC) loci in animal genomes and infrequent piRNA sequence conservation also present challenges in determining which piC loci are most important for development. To address this question, we determined the piRNA expression patterns of piC loci across a wide phylogenetic spectrum of animals, and reveal that most genic and intergenic piC loci evolve rapidly in their capacity to generate piRNAs, regardless of known transposon silencing function. Surprisingly, we also uncovered a distinct set of piC loci with piRNA expression conserved deeply in Eutherian mammals. We name these loci Eutherian-Conserved piRNA cluster (ECpiC) loci. Supporting the hypothesis that conservation of piRNA expression across ~100 million years of Eutherian evolution implies function, we determined that one ECpiC locus generates abundant piRNAs antisense to the STOX1 transcript, a gene clinically associated with preeclampsia. Furthermore, we confirmed reduced piRNAs in existing mouse mutations at ECpiC-Asb1 and -Cbl, which also display spermatogenic defects. The Asb1 mutant testes with strongly reduced Asb1 piRNAs also exhibit up-regulated gene expression profiles. These data indicate ECpiC loci may be specially adapted to support Eutherian reproduction.


Conflict of interest statement

The authors have declared that no competing interests exist.

Figures

Fig 1
Fig 1. Comparative genomics of piRNA cluster (piC) loci and rapid evolution of piC loci expression patterns in Drosophilids.
(A) Phylogenetic tree of the animals whose piRNAs are analyzed for this study. (B) Phylogenetic tree of the Drosophilids whose female piRNAs are profiled in this study. (C) Diagram of the Drosophilid ovarium where the different types of piRNAs are most abundantly expressed, and DAPI staining images of follicle cells enriched from ovaries during our preparations to balance the detection of genic piC loci from being overwhelmed by intergenic piC loci [28]. (D) Read length distributions for each small RNA library (left plot) and just the piRNAs in the genic piC loci, tj and dm. The pie chart insets show the 5' nucleotide composition of the genic piRNAs in these two loci.(E) Genome browser snapshots of the genic piC loci corresponding to piC-tj (i), piC-dm (ii, also known as Drosophila c-Myc), and piC-Adar (iii) showing some conserved and species-specific piRNA expression patterns. Purple arrows point to the start of bulk of piRNAs. Plus strand read peaks are red, minus strand read peaks are blue. (F) Venn diagrams of the overlap in genic piC locus expression (top) and the overlap in mRNA expression profiles (bottom sets) in three Drosophilid ovarium samples. The distributions of genic piC loci overlap are distinct from the distributions of mRNA expression profiles overlap (all p<0.001, Chi square test and ratio proportions test with Bonferroni correction). D.yak was omitted from this analysis because of much lower numbers of genic piC loci (see S2A Fig). (G) Snapshot of syntenic regions containing orthologous flamenco (flam) piC loci in D.mel, D.ere, and D.yak, but absence of this intergenic piC locus in D.vir. (H) Phylogeny of 11 Drosophilids with sequenced genomes and summary of the inspection in the genomes for the features at the syntenic regions for a 42AB-like locus and a flam-like locus, as defined by piRNAs or a contiguous large block concentrated with TEs between the flanking genes. Plus indicates locus/feature presence, minus is absence, while the question mark indicates a major gap in the genome assembly preventing determination. See S3 Fig for additional genome browser snapshots.
Fig 2
Fig 2. Rapid evolution of genic piC loci piRNA expression in mammals.
(A) Read length distributions for each mammalian small RNA library analyzed for this study. All libraries are from adult testes total RNA, grouped according to Primates, Glires, and Laurasiatherians. Genome browser snapshots of the rodent-specific piC-Tmem194a (B); a primate-specific piC-MAP3K9 (C); and two human-specific genic piC loci which have overlapping transcripts (D), piC-GTF2E2 (plus strand) and piC-RBPMS (minus strand). The mouse-specific piC-Arhgap20 (E); the rat-specific piC-Piwil1 (F) and the rabbit-specific piC-Riok1 (G). Purple arrows point to the start of bulk of piRNAs. Plus strand read peaks are red, minus strand read peaks are blue. (H) Venn diagrams of the overlap in genic piC loci expression (left) and the overlap in mRNA expression profiles (middle and right) amongst Primates, Glires, and Laurasiatherians, and a comparison species from the three clades. For each of species comparisons, the distributions of genic piC loci overlap are distinct from the distributions of mRNA expression profiles overlap (all p<0.001, Chi square test and proportions ratio test with Bonferroni correction).
Fig 3
Fig 3. Eutherian-Conserved piRNA cluster (ECpiC) loci.
(A) Heatmap diagram of piRNA expression and gene synteny for intergenic ECpiC loci (top) and the top 25 of 56 genic ECpiC loci (bottom). Remaining genic ECpiC loci and genomic coordinates for intergenic ECpiC loci are shown in S3 Table. Blue triangles highlight the piC loci discussed further in the study. (B) Box plots of interquartile ranges of piC loci piRNA expression levels. The red line and cross mark the median and mean, respectively. ECpiC loci tend express more piRNAs than Less-Conserved piC (LCpiC) loci. Genome browser snapshots of two notable intergenic ECpiC loci (C, D), and one notable genic ECpiC locus (E) from a representative of Primates (human), Glires (mouse) and Laurasiatherian (dog). Purple arrows point to the start of bulk of piRNAs. Plus strand read peaks are red, minus strand read peaks are blue. Full compilations are in S6 Fig.
Fig 4
Fig 4. Comparison of opossum, platypus and chicken piC loci to mouse piC loci.
(A) Heatmap showing piRNA and gene expression levels for genic ECpiC loci compared to the orthologs in opossum, platypus and chicken, for which many lack piRNAs but the mRNA transcript is consistently expressed in the adult testes. (B) Read length distributions for each tetrapod small RNA library analyzed for this study. All libraries are from adult testes total RNA. (C) Genome browser snapshots of genic piC loci from opossum (top), platypus (middle), and chicken (bottom). Purple arrows point to the start of bulk of piRNAs. Plus strand read peaks are red, minus strand read peaks are blue. (D) Intergenic piC loci from opossum (top), platypus (middle), and chicken (bottom). Comparison of piRNA and chromatin mark differences between the mouse piC-Asb1 locus and the orthologous chicken Asb1 locus (E); the mouse intergenic ECpiC#1 and the syntenic region in chicken (F); and the mouse PIWIL1 locus to the chicken PIWIL1 locus (G). The blue triangles point to notable peaks in the ChIP-seq chromatin marks plotted from the data of Li et al [19]. (H) A plot of unique-strand configurations for the transcripts within major piC loci between representative mammals, chicken, frog and fly. Notable D.mel single-strand piC loci (index closer to 1) and dual-strand piC loci (index closer to 0) from D.mel are marked. The bar marks the median of the distribution.
Fig 5
Fig 5. Phenotypes of two existing mouse mutants for genic ECpiC loci.
(A) Genome browser snapshot of piC-Asb1 (left) and piC-Cbl (right) in human, mouse and dog. Purple arrows point to the start of bulk of piRNAs. Plus strand read peaks are red, minus strand read peaks are blue. Full compilations are in S6 Fig. (B) Histology of mouse adult testes seminiferous tubules from the Asb1 mutant (left, image adapted from Fig 3 of [55], copyright of the American Society for Microbiology); and the Cbl mutant (right, image adapted from Fig 8 of [57], copyright of the Rockefeller University Press). Arrows points to normal spermatogenesis, the arrowheads points to empty tubules with sperm loss. HET, heterozygote, KO, homozygous knockout. (C) Northern blot analysis of Cbl piRNAs from adult testes from the mouse strain where Cbl exon 2 is flanked by LoxP sites (WT), or deleted by Cre recombinase for 1 allele (HET) or both alleles (KO). Quantitation of technical triplicates is shown to the right. (D) Top, profiles of Asb1 piRNAs from WT, HET and KO mutants which contain a LacZ/PGK-Neo insert disrupting exons 2 and 3. Two sets of animal pairs were examined. Bottom, Northern blot of Asb1 piRNAs and the Let-7 miRNA as loading control. (E) Quantitation of Asb1 piRNAs and Asb1 and Neomycin mRNAs. (F) Comparison of all piC loci expression between Asb1 KO and HET testes. (G) Volcano plot of gene expression profiles from testes (large plot) and kidney (smaller inset plot, same axis proportions). (H) Scatterplot of genes with predicted antisense-matching Asb1 piRNAs compared to gene expression changes between Asb1 KO and HET testes. The list of these gene names are in S4 Table.
Fig 6
Fig 6. A model for the evolution of piC loci expression patterns.
The rainbow of colored pictograms represents the diverse number of piC loci that are generally distinctly expressed between animal species or clades. We propose that most piC loci have evolved rapidly under non-adaptive evolutionary forces to result in this great diversity of piC loci expression patterns. However, a distinct set of piC loci (the same red-colored pictograms) is conserved in piRNA expression for >100M years of evolution in Eutherian mammals, perhaps to serve roles in mammalian reproduction.

References

    1. Grimson A, Srivastava M, Fahey B, Woodcroft BJ, Chiang HR, King N, et al. Early origins and evolution of microRNAs and Piwi-interacting RNAs in animals. Nature. 2008;455(7217):1193–7. Epub 2008/10/03. 10.1038/nature07415 - DOI - PMC - PubMed
    1. Juliano CE, Reich A, Liu N, Gotzfried J, Zhong M, Uman S, et al. PIWI proteins and PIWI-interacting RNAs function in Hydra somatic stem cells. Proceedings of the National Academy of Sciences of the United States of America. 2014;111(1):337–42. 10.1073/pnas.1320965111 - DOI - PMC - PubMed
    1. Pasquinelli AE, Reinhart BJ, Slack F, Martindale MQ, Kuroda MI, Maller B, et al. Conservation of the sequence and temporal expression of let-7 heterochronic regulatory RNA. Nature. 2000;408(6808):86–9. Epub 2000/11/18. - PubMed
    1. Girard A, Sachidanandam R, Hannon GJ, Carmell MA. A germline-specific class of small RNAs binds mammalian Piwi proteins. Nature. 2006;442(7099):199–202. - PubMed
    1. Lau NC, Seto AG, Kim J, Kuramochi-Miyagawa S, Nakano T, Bartel DP, et al. Characterization of the piRNA complex from rat testes. Science. 2006;313(5785):363–7. - PubMed

Publication types

Substances