. 2015 Nov 17;109(10):2101-12.
doi: 10.1016/j.bpj.2015.09.028.

Contributions of Ca2+-Independent Thin Filament Activation to Cardiac Muscle Function

Affiliations

Contributions of Ca2+-Independent Thin Filament Activation to Cardiac Muscle Function

Yasser Aboelkassem et al. Biophys J. .

Abstract

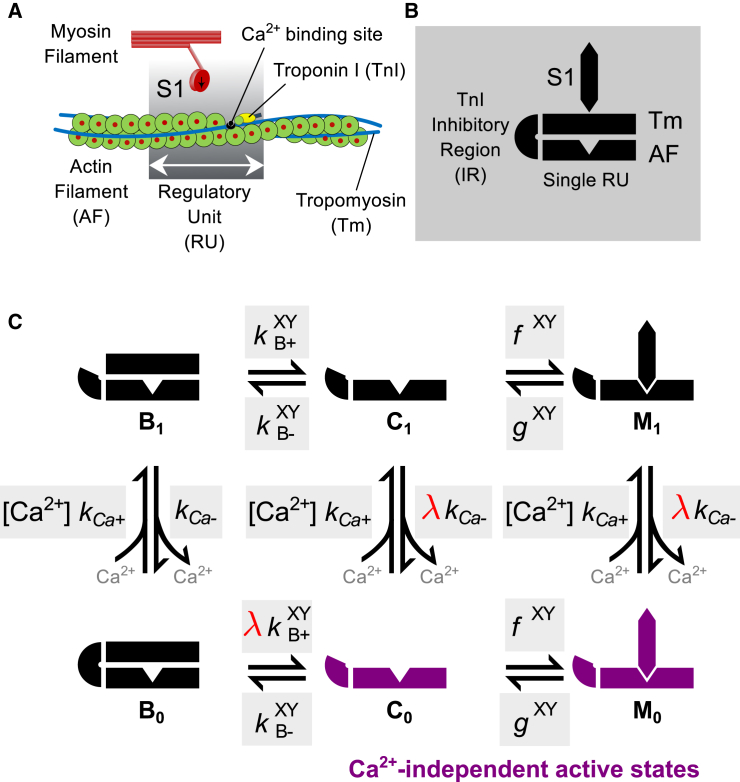
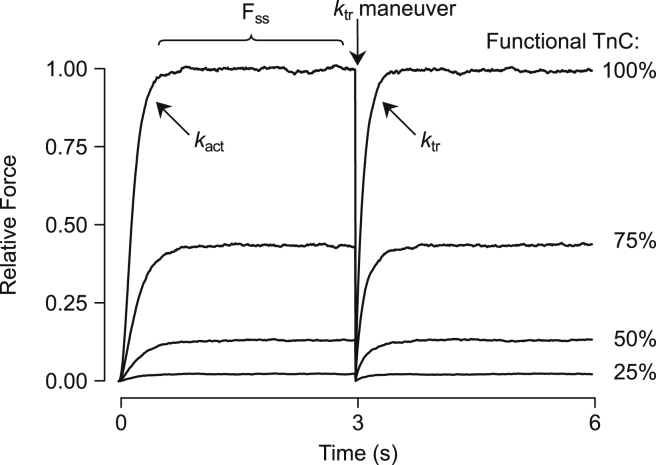
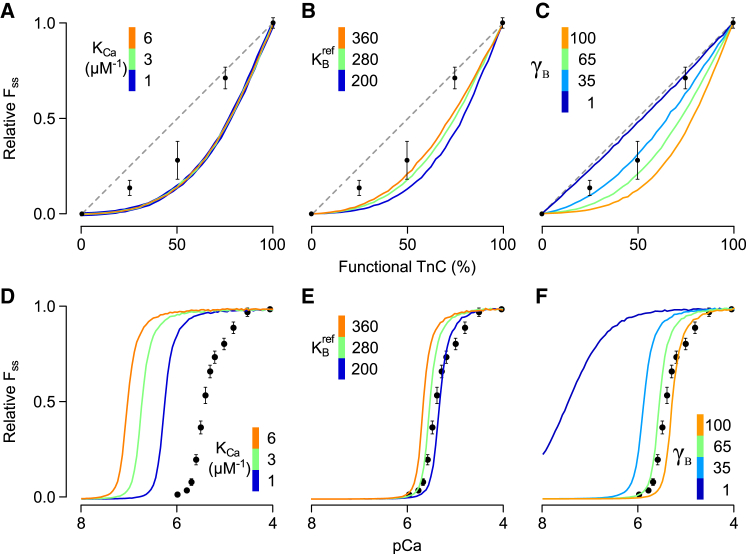
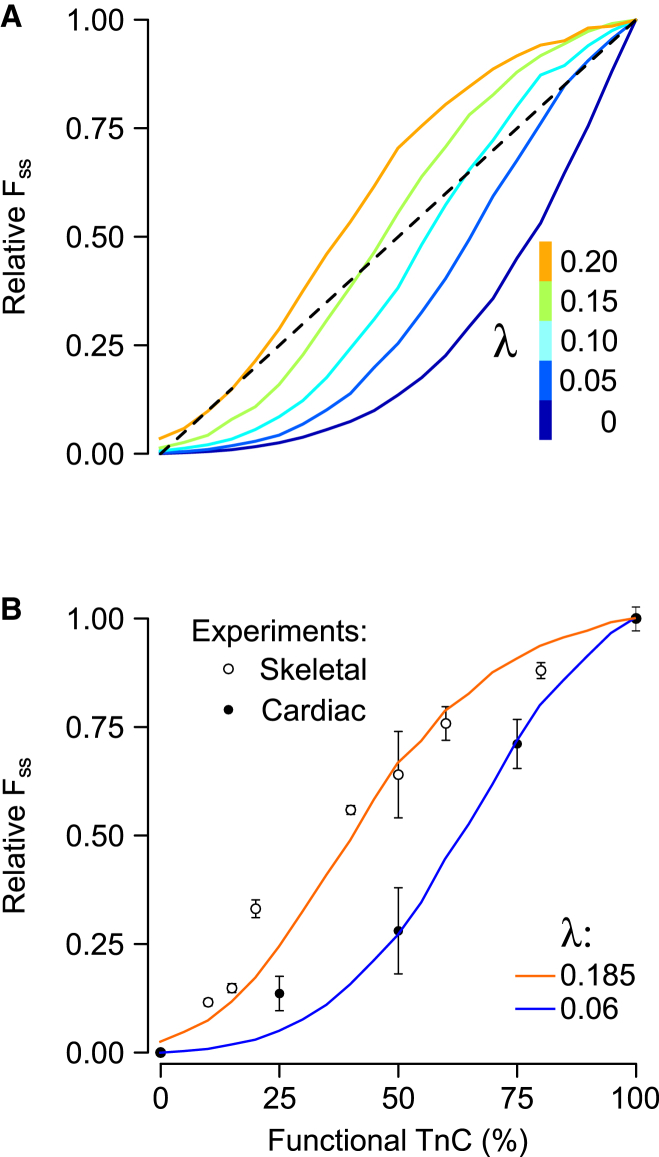
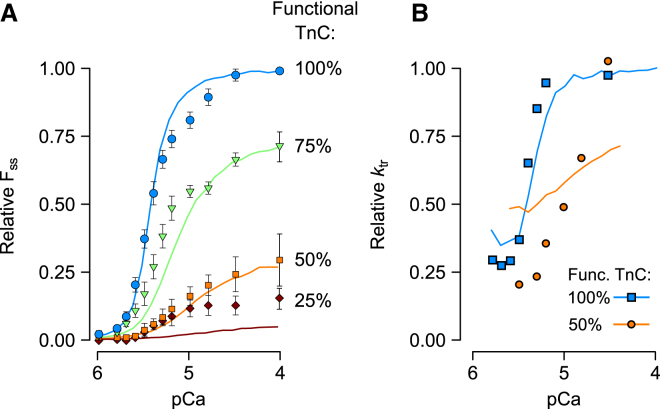
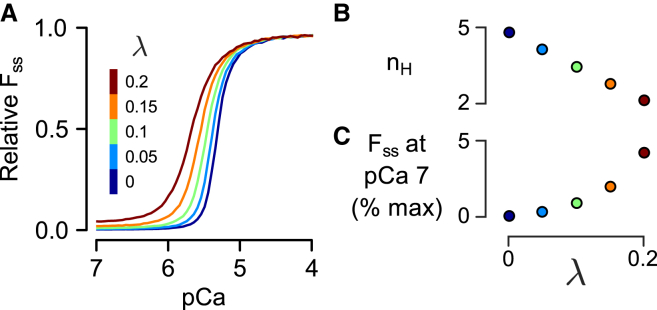
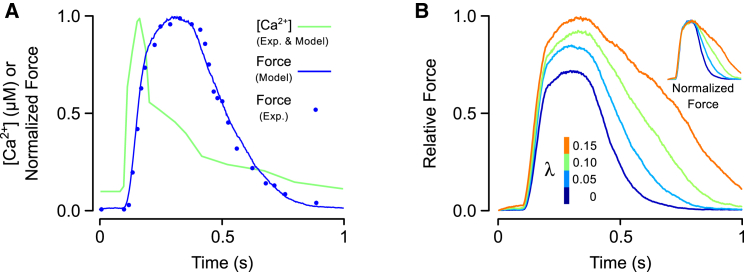
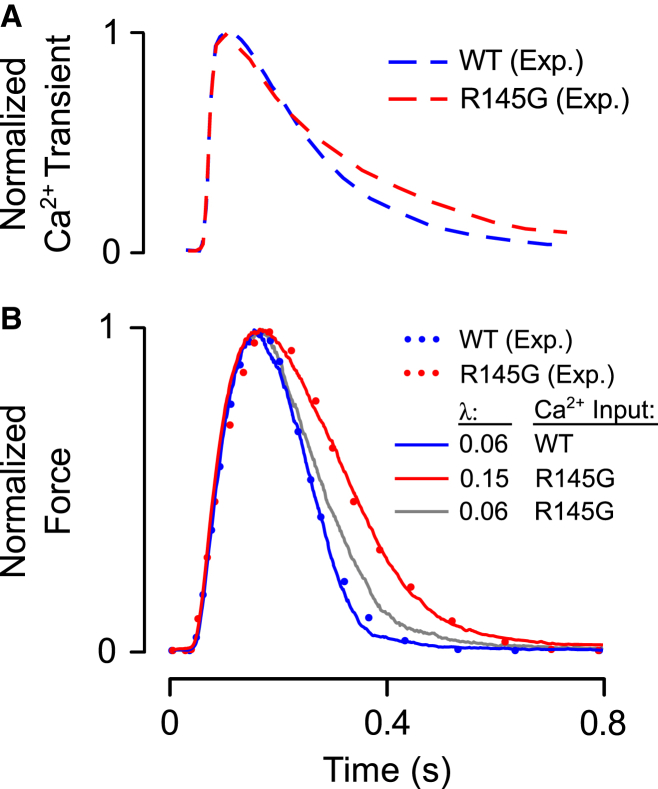
Although Ca2+ is the principal regulator of contraction in striated muscle, in vitro evidence suggests that some actin-myosin interaction is still possible even in its absence. Whether this Ca2+-independent activation (CIA) occurs under physiological conditions remains unclear, as does its potential impact on the function of intact cardiac muscle. The purpose of this study was to investigate CIA using computational analysis. We added a structurally motivated representation of this phenomenon to an existing myofilament model, which allowed predictions of CIA-dependent muscle behavior. We found that a certain amount of CIA was essential for the model to reproduce reported effects of nonfunctional troponin C on myofilament force generation. Consequently, those data enabled estimation of ΔGCIA, the energy barrier for activating a thin filament regulatory unit in the absence of Ca2+. Using this estimate of ΔGCIA as a point of reference (∼7 kJ mol(-1)), we examined its impact on various aspects of muscle function through additional simulations. CIA decreased the Hill coefficient of steady-state force while increasing myofilament Ca2+ sensitivity. At the same time, CIA had minimal effect on the rate of force redevelopment after slack/restretch. Simulations of twitch tension show that the presence of CIA increases peak tension while profoundly delaying relaxation. We tested the model's ability to represent perturbations to the Ca2+ regulatory mechanism by analyzing twitch records measured in transgenic mice expressing a cardiac troponin I mutation (R145G). The effects of the mutation on twitch dynamics were fully reproduced by a single parameter change, namely lowering ΔGCIA by 2.3 kJ mol(-1) relative to its wild-type value. Our analyses suggest that CIA is present in cardiac muscle under normal conditions and that its modulation by gene mutations or other factors can alter both systolic and diastolic function.


Figures

Figure 1
Figure 1
Schematic diagram of model components and states. (A) The model represents the function of individual thin filament regulatory units (RUs), as well as their interactions with myosin S1 and nearest neighbor RUs along the thin filament. (B) Illustration of symbols used to represent key myofilament components, including a single RU, the TnI inhibitory region (IR), tropomyosin (Tm), and myosin S1. (C) State diagram showing the assumed six possible regulatory states for an individual RU. (Shaded boxes) Kinetic rates for each state transition. From the B0 state, activation can proceed through Ca2+ binding, which causes the IR to dissociate from actin, or through spontaneous transfer of TnI from actin to TnC (see main text for details). The degree of Ca2+-independent activation is controlled by the parameter λ (red). When λ > 0, the Ca2+-independent activated states C0 and M0 (purple) can be occupied. Superscripts X and Y on some rates indicate that they are subject to these states occupied by neighboring RUs along the thin filament. To see this figure in color, go online.
Figure 2
Figure 2
Model output for typical simulations. The model predicts contractile force produced by the myofilaments during sudden exposure to Ca2+. pCa was set to 4 in these records at time zero. After a period of rapid change (described by the rate constant kact), force reached a steady-state level (FSS). A slack/restretch maneuver was then mimicked by instantaneously removing all attached cross bridges and observing the rate of force redevelopment (ktr). Simulations were also performed in which Ca2+ binding to some fraction of randomly selected RUs was eliminated, imitating experiments in which nonfunctional troponin C (TnC) was incorporated into myofilaments (19, 20). Initial simulations with the tightly coupled model (i.e., λ = 0) are shown here under conditions of 100, 75, 50, and 25% functional TnC. Force is shown relative to FSS of the 100% functional TnC curve.
Figure 3
Figure 3
Sensitivity of the tightly coupled model to various parameter changes. The dependence of FSS on % functional TnC (A–C) and on pCa (D–F) was studied in the tightly coupled model (λ = 0) while perturbing other key model parameters. Perturbations included large changes in the Ca2+-TnC equilibrium constant (KCa, A and D), the equilibrium constant governing the B → C transition (KBref, B and E), and the cooperative coefficient γB (C and F). Measured FSS-functional TnC and FSS-pCa relationships were digitized from Gillis et al. (19) and are shown here for comparison. (AC, dashed line) Generic 1:1 relationship between FSS and % functional TnC for reference. Under conditions of tight coupling, none of the parameter changes were capable of producing curves rising above the 1:1 line or having the characteristic inflection point implied by data from experiments. Changes that tended to improve agreement with the data in (A)–(C) shifted the corresponding curves away from measurements in (D)–(F). To see this figure in color, go online.
Figure 4
Figure 4
The effect of Ca2+-independent activation (λ) on the FSS-xTnC relationship. (A) FSS-xTnC curves were computed for values of λ ranging between 0 and 0.2. (B) λ-values of 0.06 and 0.185 most closely reproduced experimental data reported in cardiac (19) and skeletal muscle preparations (20), respectively. To see this figure in color, go online.
Figure 5
Figure 5
Predicted effects of xTnC on FSS-pCa relationships (A) and ktr-pCa relationships (B). The 100% functional TnC curves (light blue in A and B) were obtained by fitting the model simultaneously to the experimentally reported values from Gillis et al. (19) for both relationships, along with the FSS-xTnC relationship reported in that same study (Fig. 4B). Fitted values are listed under set 1 in Table 1. Predictions of FSS and ktr (solid lines) in the presence of xTnC were produced using set 1, but with increasing levels of simulated xTnC. (Symbols) Data digitized from the study of Gillis et al. (19). To see this figure in color, go online.
Figure 6
Figure 6
Effects of the parameter λ on the steady-state force (FSS). (A) FSS as a function of pCa is shown for several different values of λ. (Dark blue line) Tight coupling case (λ = 0). Increasing degrees of loose coupling or Ca2+-independent activation (λ > 0) are shown by other colors, as labeled. (B) Increased λ reduces the Hill coefficient (nH) of the FSS-pCa curves in a linear fashion. (C) Increasing λ increases the relative force produced by the model under low Ca2+ conditions (pCa 7). To see this figure in color, go online.
Figure 7
Figure 7
Simulations of cardiac twitch events. (A) A Ca2+ transient was digitized from a study of rat cardiac trabeculae (21) and used as an input to the model (green trace). The predicted twitch force was compared against a measured twitch response from the same study. Model parameters were adjusted to minimize error between the measured and simulated twitches (Table 1, set 2). (B) The effect of Ca2+-independent activation on twitch force was examined by simulating twitches while varying λ between 0 and 0.15. The Ca2+ transient shown in (A) was used to elicit each contraction. Twitch magnitude has been scaled to the peak twitch force for λ = 0.15, at which 70% of RUs contained attached cross bridges. (Inset, B) Overlay of twitches after each has been normalized to its own peak. To see this figure in color, go online.
Figure 8
Figure 8
Analysis of the functional consequences of the TnI mutation R145G. (A) Ca2+ transients were digitized from a study of papillary muscles taken from WT mice and R145G mutants by Wen et al. (22). (B) Simulated twitch responses (solid traces) were obtained by driving the model with Ca2+ transients shown in (A). Model parameters were adjusted until output force (blue trace) matched a measured WT twitch record (blue dots). The fitted parameters are reported in Table 1, set 3. Then, driving the model with the R145G transient, the parameter λ was increased to determine whether this change was capable of explaining the effects of the mutation. Increasing λ from 0.06 to 0.15 allowed the model (red trace) to reproduce the measured R145G twitch record (red dots). To illustrate that the change in λ exerted substantial effects on twitch independent of the differences in WT and R145G Ca2+ transients, λ was set to 0.06 once again and the model was driven with the R145G transient (gray trace). To see this figure in color, go online.

References

    1. Gordon A.M., Homsher E., Regnier M. Regulation of contraction in striated muscle. Physiol. Rev. 2000;80:853–924. - PubMed
    1. Fuchs F. Thermal inactivation of the calcium regulatory mechanism of human skeletal muscle actomyosin: a possible contributing factor in the rigidity of malignant hyperthermia. Anesthesiology. 1975;42:584–589. - PubMed
    1. McKillop D.F., Geeves M.A. Regulation of the interaction between actin and myosin subfragment 1: evidence for three states of the thin filament. Biophys. J. 1993;65:693–701. - PMC - PubMed
    1. Schaertl S., Lehrer S.S., Geeves M.A. Separation and characterization of the two functional regions of troponin involved in muscle thin filament regulation. Biochemistry. 1995;34:15890–15894. - PubMed
    1. Maytum R., Westerdorf B., Geeves M.A. Differential regulation of the actomyosin interaction by skeletal and cardiac troponin isoforms. J. Biol. Chem. 2003;278:6696–6701. - PubMed

Publication types