. 2015 Nov 17;109(10):2113-25.
doi: 10.1016/j.bpj.2015.10.018.

High Spatiotemporal-Resolution Magnetic Tweezers: Calibration and Applications for DNA Dynamics

Affiliations

High Spatiotemporal-Resolution Magnetic Tweezers: Calibration and Applications for DNA Dynamics

David Dulin et al. Biophys J. .

Abstract

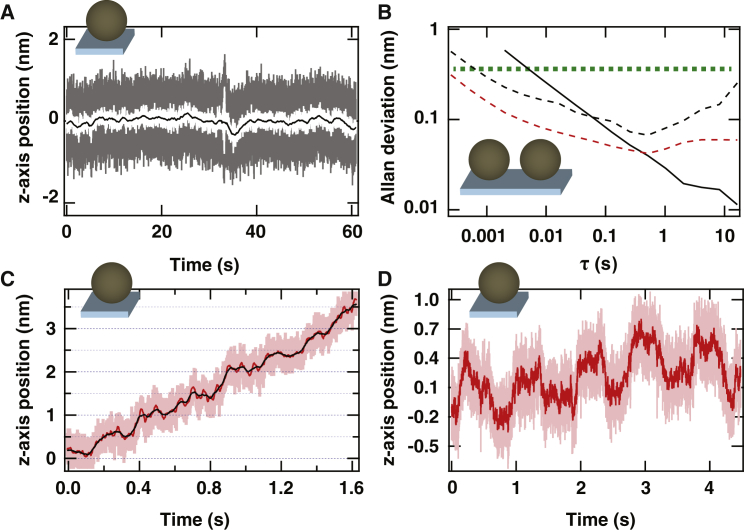
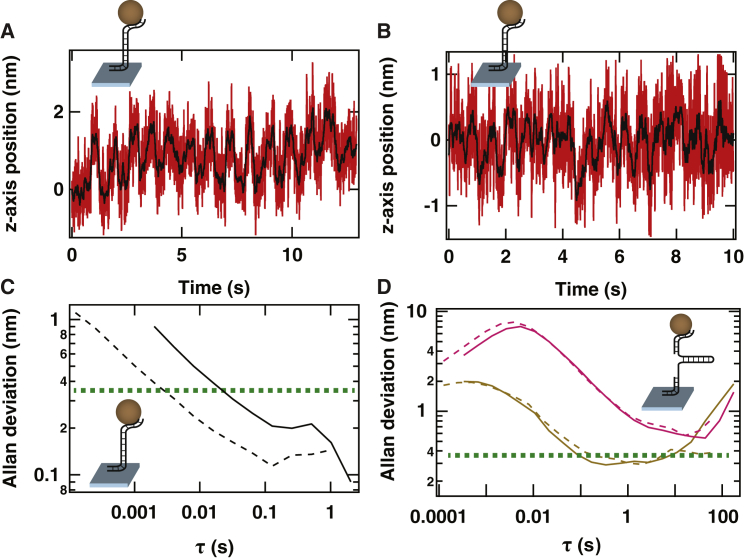
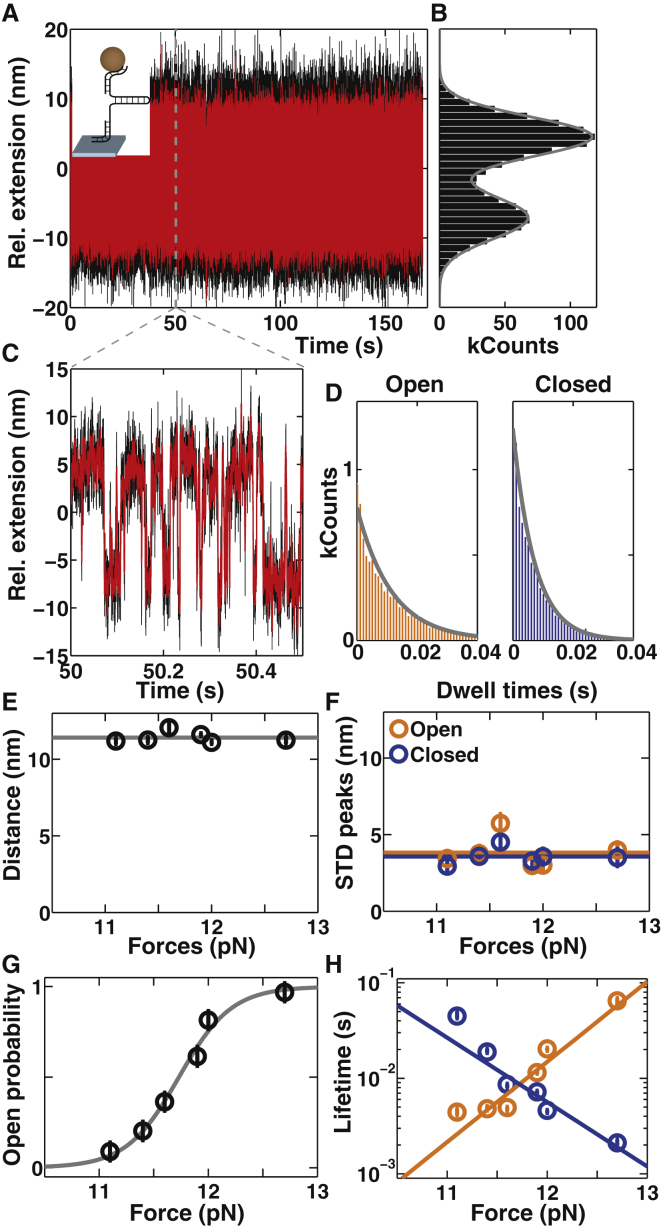
The observation of biological processes at the molecular scale in real time requires high spatial and temporal resolution. Magnetic tweezers are straightforward to implement, free of radiation or photodamage, and provide ample multiplexing capability, but their spatiotemporal resolution has lagged behind that of other single-molecule manipulation techniques, notably optical tweezers and AFM. Here, we present, to our knowledge, a new high-resolution magnetic tweezers apparatus. We systematically characterize the achievable spatiotemporal resolution for both incoherent and coherent light sources, different types and sizes of beads, and different types and lengths of tethered molecules. Using a bright coherent laser source for illumination and tracking at 6 kHz, we resolve 3 Å steps with a 1 s period for surface-melted beads and 5 Å steps with a 0.5 s period for double-stranded-dsDNA-tethered beads, in good agreement with a model of stochastic bead motion in the magnetic tweezers. We demonstrate how this instrument can be used to monitor the opening and closing of a DNA hairpin on millisecond timescales in real time, together with attendant changes in the hairpin dynamics upon the addition of deoxythymidine triphosphate. Our approach opens up the possibility of observing biological events at submillisecond timescales with subnanometer resolution using camera-based detection.


Figures

Figure 1
Figure 1
Description of the experimental apparatus and computation of the expected spatiotemporal resolution. (A) Schematic representation of the experimental setup (not to scale). A pair of magnets in a vertical orientation separated by a gap of either 1 mm or 0.3 mm is placed above a flow cell. The illumination source is either a high-power fiber-coupled LED or a laser diode, and the emitted light is collimated before passing through the gap separating the magnets and illuminating the sample. The tracked beads are superparamagnetic beads tethered to either a 1.9 kb dsDNA or a 1.1 kb hairpin, and latex nonmagnetic reference beads are directly adhered to its surface via melting (Materials and Methods). The hairpin contains a 40 nucleotides ssDNA sequence on one side, as indicated. The dsDNA and hairpin molecules are both attached via ligated DNA handles, one of which includes multiple biotin labels for attachment to the streptavidin-coated magnetic bead and a second that contains multiple digoxigenin labels for attachment to the flow-cell surface. The light is collected by a high-NA objective, and images are projected onto a high-speed CMOS camera via a 400 mm tube lens (see Materials and Methods). The collected frames are transferred first to a frame grabber and then to a computer. They are analyzed using an nVIDIA graphics card at a rate of up to 8 kHz for a single bead. (B) Calculation of the standard deviation, δz, at 0.01 s of the z-position of a tethered bead (radius R = 500 nm) as a function of the DNA extension at 18 pN applied force, F, for either ssDNA (persistence length Lp = 0.5 nm, black line) or dsDNA (persistence length Lp = 50 nm, red line). The equivalent bandwidth, Beq, is set to 100 Hz (Eq. 3). (C) Calculation of the characteristic time, tc,z, of the bead-tether system at 18 pN according to Eq. 5. All parameters are identical to those in (B). To see this figure in color, go online.
Figure 2
Figure 2
Spatiotemporal resolution for surface-melted beads. (A) Typical trace of the tracked position along the z-coordinate of a surface-melted latex bead (1.5 μm diameter). This trace does not include subtraction of the reference-bead position. Laser illumination is employed, and real-time tracking is performed at 4 kHz. Gray line, raw data; white line, data boxcar filtered at 10 ms; black line, data boxcar filtered at 1 s. (B) The ADs for 1.5-μm-diameter surface-melted latex beads under different types of illumination: laser illumination coupled to an acquisition frequency of 4 kHz (black and red dashed lines) and a high-power fiber-coupled LED illumination coupled to an acquisition frequency of 500 Hz (black solid line). All data sets were measured at an illumination intensity corresponding to 150 gray levels. The reference-bead position has been subtracted from that of the surface-melted beads before computation of the AD for the black dashed and solid lines. The red dashed line is the AD of the trace in (A), for which the reference-bead position has not been subtracted. The horizontal green dashed line in (B) represents the distance between basepairs of dsDNA, 0.34 nm. (C) Resolving 0.5 nm steps every 0.25 s using a 3 μm surface-melted latex bead. The raw data (at 6 kHz acquisition frequency), data smoothed at 100 Hz, and data smoothed at 20 Hz are represented in light red, red, and black, respectively. The inset is a zoom of the steps. (D) Resolving 0.3 nm steps every 0.5 s with a 2.8-μm-diameter surface-melted M270 magnetic bead. The color code is identical to that in (C). In both (C) and (D), a laser is used to illuminate the field of view, resulting in an intensity of 150 gray levels on the camera. To see this figure in color, go online.
Figure 3
Figure 3
Spatiotemporal resolution for dsDNA- and hairpin-tethered magnetic beads. (A) Resolving 1.0 nm steps along the z axis with a 1.9 kbp dsDNA tethered to a MyOne bead, under a force of 18 pN. The steps are performed by the piezo stage every 0.25 s. (B) Resolving 0.5 nm steps along the z axis with a 1.9 kbp dsDNA tethered to a MyOne bead, under a force of 18 pN. The steps result from the square-wave motion of the piezo stage with a period of 0.75 s. In (A) and (B), the raw data have been acquired with a laser-based illumination at an acquisition frequency of 8 kHz and subsequently boxcar filtered at 100 Hz (red) and 10 Hz (black). (C) The AD of the z-position for a 1.9 kbp dsDNA tethered MyOne bead at 18 pN force, illuminated either by a laser-based illumination (dashed line; 8 kHz acquisition frequency (A)) or an LED-based illumination (solid line; 500 Hz acquisition frequency). (D) The AD of the x (pink lines) and z (brown lines) positions for a hairpin tethered to a MyOne bead under ∼12 pN of force (closed hairpin). Illumination is provided either by a high-power fiber-coupled LED-based illumination (solid lines), in which case 100× magnification is employed and real-time tracking is performed at an acquisition frequency of 3 kHz, or by laser-based illumination (dashed lines), in which case 200× magnification is employed and real-time tracking is performed at an acquisition frequency of 8 kHz. In both cases, the number of gray levels is set to 150. The horizontal green dashed line in (C) and (D) represents the DNA basepair distance, 0.34 nm. To see this figure in color, go online.
Figure 4
Figure 4
Resolving fast hairpin opening and closing transitions. The data presented are from a single DNA hairpin with a 1052 bp stem and a 40 nucleotide ssDNA handle (Fig. 1A and Materials and Methods) tethered between a flow-cell surface and a MyOne bead. (A) Time trace of the extension at 11.9 pN stretching force. Raw data were recorded at 8 kHz (black) with laser illumination and a resulting intensity of 150 gray levels on the camera. The data were subsequently filtered at 1 kHz (red). (B) Histogram of the extension data from (A) (black; the bin size is 1 nm) and fit to a double Gaussian (gray line). (C) Zoom of a segment of the extension time trace. The zoomed-in region is indicated by the dashed gray lines in (A). The same color code is employed as in (A). (D) Distribution of dwell times in the up/open (orange) and down/closed (blue) states determined from the 1 kHz filtered data from (A). Bin size is 1 ms. Gray lines are exponential functions determined from a maximum-likelihood fit to the data with τopen = 11.5 ± 0.3 ms and τclosed = 7.2 ± 0.2 ms. (E) Distance between the open- and closed-state peaks as a function of applied stretching force. Averaged over all points, the mean is 11.4 ± 0.4 nm (solid line). (F) Standard deviation of the open- (orange) and closed-state (blue) peaks from double Gaussian fits. The averages of the standard deviations are 3.8 ± 1.0 and 3.6 ± 0.5 nm, respectively (as indicated by the solid lines of the same color). (G) Fraction of time spent in the open state as a function of applied force. The gray line is a fit (reduced χ2 = 0.71) of a two-state model, indicating a transition force, F1/2 = 11.7 pN. Data points and error bars in panels (E)–(G) are the mean and standard deviations of 3 traces recorded on the same hairpin. Errorbars for some points are smaller than the symbols. (H) Lifetimes of the open (orange) and closed (blue) states as a function of applied force. Lifetimes were determined from maximum-likelihood fits to the dwell-time distributions in (D). Solid lines are exponential fits of the form τo/c(F) = τo/c(0) × exp(Δxo/c × F/kBT) with τopen(0) = 1.85 fs, τclosed(0) = 1.75 ms, Δxopen = 7.70 nm, and Δxclosed = −6.68 nm. Error bars indicate the 95% confidence intervals of the maximum-likelihood exponential fits to the dwell-time distributions. To see this figure in color, go online.
Figure 5
Figure 5
The hairpin opening transition acts as a molecular sensor for dTTP. The data presented are for the same bead-tether combination and illumination settings as in Fig. 4, obtained under a constant force of 11.8 pN. (A) The distance between the open and closed states (black circles) and the standard deviations of the peaks corresponding to the open (red circles) and closed (blue circles) states as a function of dTTP concentration. Distances and standard deviations were determined from double Gaussian fits similar to that in Fig. 4B. Data points and error bars here and in (B) are the mean ± SD values of three traces recorded under identical conditions. Error bars for some points are smaller than the symbols. Lines are the mean values (distance = 10.9 ± 0.4 nm; STDopen = 3.3 ± 0.7 nm; STDclosed = 3.7 ± 0.7 nm) of the corresponding quantities, averaged over all dTTP concentrations. (B) The fraction of time spent in the open state as a function of dTTP concentration. The data were fit (reduced χ2 = 1.27) to a binding isotherm (gray line) of the form popen = c1 + c2 × [dTTP]/([dTTP] + K), with fitted constants c1 = 0.53 and c2 = 0.35 and binding constant K = 92 μM. (C) Lifetimes in the open (red) and closed (blue) states as a function of dTTP concentration. Lifetimes were determined from maximum-likelihood fits to the dwell-time distributions similar to those in Fig. 4D. Error bars indicate the 95% confidence intervals. (D) Ratio of the lifetimes from (C) versus dTTP concentration. All data were recorded at 8 kHz under a constant force of 11.8 pN, using the same hairpin construct as in Fig. 4, MyOne beads, laser illumination, and an intensity of 150 gray levels on the camera. For each dTTP concentration, the hopping transitions were recorded for at least 100 s. To see this figure in color, go online.

References

    1. Alberts B. Garland Science; New York: 2002. Molecular Biology of the Cell.
    1. Xie S.N. Single-molecule approach to enzymology. Single Mol. 2001;2:229–236.
    1. Dulin D., Lipfert J., Dekker N.H. Studying genomic processes at the single-molecule level: introducing the tools and applications. Nat. Rev. Genet. 2013;14:9–22. - PubMed
    1. Moffitt J.R., Chemla Y.R., Bustamante C. Recent advances in optical tweezers. Annu. Rev. Biochem. 2008;77:205–228. - PubMed
    1. Joo C., Balci H., Ha T. Advances in single-molecule fluorescence methods for molecular biology. Annu. Rev. Biochem. 2008;77:51–76. - PubMed

Publication types