. 2015 Nov 17;43(5):933-44.
doi: 10.1016/j.immuni.2015.11.001.

Isoforms of RNA-Editing Enzyme ADAR1 Independently Control Nucleic Acid Sensor MDA5-Driven Autoimmunity and Multi-organ Development

Affiliations

Isoforms of RNA-Editing Enzyme ADAR1 Independently Control Nucleic Acid Sensor MDA5-Driven Autoimmunity and Multi-organ Development

Kathleen Pestal et al. Immunity. .

Abstract

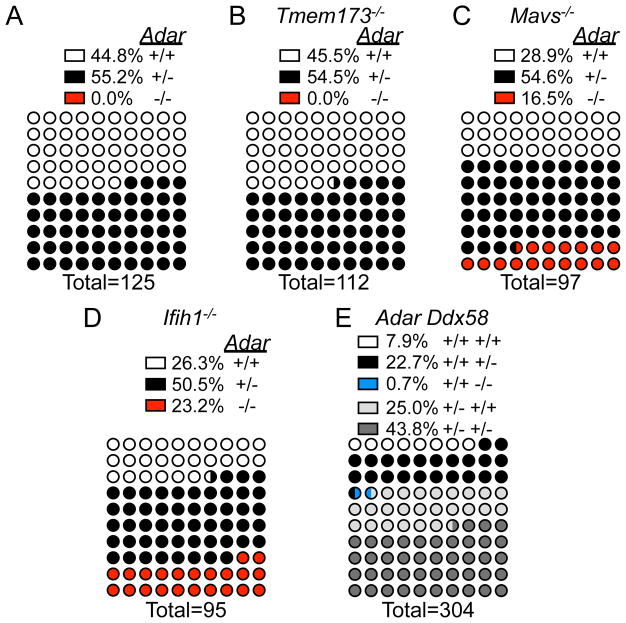
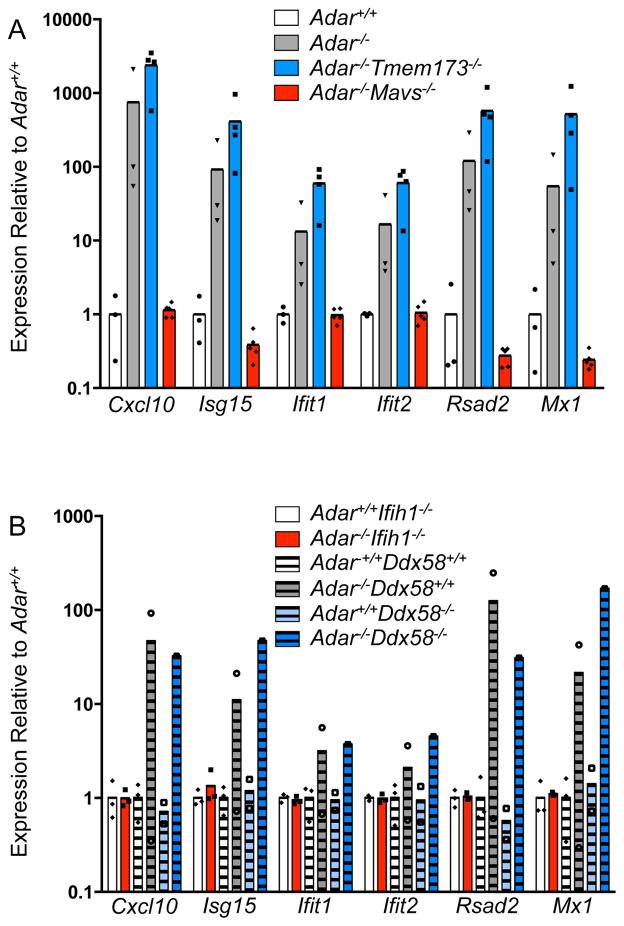
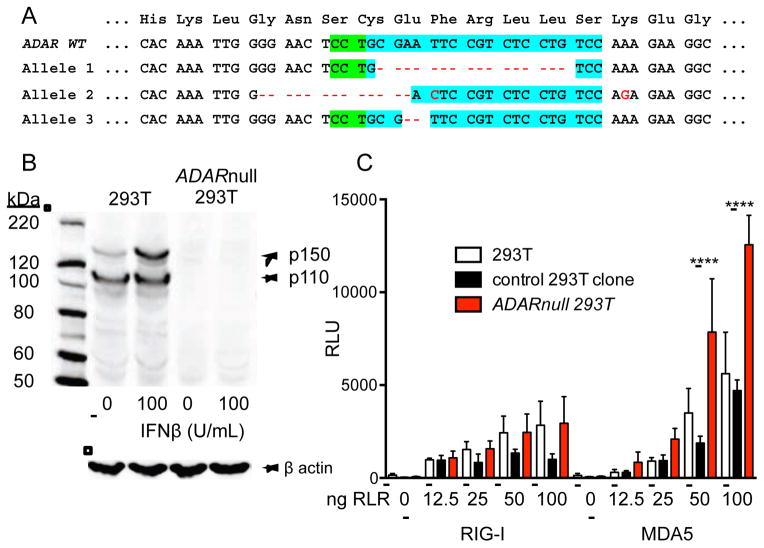
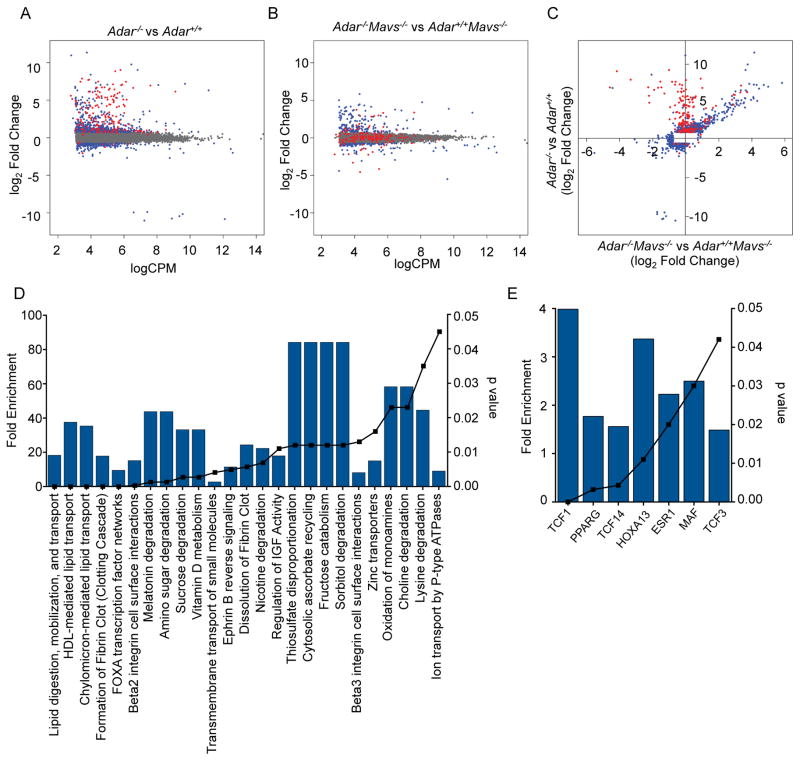
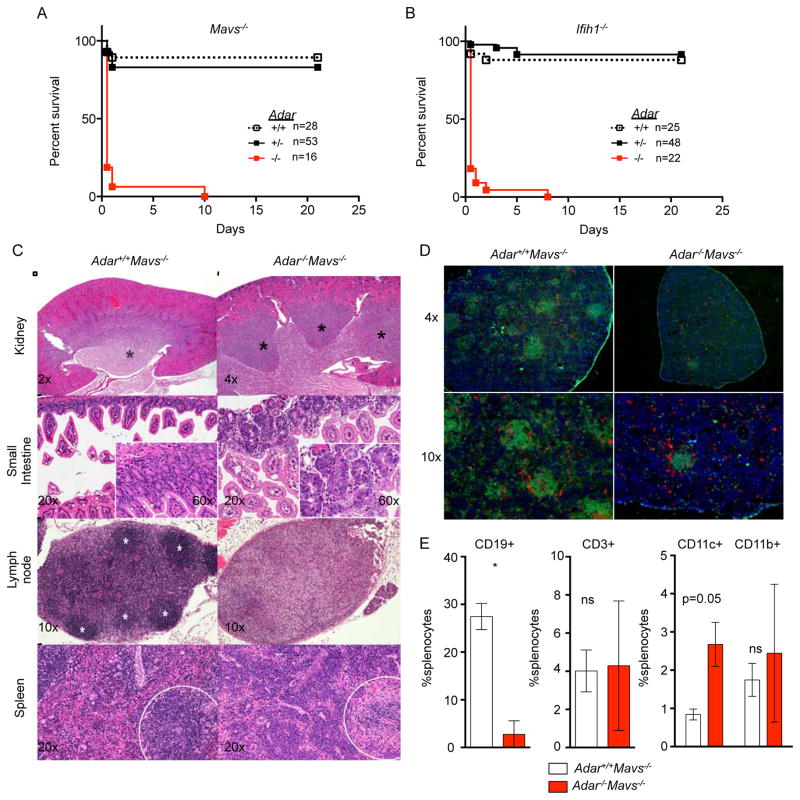
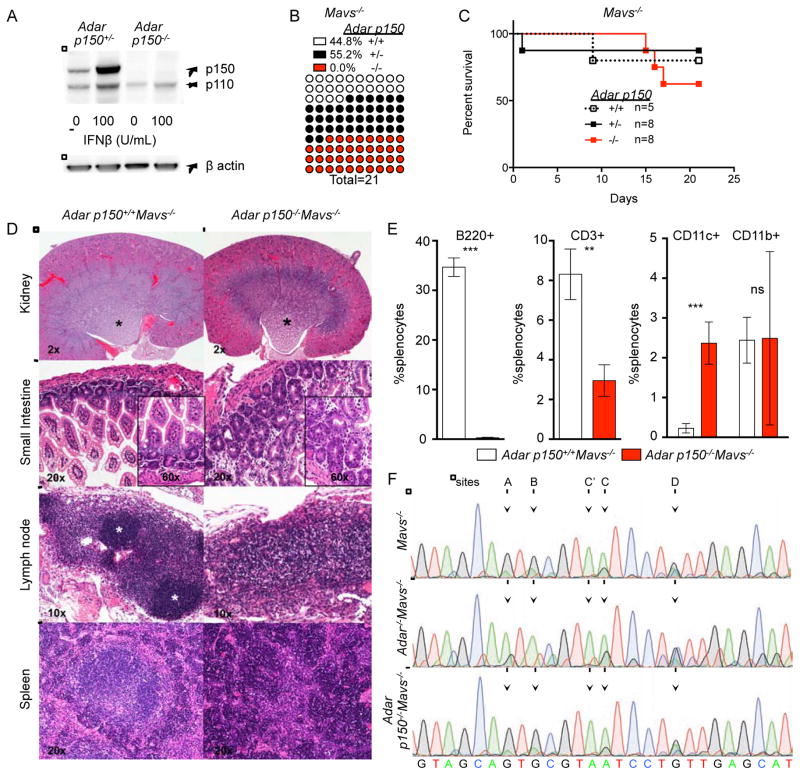
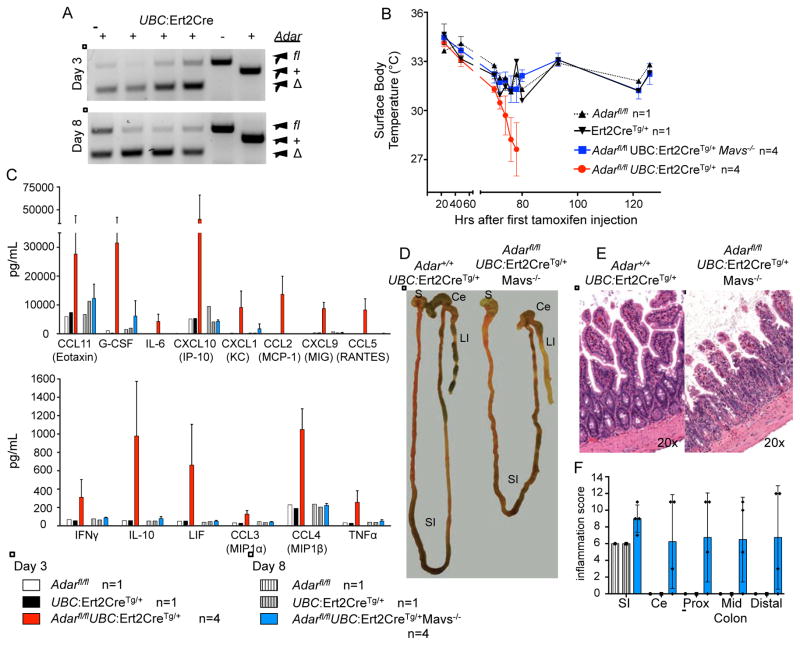
Mutations in ADAR, which encodes the ADAR1 RNA-editing enzyme, cause Aicardi-Goutières syndrome (AGS), a severe autoimmune disease associated with an aberrant type I interferon response. How ADAR1 prevents autoimmunity remains incompletely defined. Here, we demonstrate that ADAR1 is a specific and essential negative regulator of the MDA5-MAVS RNA sensing pathway. Moreover, we uncovered a MDA5-MAVS-independent function for ADAR1 in the development of multiple organs. We showed that the p150 isoform of ADAR1 uniquely regulated the MDA5 pathway, whereas both the p150 and p110 isoforms contributed to development. Abrupt deletion of ADAR1 in adult mice revealed that both of these functions were required throughout life. Our findings delineate genetically separable roles for both ADAR1 isoforms in vivo, with implications for the human diseases caused by ADAR mutations.


Figures

Figure 1
Figure 1. Rescue of Adar−/− mice to birth by Ifih1/Mda5 and MAVS deficiency
(A) Live births from Adar+/− intercross. (B) Live births from Adar+/−Tmem173−/− intercross. (C) Live births from Adar+/−Mavs−/− intercross. (D) Live births from Adar+/−Ifih1−/− intercross. (E) Live births from Adar+/−Ddx58+/− intercross. Percent rescue p>0.05 by Chi Square goodness-of-fit for Adar+/−Mavs−/− intercross and Adar+/−Ifih1−/− intercross.
Figure 2
Figure 2. MDA5 and MAVS deficiency reverse the IFN signature in Adar−/− embryos
Quantitative RT-PCR on a panel of 6 ISGs from whole E11.5 embryos. (A) Adar+/+ (white, n=3), Adar−/− (grey, n=3), Adar−/−Sting−/− (blue, n=4), Adar−/−Mavs−/− (red, n=5). Interferon signature assessed by Wilcoxon Signed Rank test compared to Adar+/+: Adar−/− p=0.03, Adar−/−Sting−/− p=0.03, Adar−/−Mavs−/− p=0.31. (B) Adar+/+Ifih1−/− (white, n=3), Adar−/−Ifih1−/− (red, n=3), Adar−+/+Ddx58+/+ (white stripes, n=3), Adar−−/−Ddx58+/+ (grey stripes, n=2), Adar+/+Ddx58−/− (light blue stripes, n=2), Adar−−/−Ddx58−/− (blue stripes, n=1). Interferon signature assessed by Wilcoxon Signed Rank test compare to Adar+/+controls, Adar−/−Ifih1−/− p=0.56, Adar−−/−Ddx58+/+ p=0.03, Adar+/+Ddx58−/− p=0.69, Adar−−/−Ddx58−/− p=0.03.
Figure 3
Figure 3. ADAR1 specifically regulates the MDA5 pathway in human cells
(A) Generation of ADAR-null HEK 293T cells by lentiCRISPR targeting. The CRISPR target site in exon 4 of the ADAR gene is indicated in blue, and the protospacer adjacent motif (PAM) is shown in green. The Cas9 cleavage site is indicated with an arrow. Deletions in the three ADAR alleles, each of which results in a frameshift, are shown by the red dashes. (B) Western blot of ADAR1 protein using lysates from control HEK 293T cells and an ADAR-lentiCRISPR-targeted clone of HEK 293T cells. (C) The indicated HEK 293T cells were transfected with 25ng ISRE-luciferase reporter plasmid, with or without the indicated amounts of plasmids encoding RIG-I or MDA5. Cells were analyzed for relative luciferase units 24 hours after transfection. Mean±SD; ***: p<0.0001 in Two way ANOVA test with Tukey’s multiple comparison. Data are representative of 4 independent experiments.
Figure 4
Figure 4. MAVS-dependent and MAVS-independent gene expression in Adar−/− embryos
RNA-Seq was performed on rRNA-depleted RNA from whole E11.5 embryos of the indicated genotypes. (A) Comparison of gene expression between Adar−/− (n=3) and Adar+/+ (n=3) embryos. Data are plotted as log2 fold change in gene expression on the y-axis, with normalized log2 counts per million (CPM) on the x-axis. Grey dots denote genes with insignificant differences in expression. Blue dots denote non-ISGs with differential expression (p≤0.01). Red dots indicate ISGs with differential expression (p≤0.01). (B) Comparison of gene expression between Adar−/−Mavs−/− (n=3) and Mavs−/− (n=3) embryos, using the same criteria as in (A). (C) Genes with differential expression (p≤0.01) in either pairwise comparison were plotted, with Adar−/− vs. Adar+/+ on the y-axis, and Adar−/−Mavs−/− vs. Mavs−/− on the x-axis. Blue and red genes are the same as (A) and (B). (D) Biological pathways enriched among the genes with dysregulated expression in both Adar−/− embryos and Adar−/−Mavs−/−embryos identified in (C). (E) Transcription factor binding sites enriched among the MAVS-independent differentially expressed genes from (C). For D and E, fold enrichment relative to the representation of these pathways in the genome is shown on the left y-axis and the blue bars. Significance of enrichment is indicated by hyper geometric p-value on the right y-axis and the black symnbols/line. Analysis was performed using FunRich software.
Figure 5
Figure 5. Postnatal mortality and severe developmental defects in Adar−/−Mavs−/− mice
(A) Postnatal survival curves for Adar−/−Mavs−/− mice. (B) Postnatal survival curves for Adar−/−Ifih1−/− mice. (C) Adar−/−; Mavs−/− mice have developmental defects of the kidney (top row; papillae marked with black asterisks), small intestine (second row), lymph node (third row; follicles marked with white asterisks), and spleen (fourth row; lymphoid regions enclosed by dashed circle). Images are hematoxylin and eosin with magnification indicated. (D) Immunofluorescence microscopy of splenic sections with anti-B220 (green), anti-CD8 and anti-CD4 (red), and DAPI (blue). (E) Analysis of splenocytes by flow cytometry shows severe B cell deficiency in Adar−/−; Mavs−/− mice. Mice in C-D were 20 days old. Mice in E were 15 days old. Mice in F were 13 days old.
Figure 6
Figure 6. Independent roles for ADAR1 isoforms in regulation of MDA5-MAVS and development
(A) Western blot of ADAR1 protein expression in p150+/− or p150−/− MEFs. (B) Live births for mice from the p150+/−Mavs−/− intercross. (C) Postnatal survival curves for mice from the p150+/−Mavs−/− intercross. (D) Hematoxylin and eosin-stained tissue sections of the indicated organs of p150−/−; Mavs−/− mice and controls are shown, with magnification indicated. (E) Analysis of splenocytes by flow cytometry shows severe B cell deficiency and an increase in CD11c+ myeloid cells in p150−/−Mavs−/− mice. Two sample t-test for p values p150+/+Mavs−/− n=3, p150−/−Mavs−/− n=3 *** p<0.002, **p=0.004. (F) Representative chromatograms of 2-HT2C receptor transcript editing in brains of 15–21 day old mice of the indicated genotypes. Mice in E and F were 21 days old. Mice in D were 15 days old.
Figure 7
Figure 7. ADAR1 regulates both the MDA5-MAVS pathway and tissue homeostasis in adults
Mice were treated with 2 mg tamoxifen i.p. daily for 3 days and observed for gross pathology. (A) Samples of the ear were genotyped for Adar deletion following tamoxifen treatment. (B) Surface body temperate readings for tamoxifen-treated mice from 20–120 hours after initial tamoxifen injection. (C) Serum cytokine levels determined from mice at Day 3 or Day 8. (D) Ex vivo dissection of the gastrointestinal tract at Day 8; Stomach (S), small intestine (SI), cecum (Ce) and large intestine (LI) are indicated. (E) Representative hematoxylin and eosin-stained ileum sections of tamoxifen-treated mice of the indicated genotypes at Day 8. Original magnification is indicated in the bottom right. (F) Histological scoring of inflammation in the gut at Day 8. SI=small intestine; CE=cecum; Prox=Proximal colon; Mid=Mid-colon. Mean inflammation score of Adarfl/flMavs−/− UBC:Ert2Cre+ intestines compared to either control is significant by one-way ANOVA, p=0.002.

References

    1. Ablasser A, Hemmerling I, Schmid-Burgk JL, Behrendt R, Roers A, Hornung V. TREX1 deficiency triggers cell-autonomous immunity in a cGAS-dependent manner. J Immunol. 2014;192:5993–5997. - PubMed
    1. Aicardi J, Goutieres F. A progressive familial encephalopathy in infancy with calcifications of the basal ganglia and chronic cerebrospinal fluid lymphocytosis. Ann Neurol. 1984;15:49–54. - PubMed
    1. Bahn JH, Ahn J, Lin X, Zhang Q, Lee JH, Civelek M, Xiao X. Genomic analysis of ADAR1 binding and its involvement in multiple RNA processing pathways. Nature communications. 2015;6:6355. - PMC - PubMed
    1. Bass BL. RNA editing by adenosine deaminases that act on RNA. Annu Rev Biochem. 2002;71:817–846. - PMC - PubMed
    1. Crow YJ, Chase DS, Lowenstein Schmidt J, Szynkiewicz M, Forte GM, Gornall HL, Oojageer A, Anderson B, Pizzino A, Helman G, et al. Characterization of human disease phenotypes associated with mutations in TREX1, RNASEH2A, RNASEH2B, RNASEH2C, SAMHD1, ADAR, and IFIH1. American journal of medical genetics Part A. 2015;167A:296–312. - PMC - PubMed

Publication types

MeSH terms

Supplementary concepts