. 2015 Nov 20;11(11):e1005264.
doi: 10.1371/journal.ppat.1005264. eCollection 2015 Nov.

Activation of Type I and III Interferon Response by Mitochondrial and Peroxisomal MAVS and Inhibition by Hepatitis C Virus

Affiliations

Activation of Type I and III Interferon Response by Mitochondrial and Peroxisomal MAVS and Inhibition by Hepatitis C Virus

Silke Bender et al. PLoS Pathog. .

Abstract

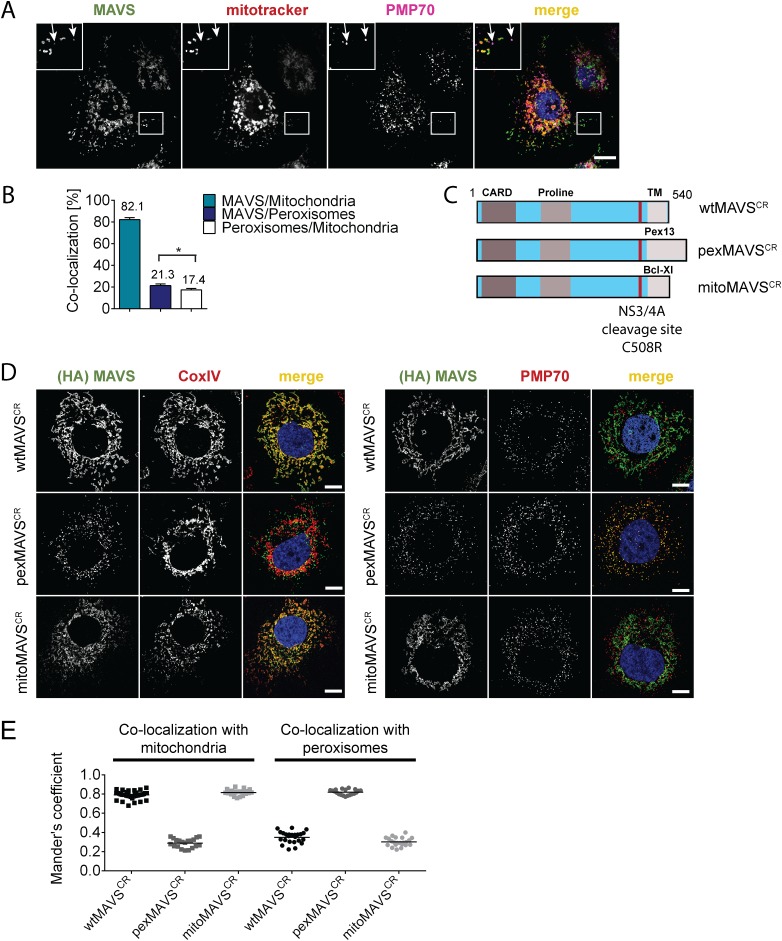
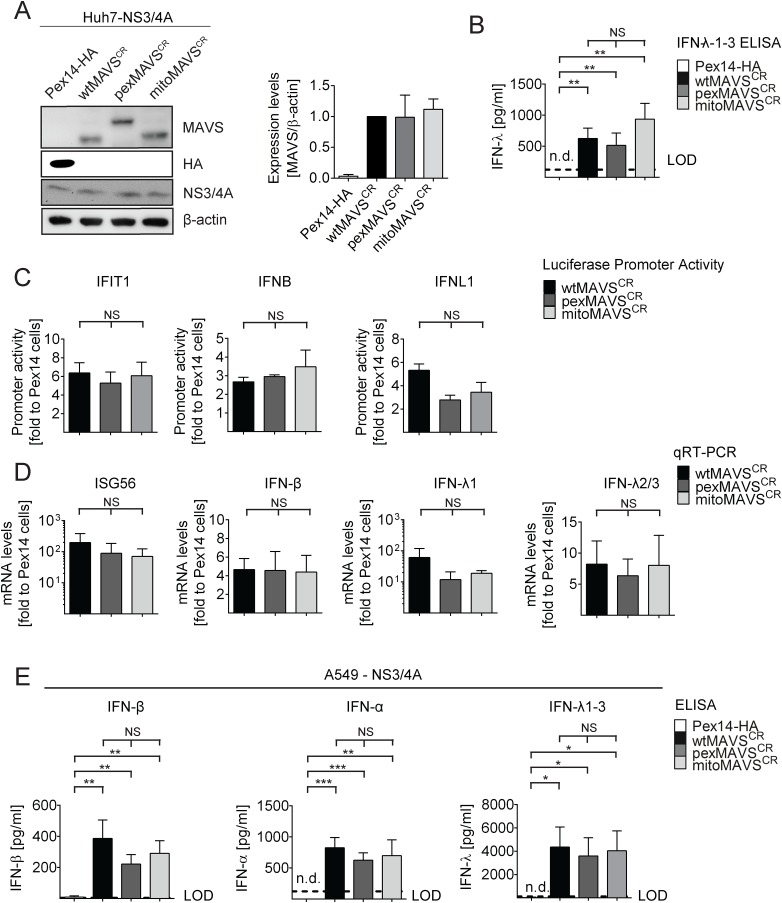
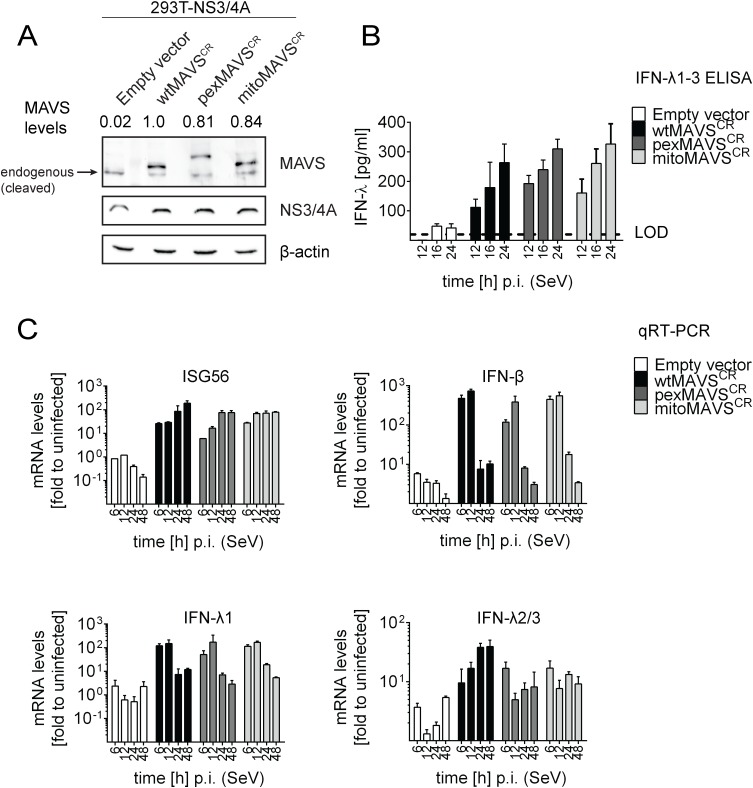
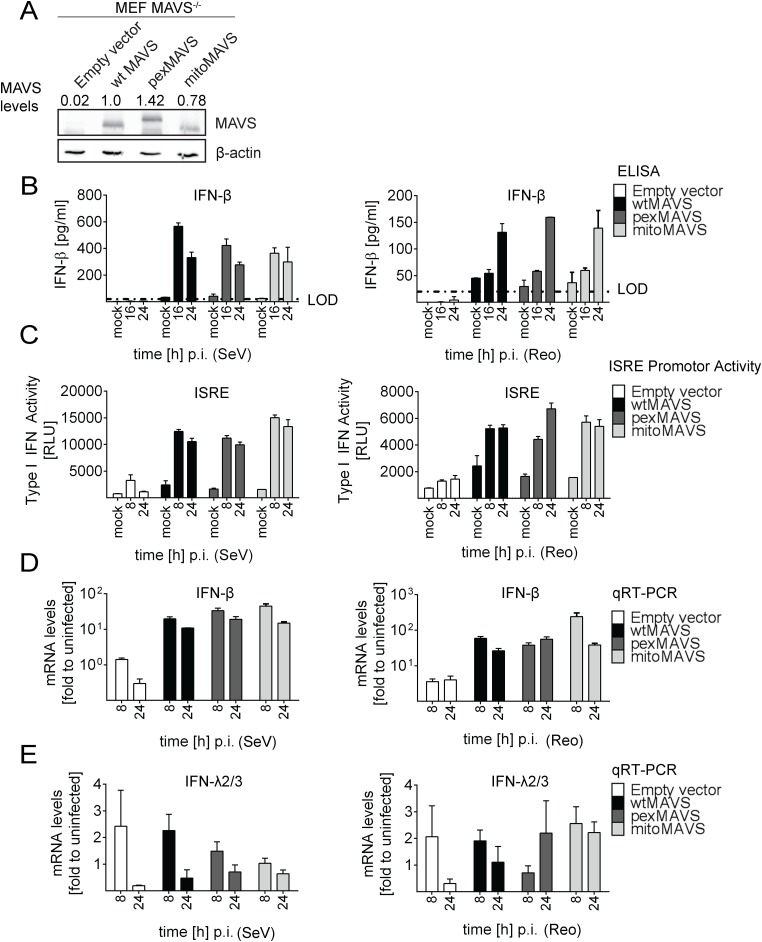
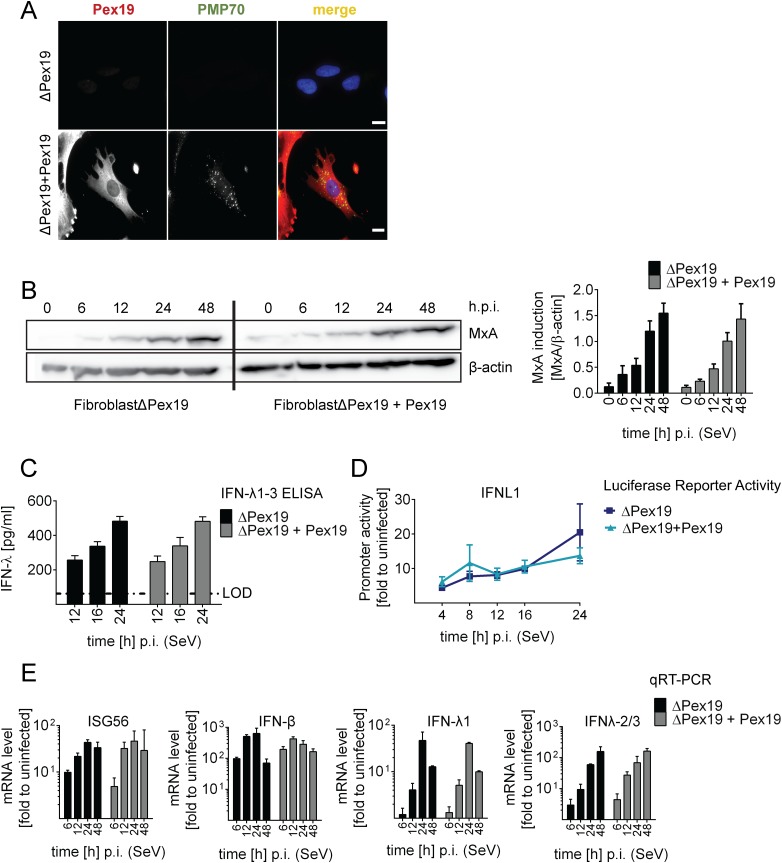
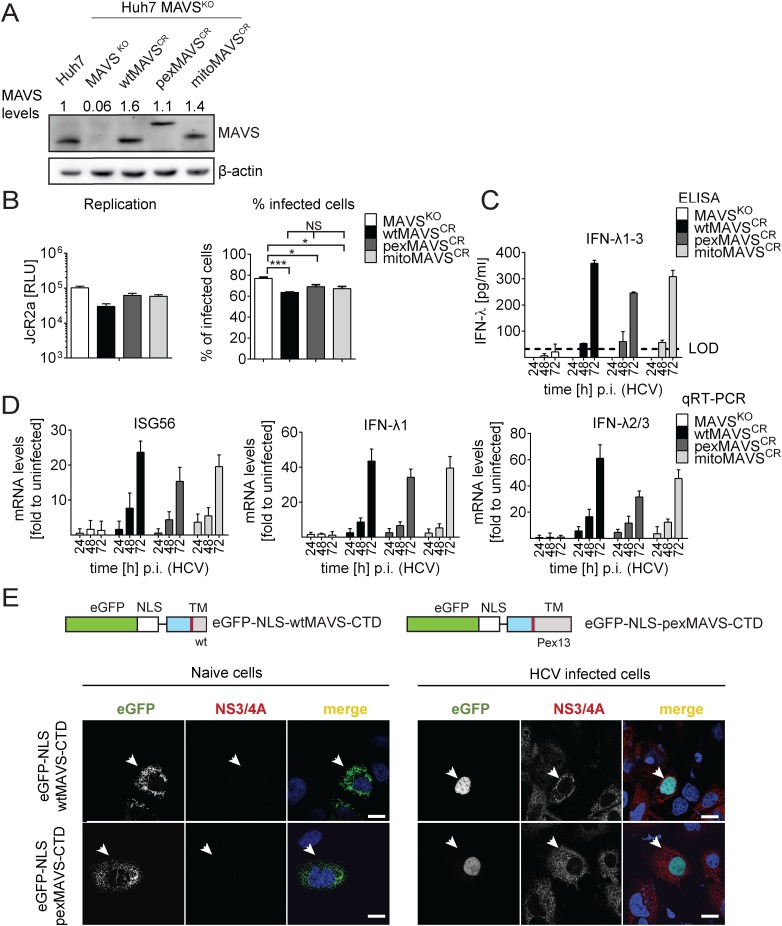
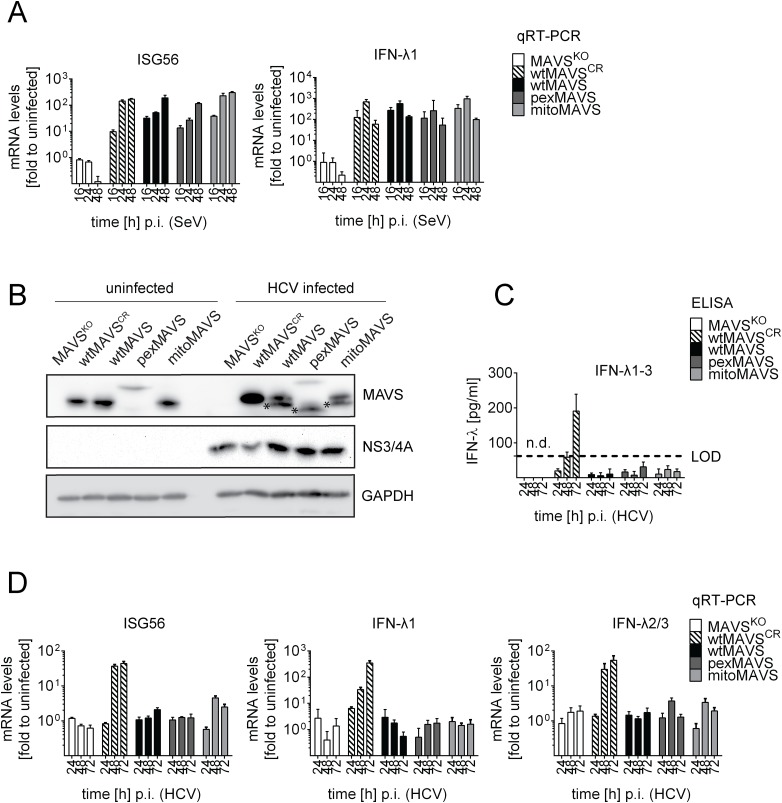
Sensing viruses by pattern recognition receptors (PRR) triggers the innate immune system of the host cell and activates immune signaling cascades such as the RIG-I/IRF3 pathway. Mitochondrial antiviral-signaling protein (MAVS, also known as IPS-1, Cardif, and VISA) is the crucial adaptor protein of this pathway localized on mitochondria, peroxisomes and mitochondria-associated membranes of the endoplasmic reticulum. Activation of MAVS leads to the production of type I and type III interferons (IFN) as well as IFN stimulated genes (ISGs). To refine the role of MAVS subcellular localization for the induction of type I and III IFN responses in hepatocytes and its counteraction by the hepatitis C virus (HCV), we generated various functional and genetic knock-out cell systems that were reconstituted to express mitochondrial (mito) or peroxisomal (pex) MAVS, exclusively. Upon infection with diverse RNA viruses we found that cells exclusively expressing pexMAVS mounted sustained expression of type I and III IFNs to levels comparable to cells exclusively expressing mitoMAVS. To determine whether viral counteraction of MAVS is affected by its subcellular localization we employed infection of cells with HCV, a major causative agent of chronic liver disease with a high propensity to establish persistence. This virus efficiently cleaves MAVS via a viral protease residing in its nonstructural protein 3 (NS3) and this strategy is thought to contribute to the high persistence of this virus. We found that both mito- and pexMAVS were efficiently cleaved by NS3 and this cleavage was required to suppress activation of the IFN response. Taken together, our findings indicate comparable activation of the IFN response by pex- and mitoMAVS in hepatocytes and efficient counteraction of both MAVS species by the HCV NS3 protease.


Conflict of interest statement

The authors have declared that no competing interests exist.

Figures

Fig 1
Fig 1. Subcellular localization of endogenous and engineered MAVS variants.
(A) Subcellular localization of MAVS in Huh7 cells was determined by immunofluorescence. White arrows indicate co-localization of MAVS (green) with the peroxisomal marker PMP70 (purple). Mitochondria were stained with mitotracker (red) while nuclei were stained with DAPI. Scale bar, 10 μm. (B) Quantification of subcellular localization of MAVS on mitochondria and peroxisomes as determined with the Mander’s overlap coefficient. In addition, co-localization of peroxisomes with mitochondria was determined. Bars indicate the standard error. *, P≤0.05. (C) Organelle-targeted MAVSCR (i.e. MAVS that is NS3/4A protease cleavage resistant) constructs were designed by replacing the transmembrane (TM)-domain (light grey) of wild type (wt) MAVS with either the TM-domain of Pex13 (pexMAVS) or Bcl-Xl (mitoMAVS). The HCV NS3/4A cleavage site was mutated to obtain a cleavage resistant (CR) MAVS protein (C508R). The MAVS coding sequence is indicated in light blue and includes the CARD as well as the proline-rich sequence (grey boxes). (D) Co-localization of MAVS variants with given marker proteins (red) was determined in Huh7-NS3/4A expressing cells transduced with wt-, pex- or mitoMAVSCR-HA (green) by using immunofluorescence. Scale bar, 20 μm. (E) The degree of co-localization was quantified by calculating the Mander’s overlap coefficient. Each dot represents a single cell; at least 20 cells were analyzed per condition.
Fig 2
Fig 2. Comparable activation of the IFN system by MAVS proteins localizing to peroxisomes or mitochondria in Huh7 and A549 cells.
(A) Huh7-NS3/4A expressing cells were transduced with non-cleavable wt-, pex- or mitoMAVSCR or with Pex14-HA that served as control. Expression levels of MAVSCR variants were determined by Western blot. The quantification in the right panel displays MAVS abundance, normalized to β-actin, relative to wtMAVSCR expression levels (set to 1). Mean values from three independent experiments are shown. (B-D) Activation of the IFN response by overexpression of MAVS variants. (B) Huh7 cell culture supernatants were collected and IFN-λ1–3 protein levels were measured by ELISA. The dashed line indicates the limit of detection (LOD). N.d., not detectable. (C) For reporter-based analyses, firefly luciferase reporter plasmids were co-transfected with a SV40-based Renilla luciferase plasmid to normalize for transfection efficiency. Values for each reporter were normalized to those obtained for Pex14-HA transduced cells (set to 1). (D) Quantification of mRNA amounts of ISG56 and indicated IFNs as determined by qRT-PCR. Values were normalized to those obtained for Pex14-HA transduced cells (set to 1). All data were normalized to GAPDH using the ΔΔct method (E) A549 NS3/4A-expressing cells were transduced with lentiviruses containing non-cleavable wt-, pex- or mitoMAVSCR as well as Pex14-HA that served as control. Cells were stimulated by overexpressing MAVS variants, cell culture supernatants were collected and IFN protein levels were measured by ELISA. The dashed line indicates the limit of detection (LOD). N.d., not detectable. Data represent the mean from four independent experiments. Bars indicate the standard error. *, P≤0.05; **, P≤0.005; ***, P≤0.0005; NS, not significant. N.d., not detectable.
Fig 3
Fig 3. Comparable activation of type I and III IFN response by peroxisomal or mitochondrial MAVS upon virus infection.
(A) Lysates of 293T cells stably expressing NS3/4A and various forms of non-cleavable MAVSCR or an empty vector were analyzed by Western blot. Numbers above each lane refer to MAVS expression levels normalized to β-actin and wtMAVSCR expression that was set to one. (B) Cells were infected with Sendai virus (SeV) with an MOI of 3. The amount of IFN-λ released at given time points into the cell culture supernatant was determined by ELISA. The dashed line represents the limit of detection (LOD). (C) Cells were infected with SeV and total RNA was extracted at time points specified in the bottom of each panel. mRNA amounts were quantified by qRT-PCR. All data were normalized to GAPDH using the ΔΔct method. A representative experiment of a total of three independent experiments is shown. Each value was measured in quadruplicates; mean values and standard errors are shown.
Fig 4
Fig 4. No difference in virus-induced activation of type I and III IFN response in MAVS-/- mouse cells expressing peroxisomal and mitochondrial MAVS.
(A) Mouse Embryonic Fibroblasts (MEFs) from MAVS-/- knockout mice were transduced with lentiviral expression constructs encoding wt-, pex- or mitoMAVS or with the empty control vector. Expression of MAVS variants was validated by Western blot. Numbers above each lane refer to the expression level of the respective MAVS variant after normalization to β-actin and wtMAVSCR that was set to one. (B, C) Amounts of IFN-β released from MAVS-reconstituted MEFs at different time points after virus infection into the culture supernatant and antiviral activity contained therein. (B) Cells were infected with SeV (MOI = 5) or Reo virus (MOI = 50) and IFN-β protein levels were quantified by ELISA. Dashed line represents the limit of detection (LOD). (C) Culture supernatants of MAVS-reconstituted MEFs harvested at different time points after SeV or Reo virus infection were inactivated by UV irradiation and used to inoculate L929 reporter cells. Eight hours later, cells were lysed and luciferase activity was determined. (D, E) Cells treated as described in panel (B) were harvested at given time points and amounts of IFN-β (D) or IFN-λ2/3 (E) mRNA were determined by qRT-PCR. All data were normalized to the housekeeping gene GAPDH and to the respective uninfected control (set to 1). Each figure in panels B-D shows a representative experiment of four independent repetitions, each conducted in technical triplicates. Mean values and standard errors are shown.
Fig 5
Fig 5. Activation of type I and III IFN response in peroxisome-deficient human cells.
(A) Deficiency of peroxisome formation of the human fibroblast cell line ΔPex19 that does not contain peroxisomes was rescued by stable expression of Pex19 (ΔPex19+Pex19) as determined by immunofluorescence for Pex19 (red) and PMP70 (peroxisome marker, green). Nuclei were counterstained with DAPI. Scale bar, 40 μm. (B-D) Both cell lines were infected with SeV (MOI = 3) and samples were collected at indicated times points. (B) Total protein lysates of infected cells were analyzed for MxA abundance by Western blot. MxA-specific signals were quantified by using the Lab Image ID software package and values were normalized to β-actin that served as loading control. Values correspond to the mean of four independent experiments and standard errors. (C) Cell culture supernatants were harvested at given time points after SeV infection and amounts of IFN-λ1–3 were measured by ELISA. The dashed line indicates the limit of detection (LOD). (D) Fibroblasts were transfected with an IFN-λ-firefly luciferase reporter construct and 24 hours later infected with SeV. Cells were harvested at time points specified in the bottom and firefly luciferase activity was measured. Values were normalized to transfection efficiency as determined with a co-transfected SV40-based Renilla luciferase plasmid and are expressed relative to uninfected control cells (set to 1). (E) Total RNA was prepared from SeV-infected cells at time points specified in the bottom of each panel and amounts of mRNAs given on the top of each panel were determined by qRT-PCR. All data were normalized to GAPDH and uninfected control cells (set to 1). Mean values of a representative experiment conducted with technical triplicates are shown. Bars indicate the standard error. All experiments were performed at least three times.
Fig 6
Fig 6. HCV activates type III IFN response via peroxisomal and mitochondrial MAVS to a comparable extent.
(A) Huh7 MAVSKO cell lines were generated using the CRISPR/Cas system. Cleavage resistant wt-, pex- and mitoMAVS were expressed in these cells by lentiviral transduction. Expression levels of the proteins were quantified by Western blot. Numbers above each lane refer to abundance of a given MAVS variant, normalized to β-actin and endogenous MAVS that was set to one. (B) Cell lines were infected with either the HCV reporter virus JcR2a (MOI = 1) or Jc1 (MOI = 1). Seventy two hours later HCV replication in JcR2a-infected cells was determined by luciferase assay whereas Jc1-infected cells were analyzed by NS5A-specific immunofluorescence. The percentage of infected cells was determined by counting at least 500 cells for each condition. (C) Cells were infected with the HCV isolate Jc1 (MOI = 5) and amounts of IFN-λ1–3 released into cell culture supernatants were determined by ELISA. The dashed line represents the limit of detection limit (LOD). N.d., not detectable. (D) Total RNA of infected cells was extracted and mRNA amounts of ISG56 and type III IFNs were determined by qRT-PCR. All data were normalized to GAPDH using the ΔΔct method and are expressed relative to uninfected control cells (set to 1). A representative experiment performed with technical triplicates is shown. Bars indicate the standard error. All experiments were conducted three times and with two additional Huh7 knockout cell clones. (E) Huh7 cells were infected with Jc1 (MOI = 5) and transfected 40 hours later with expression constructs encoding GFP-tagged CTD of wt- or pexMAVS (for construct design see Fig 2A). Note that HCV-mediated cleavage of the reporter results in nuclear accumulation of the eGFP signal. White arrow indicates an HCV infected cell. Scale bar, 20 μm.
Fig 7
Fig 7. Blunting of the interferon response upon HCV infection occurs independent from MAVS subcellular localization.
Huh7-MAVSKO cells were rescued with cleavable wt-, pex- or mitoMAVS or cleavage-resistant wtMAVSCR. (A) Cells were infected with SeV (MOI = 5) for periods specified in the bottom of each panel. Total RNA was isolated and amounts of ISG56 and IFN-λ1 mRNAs were determined by qRT-PCR. All data were normalized to GAPDH and uninfected control cells (set to 1). (B) Cells were infected with HCV and 48 hours later MAVS cleavage and HCV infection was determined by Western blot using antibodies specified in the right of each panel. Asterisks indicate cleavage products of MAVS variants. (C) Cell culture supernatants were harvested at given time points after HCV infection and amounts of IFN-λ1–3 were measured by ELISA. The dashed line indicates the limit of detection (LOD). (D) Amounts of ISG56 and IFN-λs mRNA were determined by qRT-PCR. Values were normalized to those obtained for uninfected cells. All data were normalized to GAPDH using the ΔΔct method.

References

    1. Pichlmair A, Schulz O, Tan CP, Naslund TI, Liljestrom P, Weber F, et al. RIG-I-mediated antiviral responses to single-stranded RNA bearing 5'-phosphates. Science. 2006;314(5801):997–1001. 10.1126/science.1132998 . - DOI - PubMed
    1. Yoneyama M, Kikuchi M, Natsukawa T, Shinobu N, Imaizumi T, Miyagishi M, et al. The RNA helicase RIG-I has an essential function in double-stranded RNA-induced innate antiviral responses. Nature immunology. 2004;5(7):730–7. 10.1038/ni1087 . - DOI - PubMed
    1. Kato H, Takeuchi O, Sato S, Yoneyama M, Yamamoto M, Matsui K, et al. Differential roles of MDA5 and RIG-I helicases in the recognition of RNA viruses. Nature. 2006;441(7089):101–5. 10.1038/nature04734 . - DOI - PubMed
    1. Sun L, Wu J, Du F, Chen X, Chen ZJ. Cyclic GMP-AMP synthase is a cytosolic DNA sensor that activates the type I interferon pathway. Science. 2013;339(6121):786–91. 10.1126/science.1232458 - DOI - PMC - PubMed
    1. Wu J, Sun L, Chen X, Du F, Shi H, Chen C, et al. Cyclic GMP-AMP is an endogenous second messenger in innate immune signaling by cytosolic DNA. Science. 2013;339(6121):826–30. 10.1126/science.1229963 - DOI - PMC - PubMed

Publication types