Comparative Study
. 2015 Nov 15;29(22):2391-404.
doi: 10.1101/gad.269050.115.

Alternate wiring of a KNOXI genetic network underlies differences in leaf development of A. thaliana and C. hirsuta

Affiliations
Comparative Study

Alternate wiring of a KNOXI genetic network underlies differences in leaf development of A. thaliana and C. hirsuta

Madlen I Rast-Somssich et al. Genes Dev. .

Erratum in

Abstract

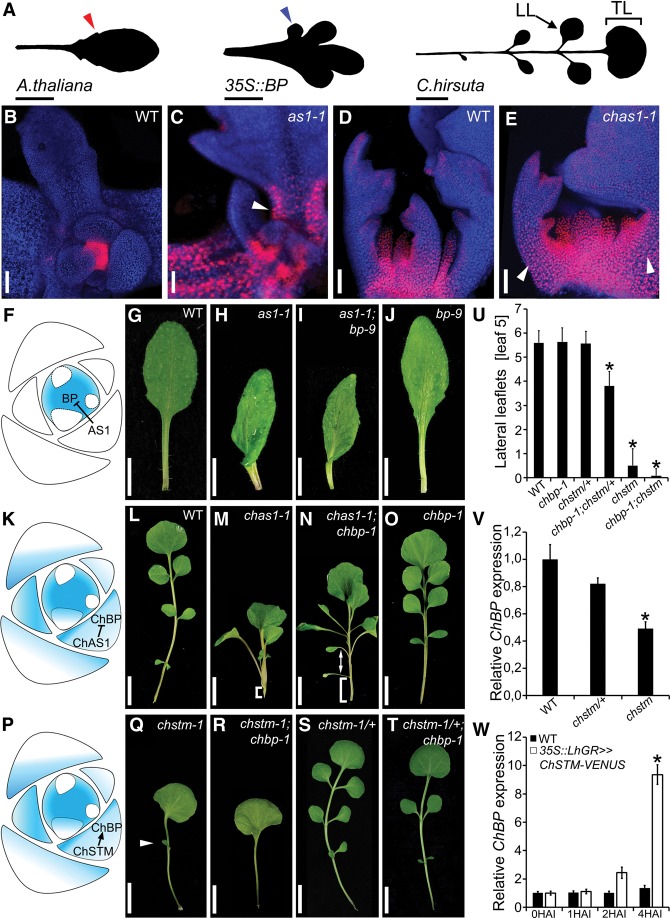
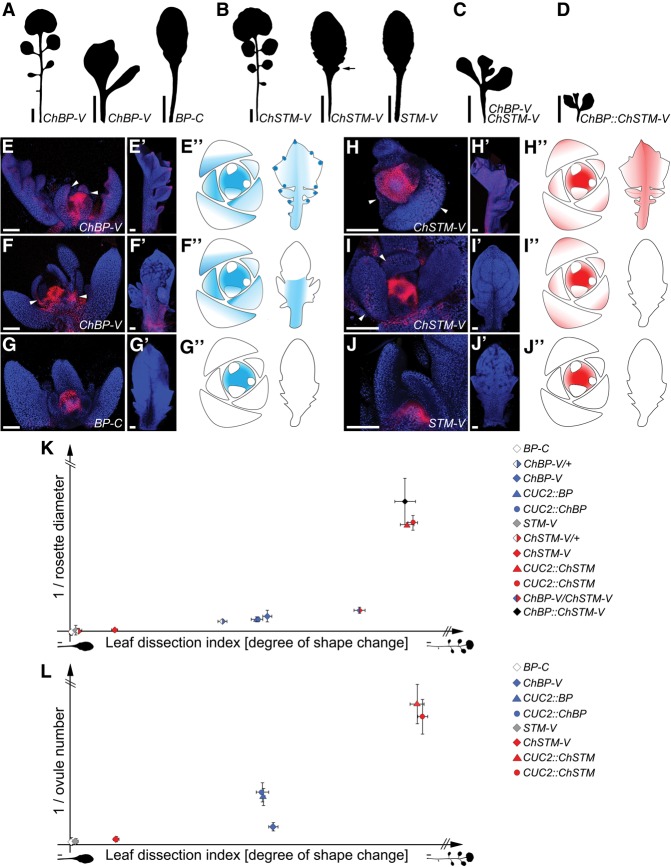
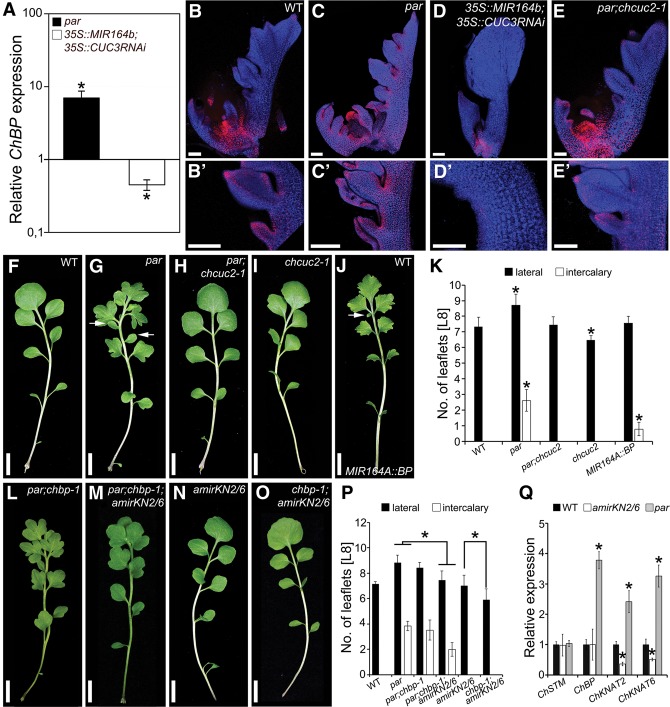
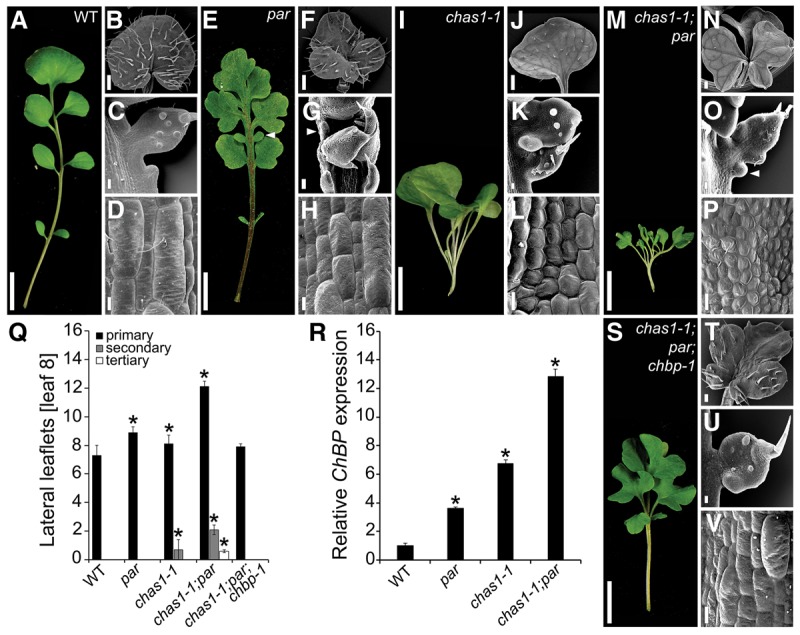
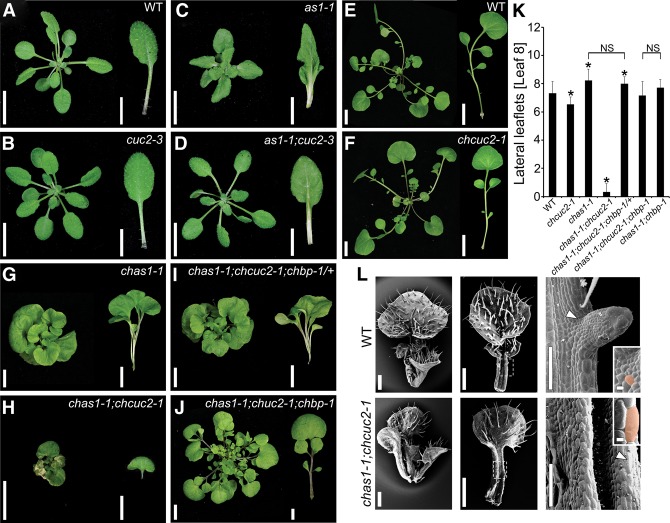
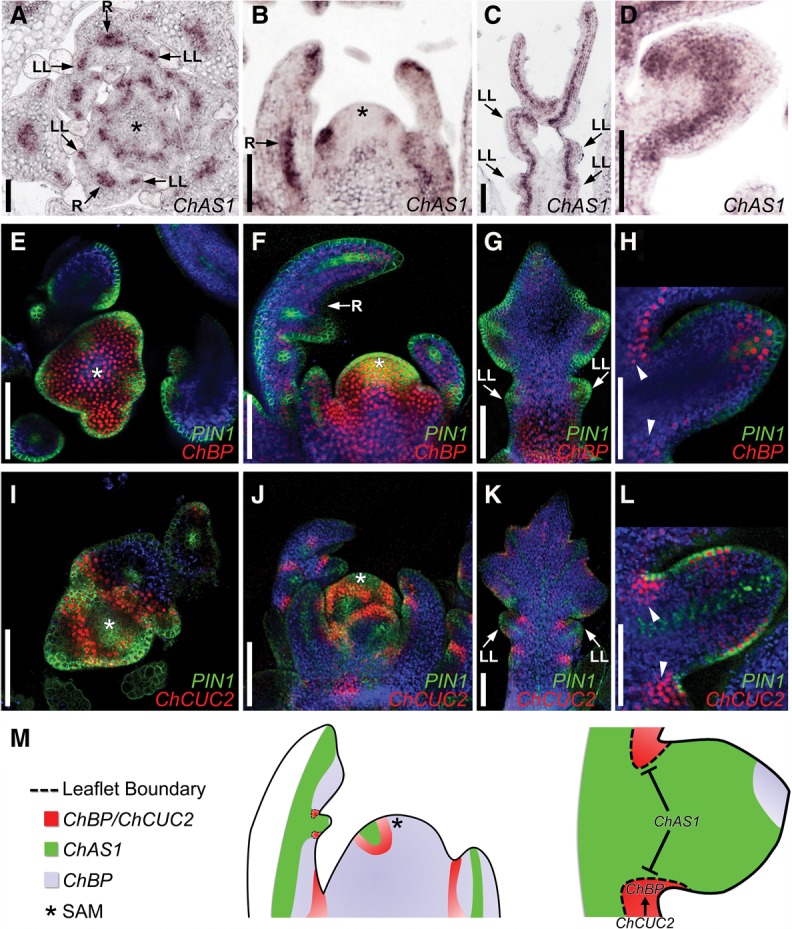
Two interrelated problems in biology are understanding the regulatory logic and predictability of morphological evolution. Here, we studied these problems by comparing Arabidopsis thaliana, which has simple leaves, and its relative, Cardamine hirsuta, which has dissected leaves comprising leaflets. By transferring genes between the two species, we provide evidence for an inverse relationship between the pleiotropy of SHOOTMERISTEMLESS (STM) and BREVIPEDICELLUS (BP) homeobox genes and their ability to modify leaf form. We further show that cis-regulatory divergence of BP results in two alternative configurations of the genetic networks controlling leaf development. In C. hirsuta, ChBP is repressed by the microRNA164A (MIR164A)/ChCUP-SHAPED COTYLEDON (ChCUC) module and ChASYMMETRIC LEAVES1 (ChAS1), thus creating cross-talk between MIR164A/CUC and AS1 that does not occur in A. thaliana. These different genetic architectures lead to divergent interactions of network components and growth regulation in each species. We suggest that certain regulatory genes with low pleiotropy are predisposed to readily integrate into or disengage from conserved genetic networks influencing organ geometry, thus rapidly altering their properties and contributing to morphological divergence.

Keywords: CUP-SHAPED COTYLEDON; Cardamine hirsuta; KNOXI genes; compound leaf; pleiotropy; regulatory evolution.


Figures

Figure 1.
Figure 1.
BREVIPEDICELLUS (BP) repression by AS1 is conserved between A. thaliana and C. hirsuta but has different phenotypic significance in the two species. (A) Leaf 5 silhouettes of A. thaliana wild type with marginal serrations (red arrowhead); plants expressing BP under the 35S promoter, causing the formation of marginal lobes (blue arrowhead); and C. hirsuta wild type with lateral (LL) and terminal (TL) leaflets. (BE) BP::VENUS (B,C) and ChBP::VENUS (D,E) expression (red) combined with chlorophyll autofluorescence (blue) in A. thaliana (B,C) and C. hirsuta (D,E) wild-type and as1-1 mutant plants. (C,E) Note the broadened BP/ChBP expression in as1-1 and chas1-1 mutants relative to the respective wild type (arrowheads). (F) Cartoon of an A. thaliana shoot apex: AS1 restricts BP expression from the leaf primordia. (GJ) Leaf 5 of A. thaliana wild type (G) and as1-1 (H), as1-1;bp-9 (I), and bp-9 (J) mutants. (K) Cartoon of a C. hirsuta shoot apex: Both ChAS1 and ChBP are expressed in leaves of C. hirsuta. Nevertheless, the repressive interaction is conserved. (LO) Leaf 5 of C. hirsuta wild type (L) and chas1-1 (M), chas1-1;chbp-1 (N), and chbp-1 (O) mutants. Note the suppression of petiole growth arrest (bracket in M,N) and leaflet positioning defects along the proximodistal axis (arrow in N) in chas1-1;chbp-1 compared with chas1-1 mutant leaves. (P) Cartoon of a C. hirsuta shoot apex: ChSTM promotes ChBP expression during leaflet development. (QT) Leaf 5 of C. hirsuta chstm-1 (Q; arrowhead indicates a rare leaflet), chstm-1;chbp-1 (R), chstm-1/+ (S), and chstm-1/+;chbp-1 (T) mutants. (U) Quantification of lateral leaflets on leaf 5 of plants with the indicated genotype. n ≥ 25. (V,W) ChBP transcript levels in C. hirsuta chstm-1/+ and chstm-1 mutants (V; 14 d after germination [14DAG]; n = 3) and upon induction of ChSTM misexpression with 10 mM DEX in 35S::LhGR>>ChSTM-VENUS C. hirsuta seedlings (W; 14DAG; n = 3). Error bars in UW indicate standard deviation. (HAI) Hours after induction; (asterisk) statistically significant difference from wild-type (U,V) or uninduced (W) samples (P ≤ 0.05, Student's t-test).
Figure 2.
Figure 2.
ChBP is less pleiotropic but more potent in altering A. thaliana leaf shape than ChSTM. (AD) Leaf 5 silhouettes of transgenic C. hirsuta (first silhouette in A,B) and A. thaliana (second and third silhouettes in A,B; C,–D) lines expressing ChBP::ChBP-VENUS (ChBP-V), BP::BP-CFP (BP-C), ChSTM::ChSTM-VENUS (ChSTM-V), STM::STM-VENUS (STM-V), both ChBP-V and ChSTM-V (C), or ChBP::ChSTM-VENUS (ChBP-ChSTM-V) (D). (EJ′′) Maximum intensity projections of confocal stacks showing reporter gene expression (red) combined with chlorophyll autofluorescence (blue) (EJ′) and cartoons of a shoot apex and a leaf (500 µm) summarizing the observed expression in transgenic C. hirsuta and A. thaliana lines (E′′–J′′). ChBP-V expression in C. hirsuta (EE′′) and A. thaliana (FF′′). (GG′′) BP-C expression in A. thaliana. ChSTM-V expression in C. hirsuta (HH′′) and A. thaliana (II′′). (JJ′′) STM-V expression in A. thaliana. Expression of ChBP-V and ChSTM-V is detectable in the A. thaliana SAM and leaves (arrowheads in E,F,H,I indicate leaf-specific expression), but ChSTM-V expression is not sustained after the leaf reaches a size of 400 µm (I′). (K,L) Diagrams depicting the degree of leaf shape change (calculated as leaf dissection index) versus the reduction in rosette diameter (K) or ovule number (L) caused by each transgene (Supplemental Fig. S3P–R). Genotypes are indicated in the key. To evaluate the effect of transgene zygosity in ChBP-V/ChSTM-V plants, the ChBP-V and ChSTM-V homozygous lines were backcrossed to wild type (ChBP-V/+ and ChSTM-V/+) and analyzed in the F1. Bars: AD, 1 cm; EJ′, 100 µm.
Figure 3.
Figure 3.
Ectopic ChBP expression contributes to the par mutant phenotype. (A) ChBP transcript level in par and 35S::MIR164b;CUC3RNAi (Nikovics et al. 2006) relative to wild-type (set as 1) leaves. (BE′) ChBP::VENUS expression (red) combined with chlorophyll autofluorescence (blue) in C. hirsuta wild-type (B,B′), par (C,C′), 35S::MIR164B;CUC3RNAi (D,D′), and par;chcuc2-1 (E,E′) leaves. Shown are maximum intensity projections of confocal stacks. (FJ) Leaf 8 of C. hirsuta wild-type (F), par (G), par;chcuc2-1 (H), and chcuc2-1 (I) plants and transgenic plants expressing MIR164A::BP (J). (K) Quantification of lateral and intercalary leaflet number on leaf 8 of plants with the indicated genotype. n ≥ 25. (LO) Leaf 8 of par;chbp-1 (L), par;chbp-1;amirKN2/6 (M), amirKN2/6 (N), and chbp-1;amirKN2/6 (O) plants. (P) Quantification of lateral and intercalary leaflet number on leaf 8 of plants with the indicated genotype. n ≥ 25. (Q) Relative expression of ChSTM, ChBP, ChKNAT2, and ChKNAT6 in par and amirKN2/6 leaves compared with wild type (n = 3). Bars: BE′, 100 μm; FO, 1 cm. Error bars in K, P, and Q indicate standard deviation. (Arrows) Intercalary leaflets; (asterisks) statistically significant difference from wild-type (K,Q) or the indicated genotype (P) (P ≤ 0.05, Student's t-test).
Figure 4.
Figure 4.
The ChAS1 and PAR/ChCUC pathways converge on ChBP regulation. (AP) C. hirsuta wild-type (AD), par (EH), chas1-1 (IL), and chas1-1;par (MP). For each genotype, rosette leaf 5 (A,E,I,M) and scanning electron micrographs of the terminal leaflet (B,F,J,N), lateral leaflet (C,G,K,O), and epidermal cells on the adaxial surface of the leaf petiole (D,H,L,P) are shown. (Q) Quantification of lateral leaflet number (primary, secondary, and tertiary) on leaf 8 of plants with the indicated genotype. n ≥ 15. (R) ChBP transcript level in C. hirsuta wild-type and par, chas1-1, and chas1-1;par. n = 3. (SV) Rosette leaf 5 (S), terminal leaflet (T), lateral leaflet (U), and leaf petiole adaxial epidermal cells (V) of the chas1-1;par;chbp-1 mutant. Bars: A,E,I,M,S, 1 cm; B,F,J,N,T, 500 µm; C,G,K,O,U, 100 µm; D,H,L,P,V, 20 µm. Error bars in Q and R indicate standard deviation. The asterisks in Q and R indicate statistically significant difference from wild type (P ≤ 0.05, Student's t-test).
Figure 5.
Figure 5.
Genetic interactions between AS1 and CUC2 in A. thaliana and C. hirsuta. (AD) Rosettes and leaf 5 of A. thaliana wild-type (A) and cuc2-3 (B), as1-1 (C), and as1-1;cuc2-3 (D) mutant plants. (EJ) Rosettes and leaf 5 of C. hirsuta wild-type (E) and chcuc2-1 (F), chas1-1 (G), chas1-1;chcuc2-1 (H), chas1-1;chcuc2-1;chbp-1/+ (I), and chas1-1;chcuc2-1;chbp-1 (J) mutant plants. (K) Quantification of lateral leaflet number on leaf 8 of plants with the indicated genotype. Asterisks indicate significant differences from wild type. n ≥ 15. (L) Scanning electron micrographs of a vegetative shoot, the fifth developing rosette leaf (1000 µm), and the leaf margin of wild type (top panel) and chas1-1;chcuc2-1 mutants (bottom panel). The insets show typical cells in the boundary (wild type; arrowhead) or marginal (as1-1;chcuc2-1; arrowhead) region, indicated in orange. Bars: AJ, 1 cm; L, 100 µm. Error bars in K indicate standard deviation. The asterisks in K indicate significant difference from wild type (P ≤ 0.05, Student's t-test). (NS) No significant difference.
Figure 6.
Figure 6.
ChCUC and ChAS1 define boundary domains of ChBP expression. (AD) ChAS1 expression in the C. hirsuta SAM and leaves analyzed by RNA in situ hybridization. ChBP::VENUS; PIN1::PIN1-GFP expression (EH) and ChCUC2g-VENUS; PIN1::PIN1-GFP (IL) in the C. hirsuta SAM and young leaves. (Red) Venus fluorescence; (green) GFP fluorescence; (blue) chlorophyll autofluorescence. Shown are transverse (A,E,I) and longitudinal (B,F,J) sections through the SAM; leaf 5 at a length of 750 µm (C,G,K); and a close-up of developing lateral leaflets (D,H,L). (M) Cartoon summarizing the observed ChAS1, ChBP, and ChCUC2 expression patterns. In leaf primordia, ChBP is expressed in the adaxial side and at the margin of the rachis (F,G) as well as at the tip of developing leaflets (H). (H,L) This expression pattern is near complementary to that of ChAS1 and overlaps with that of ChCUC2 in the leaf rachis margin at leaflet boundaries (arrowheads). This results in the formation of boundary domains (outlined with dotted lines) that are highly sensitive to ChBP dose and required to promote leaf growth. Bars, 100 µm. (R) Leaf rachis; (LL) lateral leaflet. Asterisks mark the SAM.

References

    1. Aguilar-Martinez JA, Uchida N, Townsley B, West DA, Yanez A, Lynn N, Kimura S, Sinha N. 2015. Transcriptional, posttranscriptional, and posttranslational regulation of SHOOT MERISTEMLESS gene expression in Arabidopsis determines gene function in the shoot apex. Plant Physiol 167: 424–442. - PMC - PubMed
    1. Aida M, Ishida T, Fukaki H, Fujisawa H, Tasaka M. 1997. Genes involved in organ separation in Arabidopsis: an analysis of the cup-shaped cotyledon mutant. Plant Cell 9: 841–857. - PMC - PubMed
    1. Arnoult L, Su KF, Manoel D, Minervino C, Magrina J, Gompel N, Prud'homme B. 2013. Emergence and diversification of fly pigmentation through evolution of a gene regulatory module. Science 339: 1423–1426. - PubMed
    1. Arthur W. 2002. The emerging conceptual framework of evolutionary developmental biology. Nature 415: 757–764. - PubMed
    1. Arthur W. 2004. Biased embryos and evolution. University Press, Cambridge, UK.

Publication types

MeSH terms

LinkOut - more resources