. 2016 Mar;11(1):168-181.
doi: 10.1007/s11481-015-9643-8. Epub 2015 Nov 20.

Evidence for Epigenetic Regulation of Pro-Inflammatory Cytokines, Interleukin-12 and Interferon Gamma, in Peripheral Blood Mononuclear Cells from PTSD Patients

Affiliations

Evidence for Epigenetic Regulation of Pro-Inflammatory Cytokines, Interleukin-12 and Interferon Gamma, in Peripheral Blood Mononuclear Cells from PTSD Patients

Marpe Bam et al. J Neuroimmune Pharmacol. 2016 Mar.

Abstract

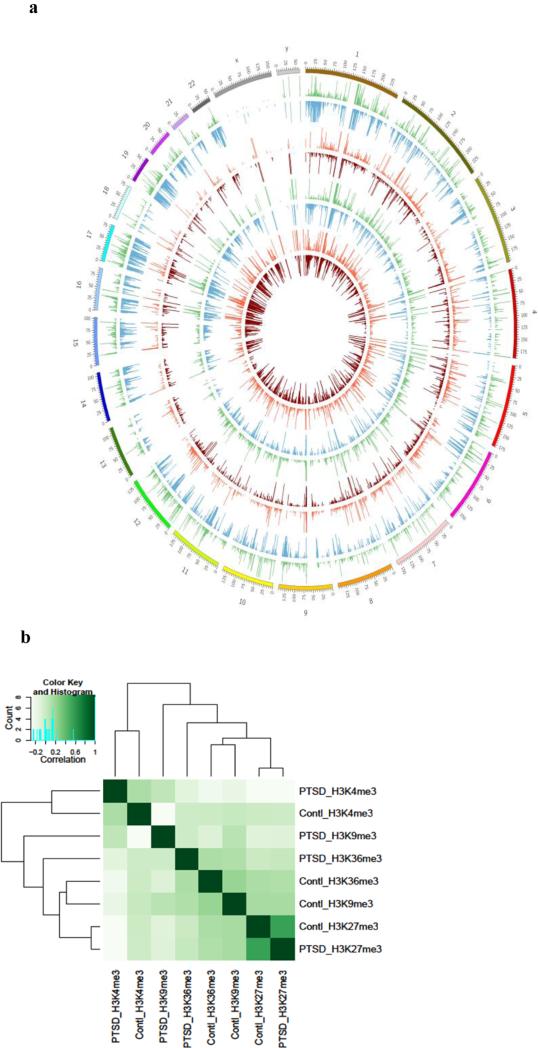
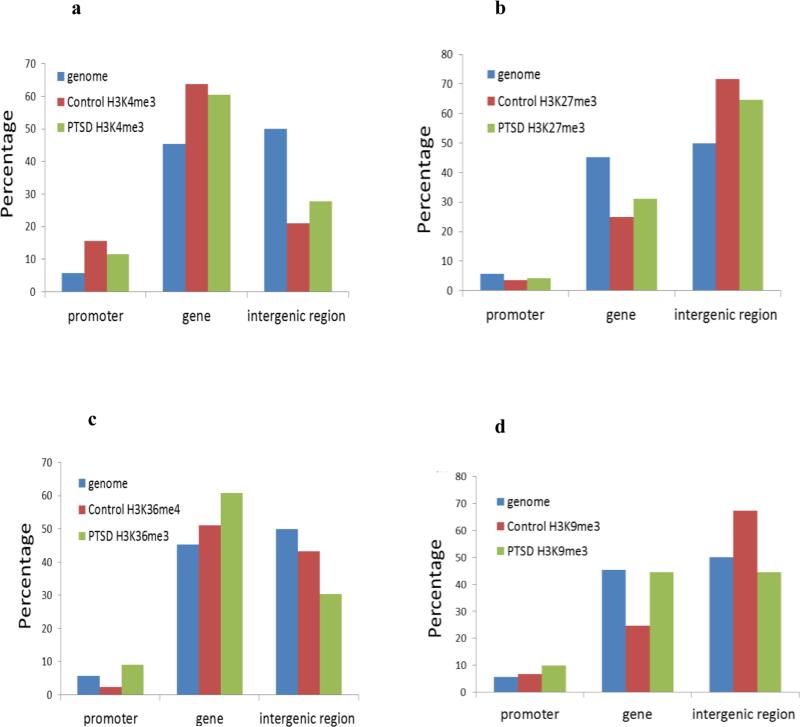
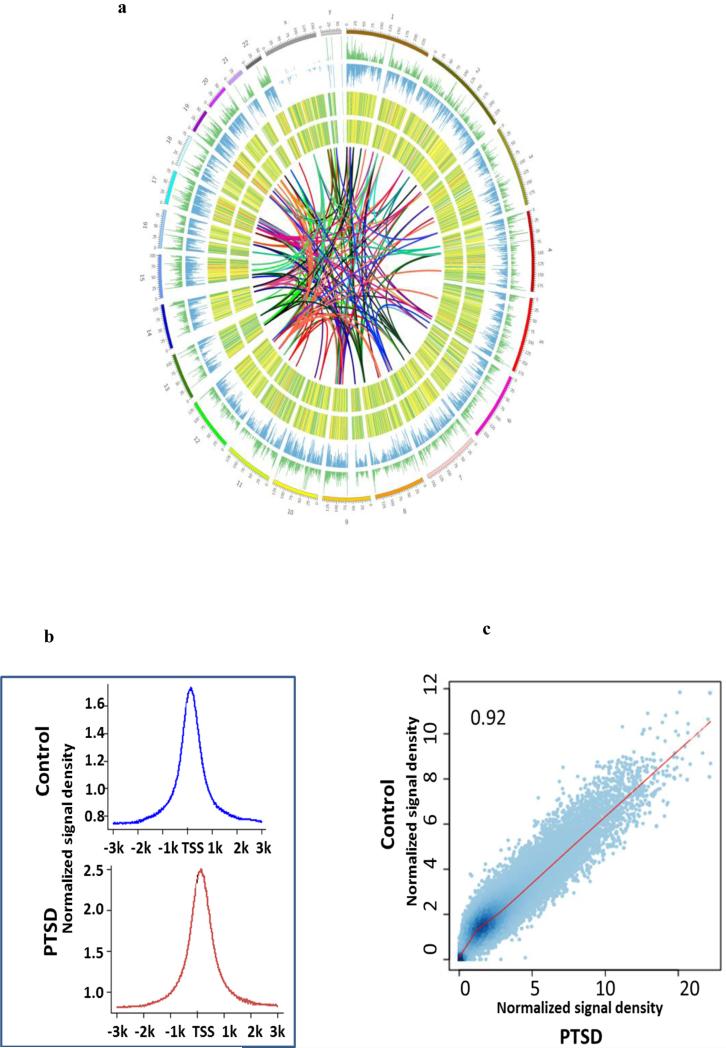
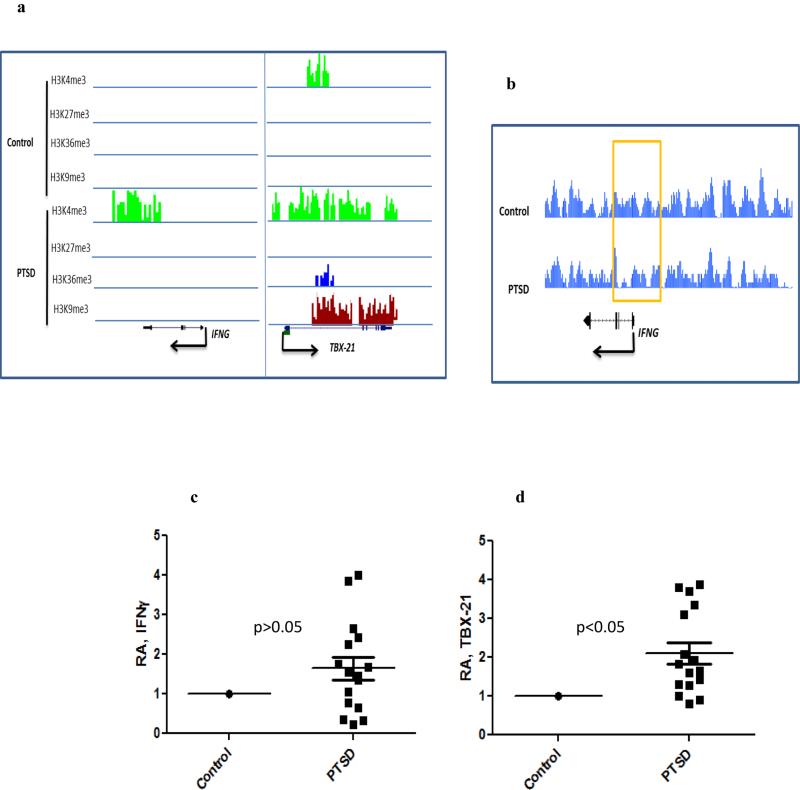
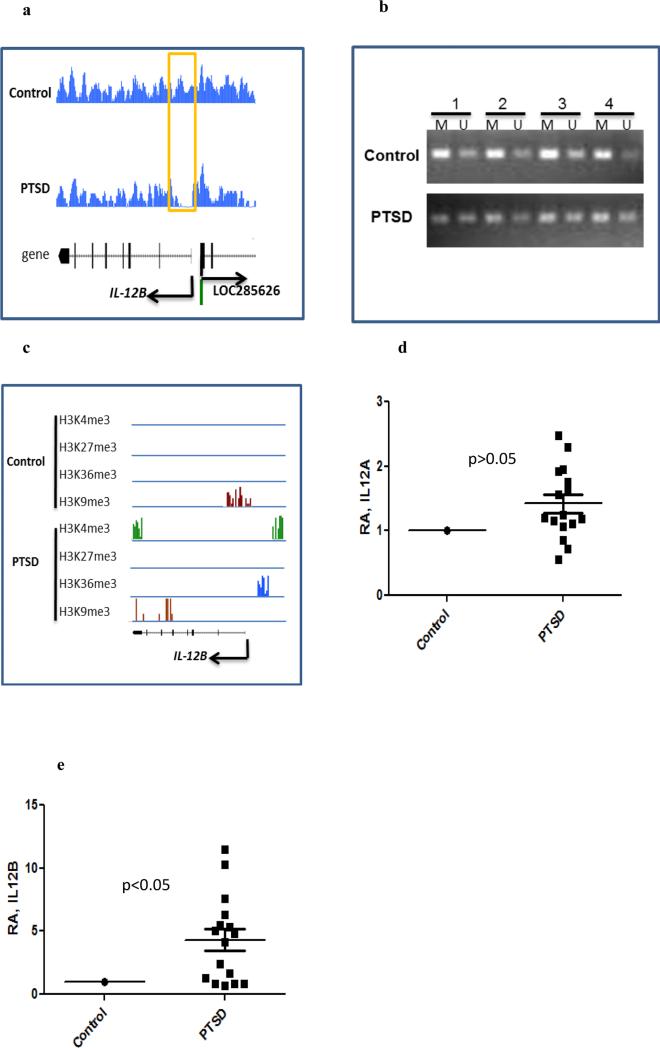
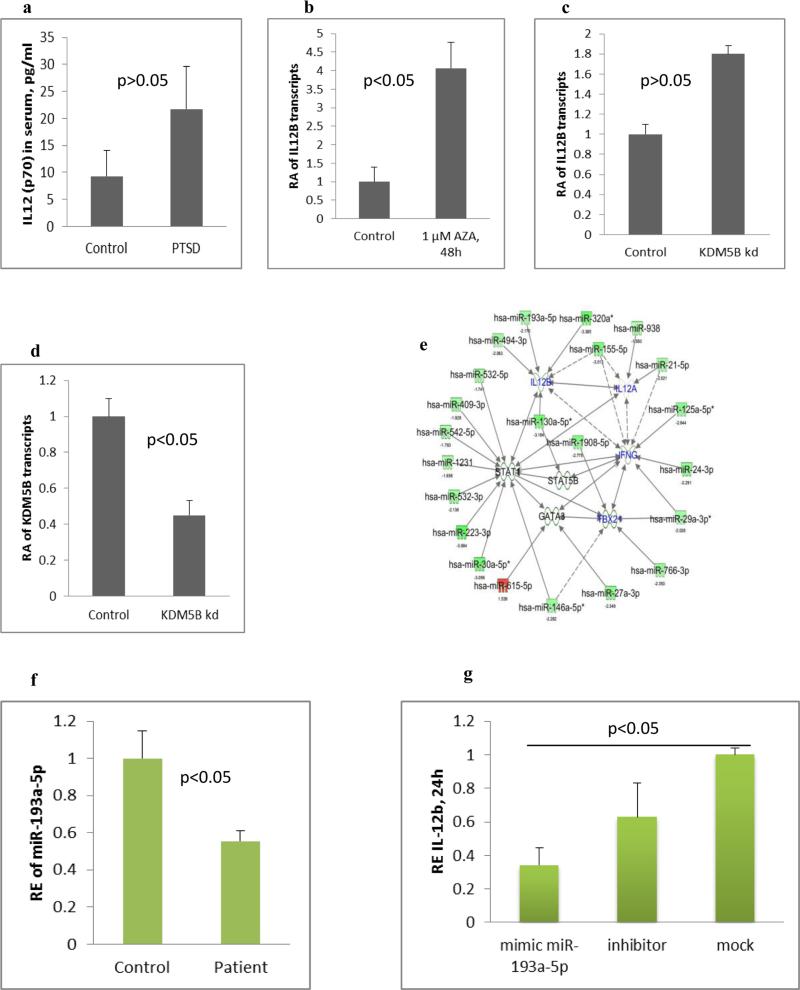
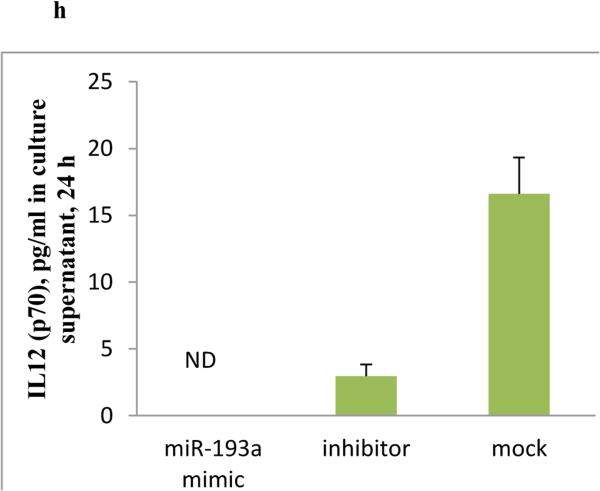
While Post Traumatic Stress Disorder (PTSD) is associated with immune dysfunction, the underlying mechanisms remain unclear. Studies suggest a role for involvement of epigenetic mechanisms and microRNAs (miRNAs). Here, we examined genome-wide histone and DNA methylation in the peripheral blood mononuclear cells (PBMCs) in PTSD. We noted significant differences in histone H3 trimethylation at K4, K9, K27 and K36 sites in PTSD when compared to control. While overall DNA methylation level did not differ significantly between control and PTSD, the promoters of several individual genes (e.g., Interferon gamma (IFNG) and Interleukin (IL)-12B) were differentially methylated. ChIP-seq data revealed that the promoter of IFNG and TBX-21 was associated with the activation marker H3K4me3 in PTSD. The transcript levels of both IFNG and TBX-21 were higher in PTSD correlating well with the altered methylation patterns. Furthermore, PTSD patients showed increased expression of IL-12 in their PBMCs. Analysis of both histone and DNA methylation markers suggested that the expression of IL-12 was also possibly activated through epigenetic modification. Knockdown of lysine (K)-specific demethylase 5B (KDM5B), or inhibition of DNA (Cytosine-5-)-methyltransferase 1 (DNMT1) caused up-regulation of IL-12. Furthermore, the expression of these cytokines was also regulated by miRNAs. Our miRNA microarray identified many downregulated miRNAs in PTSD that are predicted to target IFNG and IL-12. Consequently, we showed that up-regulation of hsa-miR-193a-5p could decrease the expression of IL-12. Overall, the current study demonstrated that the elevated expression of pro-inflammatory cytokines in PTSD patients might be regulated by multiple epigenetic mechanisms and miRNAs.

Keywords: DNA methylation; Histone modification; IL-12; Inflammation; Post-traumatic stress disorder; miRNA.


Figures

Fig. 1
Fig. 1. Genome-wide histone methylation in PBMCs
PBMCs from a control and a PTSD patient were isolated and histone methylation was examined by ChIP-seq as described in Methods. a) Circos plot showing histone trimethylations in the 23 chromosomes in control and PTSD. Starting from the outermost circle, the circles represent H3K4me3, H3K36me3, H3K27me3 and H3K9me3, respectively, in control and PTSD. b) The heat map of overall correlation of histone markers.
Fig. 2
Fig. 2. Distribution of histone methylation signal among genomic features
PBMCs from control and PTSD patients were isolated as described in Fig. 1. The percentages of histone methylation signal located in the promoter region (3kb upstream of TSS), gene body (intron and exon) and intergenic region are represented. The percentage of genomic sequence of these 3 regions is also shown. a) H3K4me3, b) H3K27me3, c) H3K36me3 and d) H3K9me3.
Fig. 3
Fig. 3. Genome-wide DNA methylation pattern in PBMCs
Genomic DNA was isolated from PBMCs of a control and a PTSD patient. DNA methylation was examined by MeDIP-seq. a) Circos plot showing DNA methylation observed in the 23 chromosomes with controls depicted in the outer circle and PTSD patient in the inner circle. The colored lines connect location of miRNAs in different chromosomes and the location of the predicted or known targets of the miRNAs. b) The relative enrichment profile of DNA methylation signal near the TSS. c) Correlation of DNA methylation signal within 1kb of TSS between control and PTSD sample.
Fig. 4
Fig. 4. Elevated expressions of IFNG and TBX-21 in PBMCs from PTSD patients
PBMCs from control and PTSD patients were isolated as described in Fig 1. a) Differentially associated histone methylation marker in IFNG and TBX-21. b) DNA methylation level within the promoter region of IFNG. c, d) Relative abundance (expressed as fold change) of IFNG and TBX-21 transcripts in PBMCs from controls (n=17) and PTSD patients (n=16) as determined by real time PCR, respectively. Each square in the PTSD group represents one human subject. Level in the control was set as 1.
Fig. 5
Fig. 5. Elevated expression of IL-12 in PBMCs from PTSD patients
PBMCs from control and PTSD patients were isolated as described in Fig 1. a) DNA methylation in the promoter region of IL-12B. b) Results of DNA methylation specific PCR from representative controls and PTSD patients (M: methylated DNA, U: unmethylated DNA). c) Associated histone methylation markers in IL-12B gene. d, e) Relative abundance (expressed as fold change) of IL-12A and IL-12B transcripts in PBMCs from controls (n=17) and PTSD patients (n=16) as determined by real time PCR, respectively. Each square in the PTSD group represents one human subject. Level in the control was set as 1.
Fig. 6
Fig. 6. IL-12B expression is influenced by multiple epigenetic mechanisms and miRNAs
a) IL12 (p70) level in serum of control and PTSD subjects as analyzed by Bioplex assay. For the in vitro studies, THP-1 cells were treated with 5-AZA @1μM concentration in one type of experiment, and transfected with siRNA for KDM5B in another, followed by quantification of IL-12B transcript by real time PCR. b) Transcript level of IL-12B after treatment with 5-AZA for 48 h. c) Transcript level of IL-12B after knockdown of KDM5B. d) Transcript level of KDM5B after it was knocked down by siRNA. e) MiRNA-gene interactive network generated in IPA for the dysregulated miRNAs and some of the select targets. Green indicates down regulated miRNAs and red is for up regulated. The solid arrows indicate direct interaction and broken for indirect. Subsequently, hsa-miR-193a-5p was upregulated in THP-1 cells by transfection with its pre-miR as described in methods to see its effect on IL-12 expression. f) Level of hsa-miR-193a-5p in the PBMCs of PTSD detected by qRT-PCR (control 17 and PTSD 16 subjects). g) Level of IL-12B transcripts in the PBMCs from a healthy control after transfection with pre-miR-193a-5p or its inhibitor. h) IL-12 (p70) detected by ELISA in the culture supernatant after transfection of PBMCs from a healthy control with pre-miR-193a-5p. (RA: relative abundance, RE: relative expression).

References

    1. Ambros V. The functions of animal microRNAs. Nature. 2004 Sep 16;431(7006):350–5. doi:10.1038/nature02871. - PubMed
    1. Bannister AJ, Schneider R, Myers FA, Thorne AW, Crane-Robinson C, Kouzarides T. Spatial distribution of di- and tri-methyl lysine 36 of histone H3 at active genes. J Biol Chem. 2005;280:17732–17736. doi:10.1074/jbc.M500796200. - PubMed
    1. Bartel DP. MicroRNAs: genomics, biogenesis, mechanism, and function. Cell. 2004;116(2):281–97. doi:10.1016/S0092-8674(04)00045-5. - PubMed
    1. Bernstein BE, Mikkelsen TS, Xie X, Kamal M, Huebert DJ, Cuff J, Fry B, Meissner A, Wernig M, Plath K, Jaenisch R, Wagschal A, Feil R, Schreiber SL, Lander ES. A bivalent chromatin structure marks key developmental genes in embryonic stem cells. Cell. 2006;125:315–326. doi:10.1016/j.cell.2006.02.041. - PubMed
    1. Blankenberg D, Von Kuster G, Coraor N, Ananda G, Lazarus R, Mangan M, Nekrutenko A, Taylor J. Galaxy: a web-based genome analysis tool for experimentalists. Curr Protoc Mol Biol. 2010;10:11–21. Chapter 19: Unit 19. - PMC - PubMed

Publication types

MeSH terms