

LocusExplorer: a user-friendly tool for integrated visualization of human genetic association data and biological annotations
- PMID: 26589274
- PMCID: PMC5939893
- DOI: 10.1093/bioinformatics/btv690
LocusExplorer: a user-friendly tool for integrated visualization of human genetic association data and biological annotations
Abstract
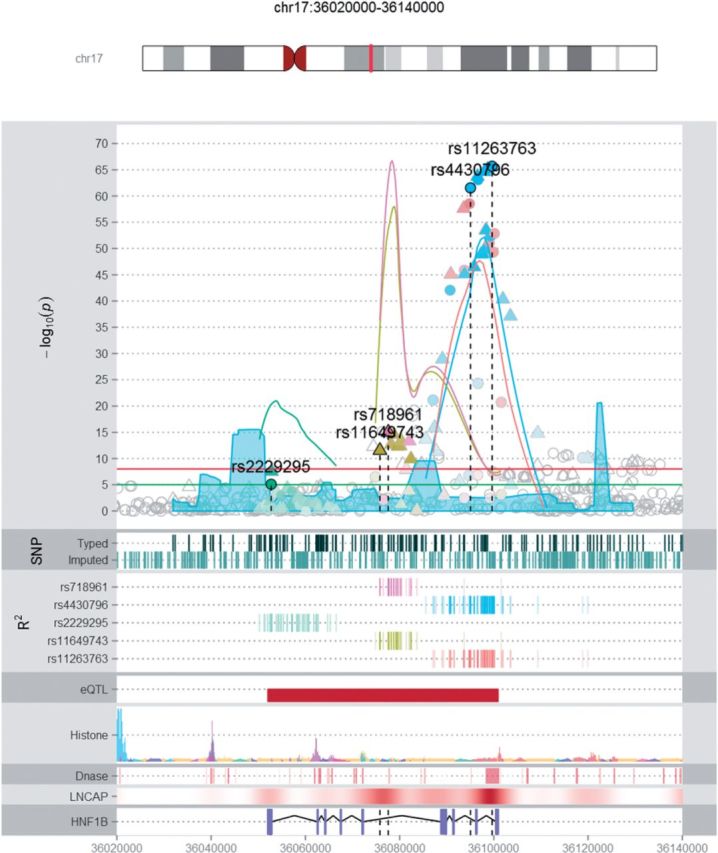
: In this article, we present LocusExplorer, a data visualization and exploration tool for genetic association data. LocusExplorer is written in R using the Shiny library, providing access to powerful R-based functions through a simple user interface. LocusExplorer allows users to simultaneously display genetic, statistical and biological data for humans in a single image and allows dynamic zooming and customization of the plot features. Publication quality plots may then be produced in a variety of file formats.
Availability and implementation: LocusExplorer is open source and runs through R and a web browser. It is available at www.oncogenetics.icr.ac.uk/LocusExplorer/ or can be installed locally and the source code accessed from https://github.com/oncogenetics/LocusExplorer
Contact: tokhir.dadaev@icr.ac.uk.
© The Author 2015. Published by Oxford University Press.
Figures
References
-
- Chang W., et al. (2015) shiny: Web Application Framework for R. R package version 0.12.1.
MeSH terms
Grants and funding
LinkOut - more resources
Full Text Sources
Other Literature Sources
