. 2016 Apr 1;32(7):1023-32.
doi: 10.1093/bioinformatics/btv683. Epub 2015 Nov 20.

Large-scale machine learning for metagenomics sequence classification

Affiliations

Large-scale machine learning for metagenomics sequence classification

Kévin Vervier et al. Bioinformatics. .

Abstract

Motivation: Metagenomics characterizes the taxonomic diversity of microbial communities by sequencing DNA directly from an environmental sample. One of the main challenges in metagenomics data analysis is the binning step, where each sequenced read is assigned to a taxonomic clade. Because of the large volume of metagenomics datasets, binning methods need fast and accurate algorithms that can operate with reasonable computing requirements. While standard alignment-based methods provide state-of-the-art performance, compositional approaches that assign a taxonomic class to a DNA read based on the k-mers it contains have the potential to provide faster solutions.

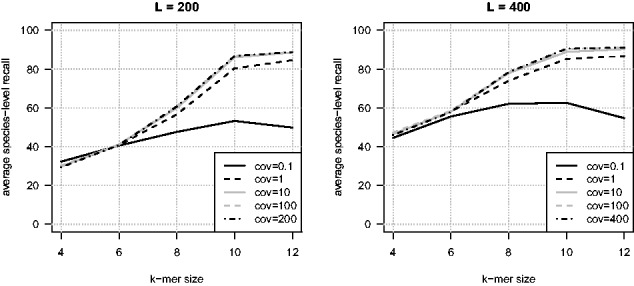
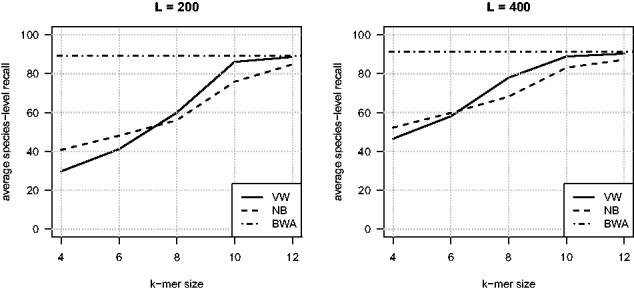
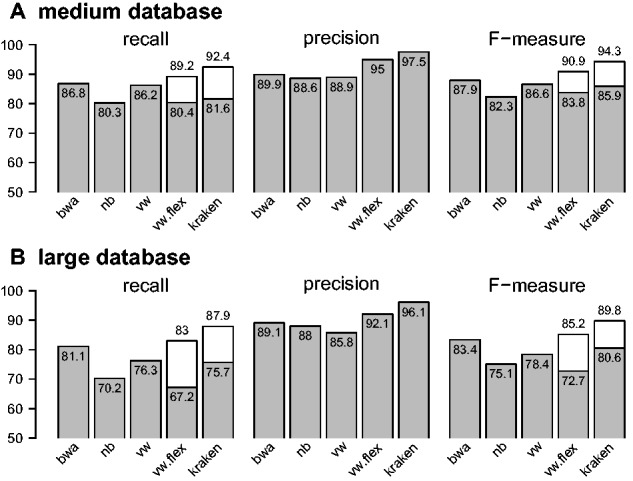
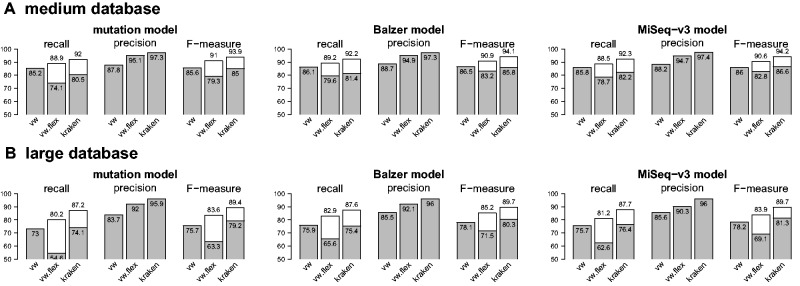
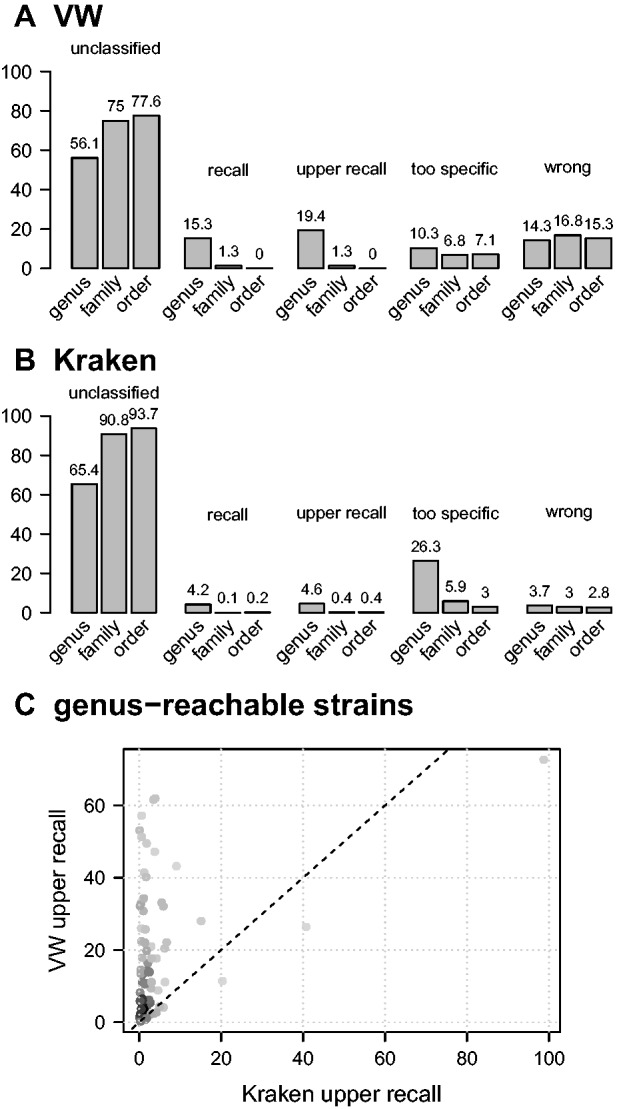
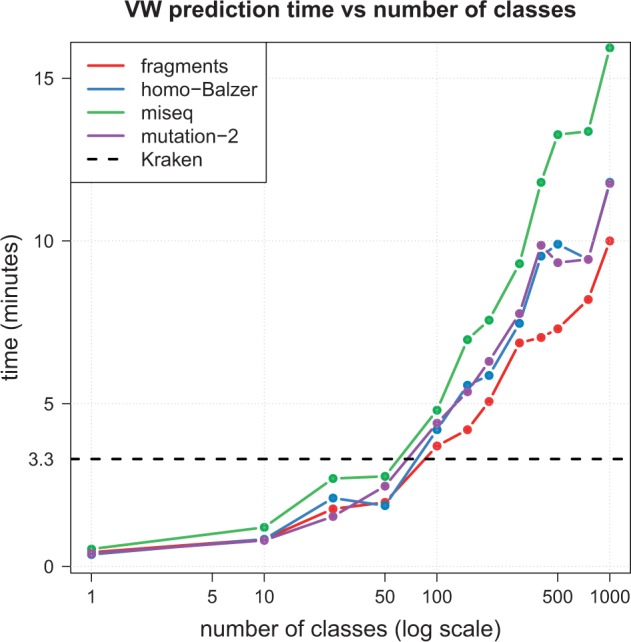
Results: We propose a new rank-flexible machine learning-based compositional approach for taxonomic assignment of metagenomics reads and show that it benefits from increasing the number of fragments sampled from reference genome to tune its parameters, up to a coverage of about 10, and from increasing the k-mer size to about 12. Tuning the method involves training machine learning models on about 10(8) samples in 10(7) dimensions, which is out of reach of standard softwares but can be done efficiently with modern implementations for large-scale machine learning. The resulting method is competitive in terms of accuracy with well-established alignment and composition-based tools for problems involving a small to moderate number of candidate species and for reasonable amounts of sequencing errors. We show, however, that machine learning-based compositional approaches are still limited in their ability to deal with problems involving a greater number of species and more sensitive to sequencing errors. We finally show that the new method outperforms the state-of-the-art in its ability to classify reads from species of lineage absent from the reference database and confirm that compositional approaches achieve faster prediction times, with a gain of 2-17 times with respect to the BWA-MEM short read mapper, depending on the number of candidate species and the level of sequencing noise.

Availability and implementation: Data and codes are available at http://cbio.ensmp.fr/largescalemetagenomics

Contact: pierre.mahe@biomerieux.com

Supplementary information: Supplementary data are available at Bioinformatics online.


Figures

Fig. 1.
Fig. 1.
Increasing the number of fragments and k-mer size on the small datasets. Left: L = 200 bp fragments. Right: L = 400 bp fragments. These figures show the average species-level recall obtained by linear predictors trained with Vowpal Wabbit from fragments covering each reference genome with a mean coverage c from 0.1 to L. Performances are reported as a function of k-mer sizes
Fig. 2.
Fig. 2.
Comparison between Vowpal Wabbit and reference methods on the small datasets. Left: L = 200 bp fragments. Right: L = 400 bp fragments. These figures show the average species-level recall obtained by linear predictors trained with Vowpal Wabbit from fragments covering each reference genome with a mean coverage equal to 10 (solid line). Performances are reported as afunction of k-mer sizes. This approach is compared to the standard compositional NB approach (dashed line) and an alignment-based approach based on BWA (dash-dotted line)
Fig. 3.
Fig. 3.
Performance on the medium and large reference databases. This figure shows the classification performance measured on genomic fragments in terms of average species-level recall, precision and F-measure, for the various classification strategies considered. For rank-flexible approaches, the average upper recall and upper F-measure are shown as white bars on top of the gray ones, representing species-level indicators
Fig. 4.
Fig. 4.
Robustness to sequencing errors. Top: medium reference database; Bottom: large reference database. This figure shows the classification performance measured on simulated reads in terms of average species-level recall, precision and F-measure, for the various classification strategies considered. For rank-flexible approaches, the average upper recall and upper F-measure are shown as white bars on top of the gray ones, representing species level
Fig. 5.
Fig. 5.
VW and Kraken performance on novel lineages. Panels (A) and (B) present the proportions of unclassified fragments, the recall (fragments assigned to their correct reachable taxon), the upper recall (fragments assigned to their correct reachable taxon or one of its ancestors), the proportion of too specific predictions (fragments assigned to a descendant of their reachable taxon) and the error rate (fragments assigned to a taxon not part of the branch of their reachable taxon). These results are shown for three reachable ranks (genus, family and order) and correspond to average values across reachable taxa of a given rank. Results obtained at higher ranks are provided in Supplementary Figure S7. Panel (C) compares the VW and Kraken upper recall estimations for the 69 genera used to evaluate the performance on the new strains reachable at the genus level
Fig. 6.
Fig. 6.
Abundance profiles obtained with VW (A) and Kraken (B) on the HMP spiked dataset. Abundance profiles are presented at the genus level, with colors corresponding to the different predicted species, restricted to species accounting for at least 0.2%) of the samples. Light-gray fractions of the bars correspond to genus-level predictions
Fig. 7.
Fig. 7.
Impact of the number of classes on VW prediction time. Time needed to process each test dataset by VW as the number of classes increases from 1 to 1000. The dashed horizontal line represents the median time measured by Kraken on the large database

References

    1. Agarwal A., et al. (2014) A reliable effective terascale linear learning system. J. Mach. Learn. Res., 15, 1111–1133.
    1. Angly F., et al. (2012) Grinder: a versatile amplicon and shotgun sequence simulator. Nucleic Acids Res., 40, 94–94. - PMC - PubMed
    1. Balzer S., et al. (2010) Characteristics of 454 pyrosequencing data enabling realistic simulation with flowsim. Bioinformatics, 26, 420–425. - PMC - PubMed
    1. Beygelzimer A., et al. (2009) Error-correcting tournaments. Algorithmic Learn. Theory, 5809, 247–262.
    1. Bottou L. (1998) Online learning and stochastic approximations. Online Learn. Neural Netw., 17, 9–42.