. 2015 Nov 20:9:83.
doi: 10.1186/s12918-015-0229-0.

Pathobiochemical signatures of cholestatic liver disease in bile duct ligated mice

Affiliations

Pathobiochemical signatures of cholestatic liver disease in bile duct ligated mice

Kerstin Abshagen et al. BMC Syst Biol. .

Abstract

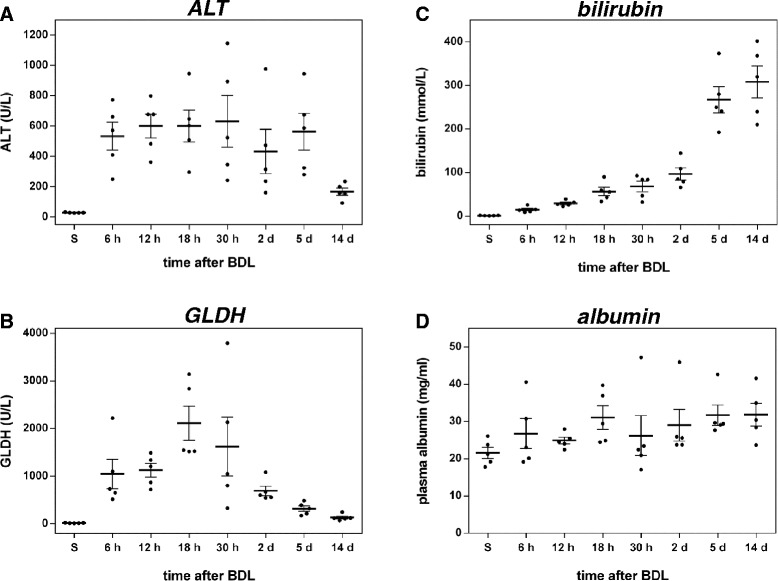
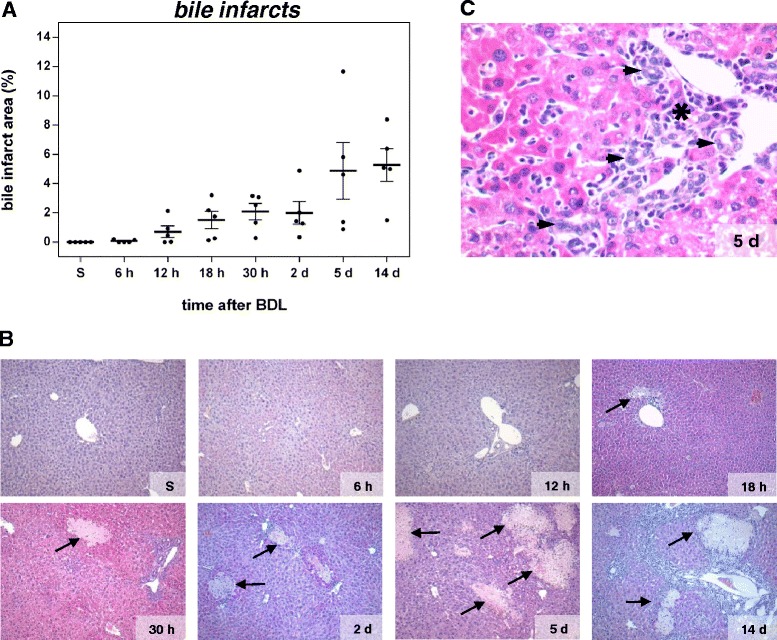
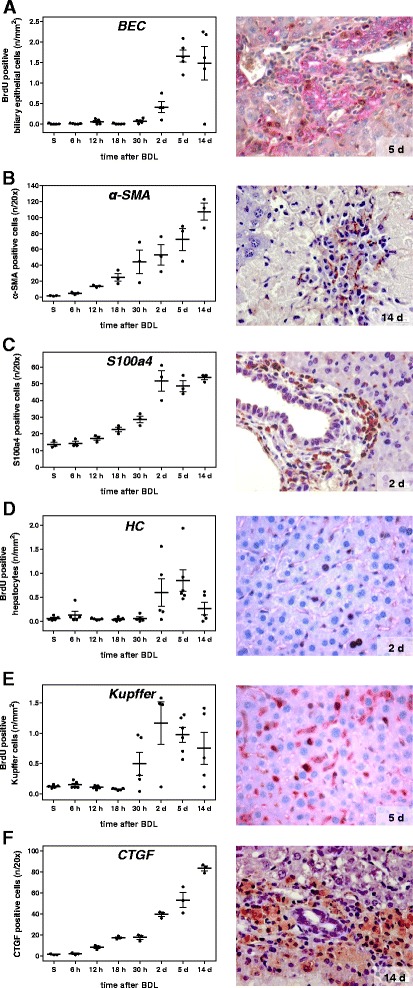
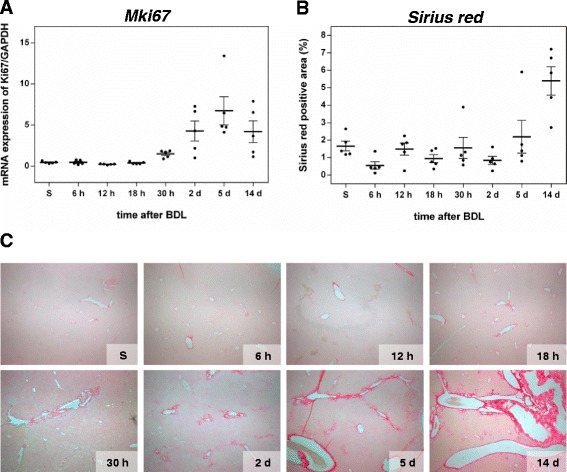
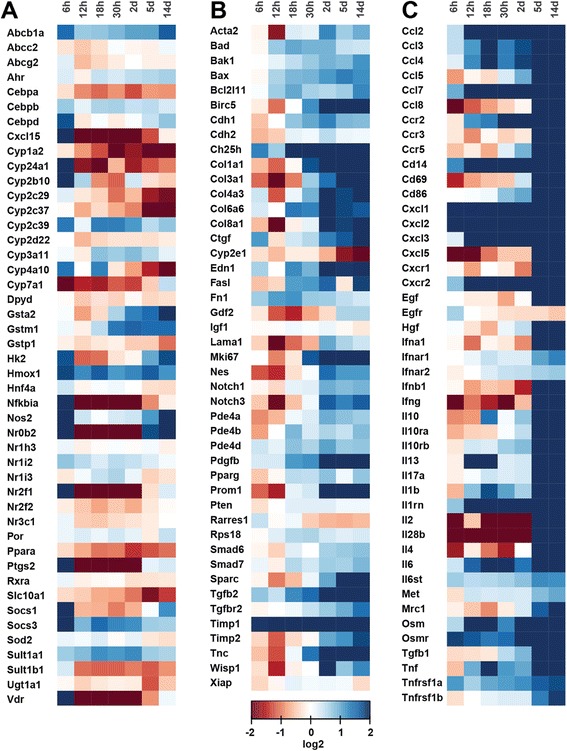
Background: Disrupted bile secretion leads to liver damage characterized by inflammation, fibrosis, eventually cirrhosis, and hepatocellular cancer. As obstructive cholestasis often progresses insidiously, markers for the diagnosis and staging of the disease are urgently needed. To this end, we compiled a comprehensive data set of serum markers, histological parameters and transcript profiles at 8 time points of disease progression after bile duct ligation (BDL) in mice, aiming at identifying a set of parameters that could be used as robust biomarkers for transition of different disease progression phases.

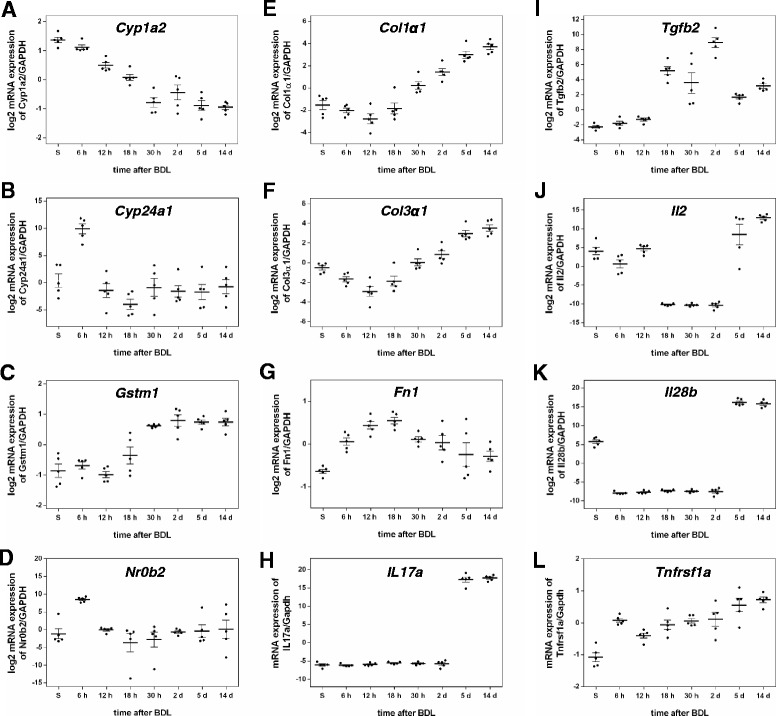
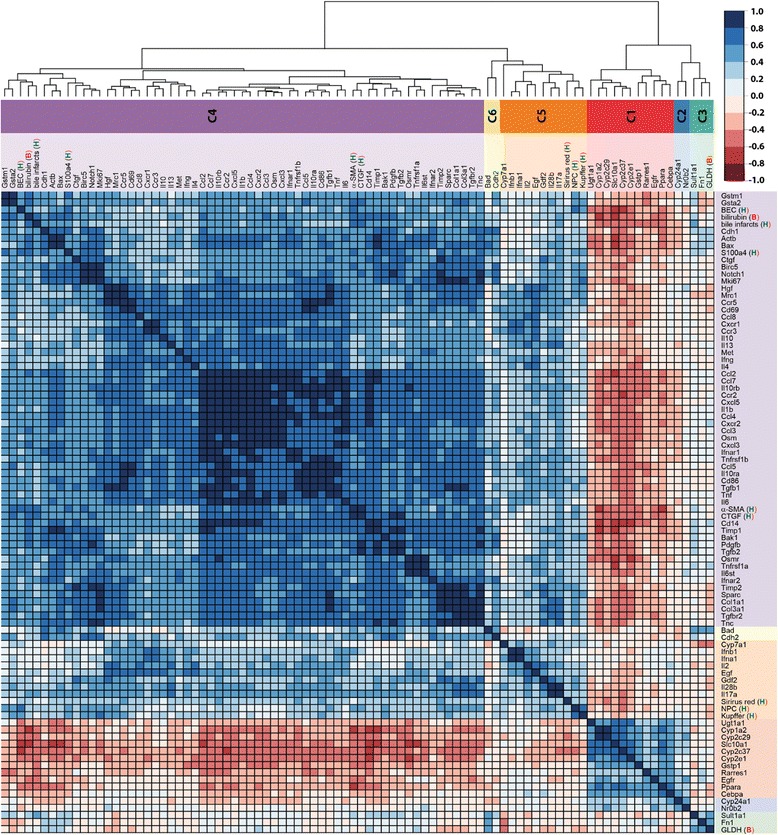
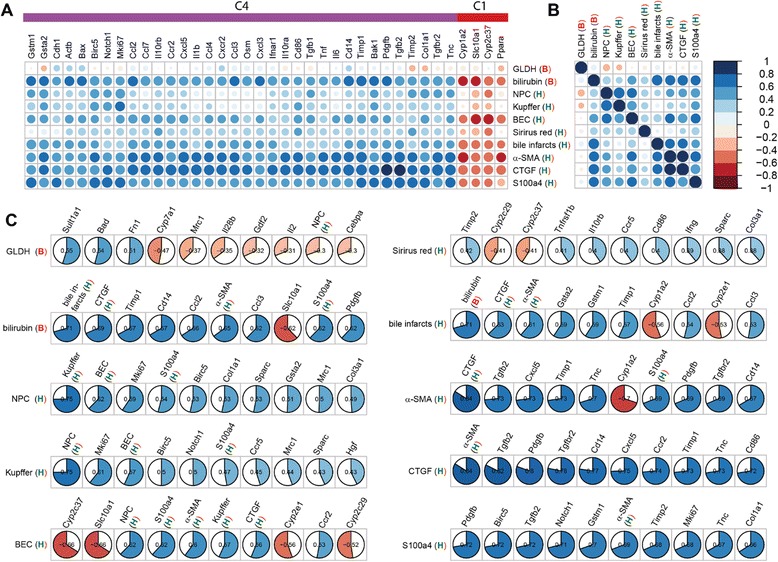
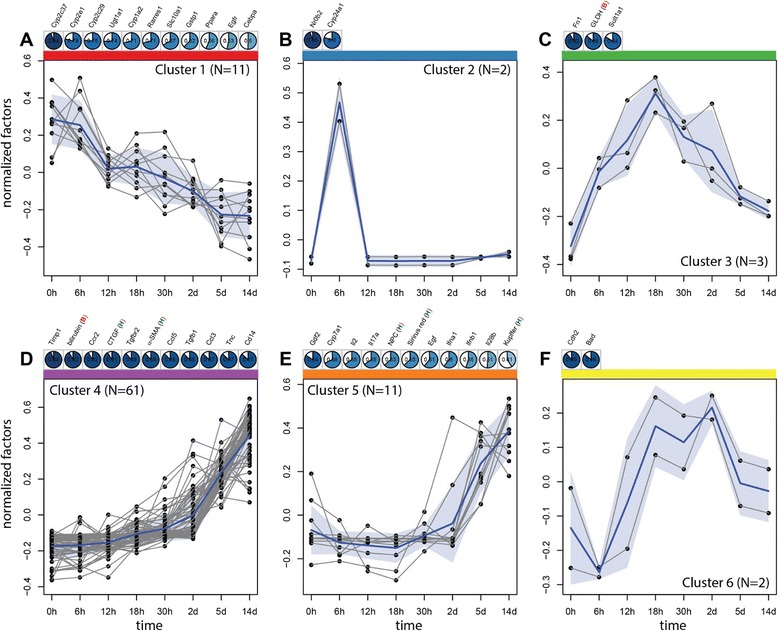
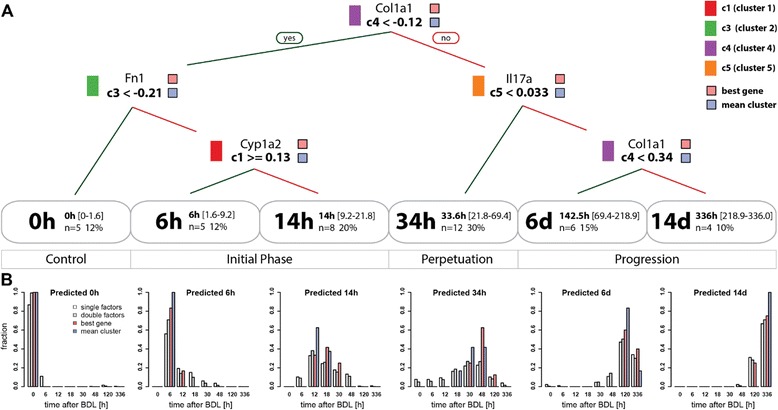
Results: Statistical analysis of the more than 6,000 data points revealed distinct temporal phases of disease. Time course correlation analysis of biochemical, histochemical and mRNA transcript parameters (=factors) defined 6 clusters for different phases of disease progression. The number of CTGF-positive cells provided the most reliable overall measure for disease progression at histological level, bilirubin at biochemical level, and metalloproteinase inhibitor 1 (Timp1) at transcript level. Prominent molecular events exhibited by strong transcript peaks are found for the transcriptional regulator Nr0b2 (Shp) and 1,25-dihydroxyvitamin D(3) 24-hydroxylase (Cyp24a1) at 6 h. Based on these clusters, we constructed a decision tree of factor combinations potentially useful as markers for different time intervals of disease progression. Best prediction for onset of disease is achieved by fibronectin (Fn1), for early disease phase by Cytochrome P450 1A2 (Cyp1a2), passage to perpetuation phase by collagen1α-1 (Col1a1), and transition to the progression phase by interleukin 17-a (Il17a), with early and late progression separated by Col1a1. Notably, these predictions remained stable even for randomly chosen small sub-sets of factors selected from the clusters.

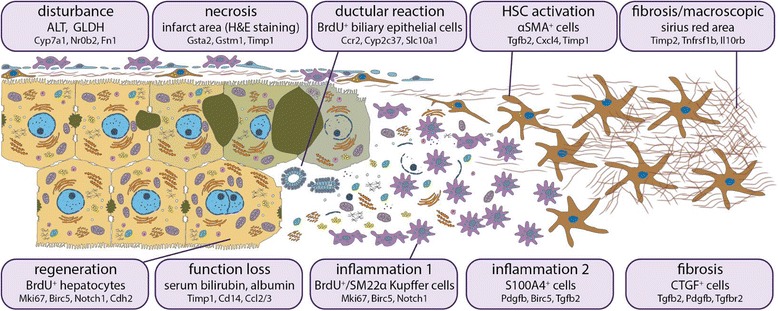
Conclusion: Our detailed time-resolved explorative study of liver homogenates following BDL revealed a well-coordinated response, resulting in disease phase dependent parameter modulations at morphological, biochemical, metabolic and gene expression levels. Interestingly, a small set of selected parameters can be used as diagnostic markers to predict disease stages in mice with cholestatic liver disease.


Figures

Fig. 1
Fig. 1
Analysis of liver injury and function. Plasma activities of alanine aminotransferase (ALT) (a) and glutamate dehydrogenase (GLDH) (b) and concentrations of plasma bilirubin (c) and albumin (d) at multiple time points after BDL. Values are given in means ± SEM of five independent experiments per time point
Fig. 2
Fig. 2
Quantification of bile infarcts in H&E stained liver sections at multiple time points after BDL (a). Values are given in means ± SEM of five independent experiments per time point. Representative H&E stainings of paraffin embedded liver sections for each time point after BDL (b; arrows indicate bile lakes; magnification x10) with higher magnifications (x40) in (c), displaying cellular infiltrates (asterisk) and formation of artificial bile ductules (arrowhead)
Fig. 3
Fig. 3
Analysis of the proliferative and cellular response at multiple time points after BDL. Quantitative immunohistochemical analysis of BrdU positive biliary epithelial cells (a), liver cells positive for α-SMA (b) and S100a4 (c), BrdU positive hepatocytes (d) and Kupffer cells (e) and CTGF positive cells (f). Values are given in means ± SEM of five independent experiments per time point. Corresponding representative immunohistochemical stainings are shown in the right panel (magnifications x40)
Fig. 4
Fig. 4
Analysis of proliferation and extracellular matrix accumulation. mRNA quantification of the proliferation marker Ki67 (a) by Fluidigm real-time PCR. Values are given in means ± SEM of five independent experiments per time point. Quantitative analysis of extracellular matrix deposition (b) and representative histological images (c; magnification x10) of Sirius red positive areas at multiple time points after BDL. Values are given in means ± SEM of five independent experiments per time point
Fig. 5
Fig. 5
Heat maps displaying gene expression pattern at multiple time points after BDL. Gene expression relative to the Gapdh gene, obtained from Fluidigm qPCR, are shown as fold changes to sham operated mice (0 h) and are displayed in log2 scale. Red colour indicates down-regulation (log2 of 2), blue up-regulation (log2 of −2) and white transcription fold changes about 1 (log2 of 0). a selected ADME genes, (b) selected fibrogenesis genes, and (c) selected inflammation genes
Fig. 6
Fig. 6
mRNA quantification of selected genes by Fluidigm real-time PCR displayed in log2 scale. a Cyp1a2, (b) Cyp24a1, (c) Gstm1, (d) Nr0b2, (e) Col1α1, (f) Col3α1, (g), Fn1, (h) Il17a, (i) Tgfb2, (j) Il2, (k) Il28b, (l) Tnfrsf1a. Values are given in means ± SEM of five independent experiments per time point
Fig. 7
Fig. 7
Correlation matrix of factors. Matrix of correlation coefficients between subset of factors, which changed significantly after BDL as determined by ANOVA. Correlation coefficients are YS3 correlations, with positive correlation depicted in blue, negative correlation in red, according to color key. Side dendrogram shows the results of hierarchical clustering with the resulting six time course clusters c1-c6 marked in the color sidebar (see Fig. 9 for time courses corresponding to the individual clusters). Histological factors are marked with H, immunostainings with A, and biochemical factors with B. The list of full names corresponding to the factor abbreviations is provided in Additional file 2, gene probes
Fig. 8
Fig. 8
Histological (H), biochemical (B), and immunostaining (A) correlations. Top correlations between classical and transcriptional factors (numerical values provided in Additional file 2). Correlation coefficients are YS3 correlations with positive correlation depicted in blue, negative correlation in red, according to color key. a Top correlation between histological, biochemical and immunostaining factors with gene transcripts (area of circles corresponds to the correlation coefficients). Only genes with at least one YS3 correlation of abs(YS3) > =0.6 are shown. Genes are sorted based on hierarchical clustering in Fig. 7 with corresponding clusters depicted in the side color bar (C4 and C1). b Correlation between histological, biochemical, and immunostaining factors with color coding analogue to a. c Highest absolute correlations between classical factors (histological, biochemical, and immunostaining), and all other factors. Data sorted from left to right by absolute value of correlation. Color and size of the filled pie corresponds to the respective correlation value, with positive correlation in blue and negative correlation in red
Fig. 9
Fig. 9
Time course clusters in BDL. Six time course clusters (a-f corresponding to cluster 1-6) resulting from hierarchical clustering (see Fig. 7). The mean cluster time course (averaged over all factors and repeats) is depicted in blue, all representatives of the respective cluster in grey. The shaded blue area corresponds to the standard deviation between the mean time courses of the representatives in the cluster. The top correlations between the mean cluster time course and factors in the cluster are listed above the time course (color coding analog to Fig. 8c with positive correlations in blue and negative correlations in red) with histological factors marked with H, immunostainings with A, and biochemical factors with B. The cluster members are fully enumerated for all clusters with exception of cluster 4. The full set of members and respective correlation to the mean cluster time course for cluster 4 are: Timp1 (0.94), bilirubin (B 0.92), Ccr2 (0.92), CTGF (A 0.91), Tgfbr2 (0.89), α-SMA (A 0.89), Ccl5 (0.88), Tgfb1 (0.88), Ccl3 (0.87), Tnc (0.87), Cd14 (0.87), Ccl2 (0.86), Cd86 (0.86), Pdgfb (0.86), Col1a1 (0.86), Cxcl3 (0.86), Ccl4 (0.85), Cxcl5 (0.85), Il10ra (0.85), Col3a1 (0.85), Il10rb (0.84), Ccl7 (0.82), Cd69 (0.82), Ifnar1 (0.82), Tnf (0.82), Osm (0.81), Sparc (0.8), Il6 (0.8), Tnfrsf1b (0.8), Cxcr2 (0.78), Il1b (0.78), Timp2 (0.77), Ifnar2 (0.77), Ccr5 (0.77), Il10 (0.76), Osmr (0.75), Gsta2 (0.74), Il4 (0.71), Ifng (0.71), Ccl8 (0.71), Hgf (0.7), Bak1 (0.7), Mrc1 (0.69), Tgfb2 (0.69), Ccr3 (0.68), Actb (0.68), S100a4 (A 0.66), Il13 (0.66), Met (0.66), bile infarcts (H 0.65), Il6st (0.63), Tnfrsf1a (0.63), Mki67 (0.62), Birc5 (0.6), Ctgf (0.58), BEC (H 0.56), Bax (0.56), Notch1 (0.54), Cxcr1 (0.51), Gstm1 (0.45), Cdh1 (0.42)
Fig. 10
Fig. 10
Decision tree for disease progression. (a) Regression tree for the prediction of time phases after BDL based on mean cluster time courses (Fig. 9). Splitting rules are depicted at the respective branching points of the tree, with left branches correspond to ‘yes’, right branches to ‘no’ decisions. In addition to the cluster used in the decisions, also the best gene representatives from the respective cluster is shown above the decision rule. The regression tree classifies the data in six time classes 0 h, 6 h, 14 h, 24 h, 6d, 14d with information on mean time, range, number and percentage of samples falling in the respective class listed. In addition to the tree based on the mean cluster time courses (mean cluster), the best tree only using a single gene transcript from every cluster is shown (best gene). The best decision tree based on genes, histological, biochemical, and immunostaining factors (not shown) is highly similar to the depicted best gene tree, with the single change of using S100a4 instead of Col1a1 for the decision on cluster c4 and allowing GLDH as equally good alternative to Fn1 in c3. (b) Predictive performance of decision tree. The predictive performance of the regression tree was evaluated using all single factor combinations from the individual clusters (white), a random sample (N = 10000) of two factors from each cluster (gray), the best gene representative tree (red), and the mean cluster data (blue, trainings data). For all classes of the decision tree the histogram of predicted vs. experimental data are shown
Fig. 11
Fig. 11
Outline of the disease process. Each box is dedicated to a specific disease aspect (first line), which is represented by a commonly known marker (second line) or by several markers. Below (in small font), genes are given, whose expression is correlated to the factor above

References

    1. Wang H, Vohra BPS, Zhang Y, Heuckeroth RO. Transcriptional profiling after bile duct ligation identifies PAI-1 as a contributor to cholestatic injury in mice. Hepatology. 2005;42(5):1099–1108. doi: 10.1002/hep.20903. - DOI - PubMed
    1. Woolbright BL, Antoine DJ, Jenkins RE, Bajt ML, Park BK, Jaeschke H. Plasma biomarkers of liver injury and inflammation demonstrate a lack of apoptosis during obstructive cholestasis in mice. Toxicol Appl Pharmacol. 2013;273(3):524–531. doi: 10.1016/j.taap.2013.09.023. - DOI - PMC - PubMed
    1. Lindblad L, Lundholm K, Schersten T. Bile acid concentrations in systemic and portal serum in presumably normal man and in cholestatic and cirrhotic conditions. Scand J Gastroenterol. 1977;12(4):395–400. doi: 10.3109/00365527709181679. - DOI - PubMed
    1. Trauner M, Meier PJ, Boyer JL. Molecular pathogenesis of cholestasis. N Engl J Med. 1998;339(17):1217–27. doi: 10.1056/NEJM199810223391707. - DOI - PubMed
    1. Nguyen KD, Sundaram V, Ayoub WS. Atypical causes of cholestasis. World J Gastroenterol. 2014;20(28):9418–9426. - PMC - PubMed

Publication types

MeSH terms