. 2016 May;99(5):699-710.
doi: 10.1189/jlb.2A0215-050RR. Epub 2015 Nov 20.

WASp-dependent actin cytoskeleton stability at the dendritic cell immunological synapse is required for extensive, functional T cell contacts

Affiliations

WASp-dependent actin cytoskeleton stability at the dendritic cell immunological synapse is required for extensive, functional T cell contacts

Dessislava Malinova et al. J Leukoc Biol. 2016 May.

Abstract

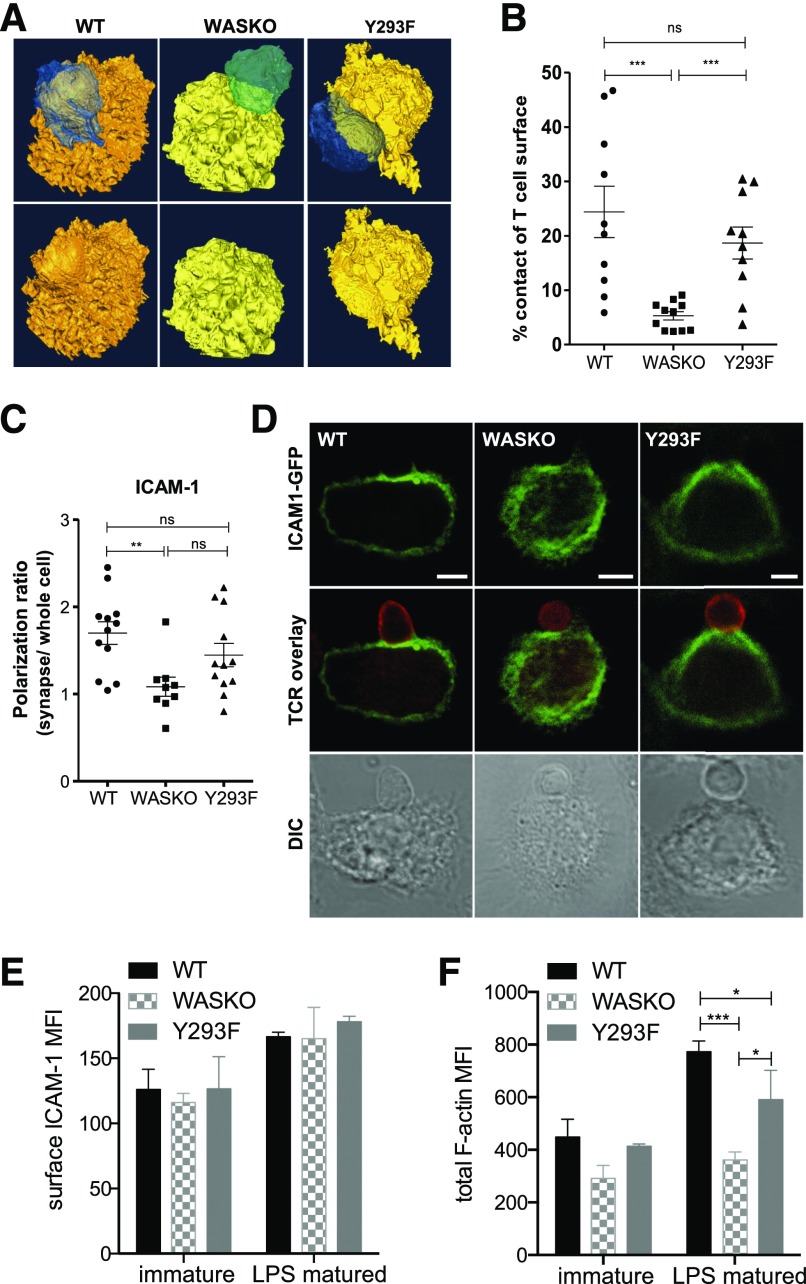
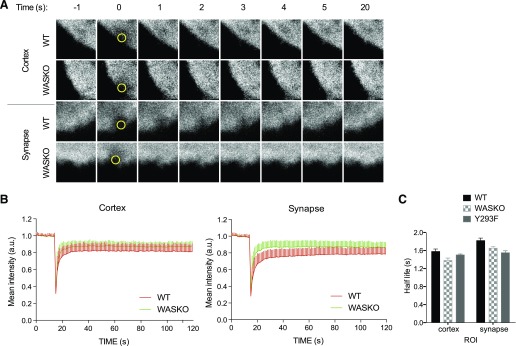
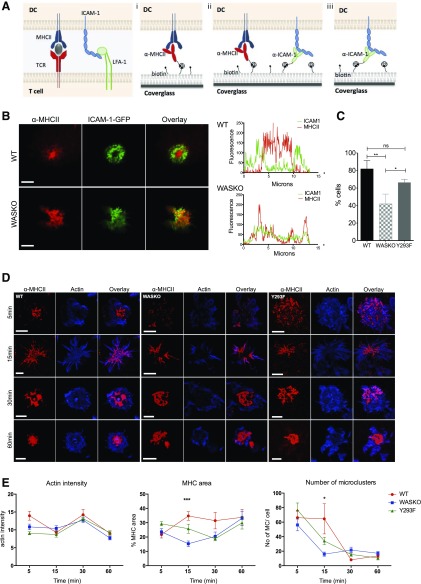
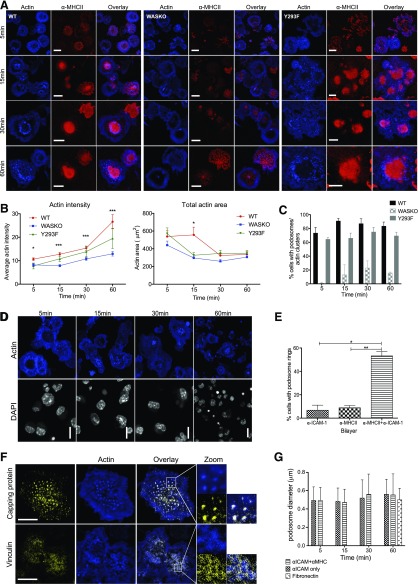
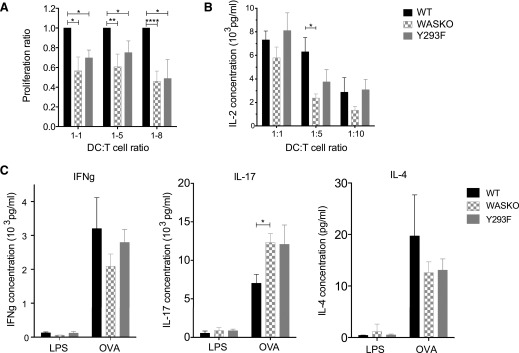
The immunological synapse is a highly structured and molecularly dynamic interface between communicating immune cells. Although the immunological synapse promotes T cell activation by dendritic cells, the specific organization of the immunological synapse on the dendritic cell side in response to T cell engagement is largely unknown. In this study, confocal and electron microscopy techniques were used to investigate the role of dendritic cell actin regulation in immunological synapse formation, stabilization, and function. In the dendritic cell-restricted absence of the Wiskott-Aldrich syndrome protein, an important regulator of the actin cytoskeleton in hematopoietic cells, the immunological synapse contact with T cells occupied a significantly reduced surface area. At a molecular level, the actin network localized to the immunological synapse exhibited reduced stability, in particular, of the actin-related protein-2/3-dependent, short-filament network. This was associated with decreased polarization of dendritic cell-associated ICAM-1 and MHC class II, which was partially dependent on Wiskott-Aldrich syndrome protein phosphorylation. With the use of supported planar lipid bilayers incorporating anti-ICAM-1 and anti-MHC class II antibodies, the dendritic cell actin cytoskeleton organized into recognizable synaptic structures but interestingly, formed Wiskott-Aldrich syndrome protein-dependent podosomes within this area. These findings demonstrate that intrinsic dendritic cell cytoskeletal remodeling is a key regulatory component of normal immunological synapse formation, likely through consolidation of adhesive interaction and modulation of immunological synapse stability.

Keywords: Arp2/3; DC; FRAP; ICAM-1; podosomes.


Figures

Figure 1.
Figure 1.. The WASp-dependent DC actin cytoskeleton contributes to correct organization of adhesion molecules and formation of an extensive cell:cell contact.
(A) WT, WASKO, and Y293F DCs (yellow/orange), pulsed with OVA, were cocultured with OT-II T cells (blue/green). After 1 h, conjugates were fixed, processed, and imaged using Gatan 3View. Isosurface reconstructions were created in Amira. (Lower) Conjugates with T cell removed to visualize the contact interface. (B) Quantification of DC:T cell contact surface area as a percentage of T cell surface. A minimum of 10 conjugates was analyzed per group. Unpaired t test was used to test significance among DC types; ***P(WT + WASKO) = 0.0005, P(WASKO + Y293F) = 0.0002; ns P(WT + Y293F) = 0.3153. (C and D) DCs expressing ICAM-1-GFP (green) were cocultured with T cells (red; anti-TCR immunostain) for 45 min and fixed. Images represent a slice cutting through the synapse. Polarization ratios of ICAM-1 on the DC side were calculated by measuring fluorescence intensity at the synapse normalized to whole cell. Original scale bars, 5 μm. Unpaired t test was used to test significance among DC types; **P(WT + WASKO) = 0.0026; ns, P(WT + Y293F) = 0.1875, P(WASKO + Y293F) = 0.0610. DIC, Differential interference contrast. (E) Total surface ICAM-1 was measured by flow cytometry in immature and LPS-matured BMDCs, gated on CD11c-positive cells. Means and sd are shown from 3 independent experiments. MFI, Mean fluorescence intensity. (F) Total polymerized actin was measured using phalloidin in permeabilized, immature and LPS-matured BMDCs. Staining was performed in mixed population samples using CFSE labeling. Bars represent means and sd from 3 experiments. ***P(WT + WASKO) = 0.0010, *P(WT + Y293F) = 0.0472, *P(WASKO + Y293F) = 0.0407.
Figure 2.
Figure 2.. The dynamics of individual actin networks determine synapse stability.
(A) Actin-mCherry-expressing WT, WASKO, and Y293F DCs were cocultured with T cells and imaged on a Zeiss LSM 710 microscope. FRAP was performed with 5 iterations of 100% laser power of the 488 laser. ROIs were chosen in the cortex or synapse areas of individual DCs. Actin recovery is followed as the mean mCherry intensity over time within the ROI. Representative images are shown for WT and WASKO DCs bleached at the cortex and synapse. Imaging area = 5 × 5 μm; ROI (yellow circles) = 1 μm2. (B) Curves present the means and sd of actin-mCherry fluorescence from a minimum of 45 curves per sample from 3 experiments. For clarity, only WT and WASKO curves are shown. (C) Fluorescent recovery half-life measured at the steady-state cortex and synapse from a minimum of 45 curves from 3 experiments.
Figure 3.
Figure 3.. The development of a novel imaging system of the DC synapse.
(A) Three different lipid bilayer compositions were designed to mimic a DC:T cell synapse. A biotinylated α-MHC II-Cy5-conjugated antibody was incorporated to replace TCR interaction (Fig. 2). Alternatively, both α-MHC II-Cy5 and α-ICAM-1 antibodies were added to replicate adhesion forces (A and E). α-ICAM-1 alone was used in D. (B) ICAM-1-GFP-expressing DCs interacting with an α-MHC II bilayer were fixed after 20 min and imaged. Original scale bars, 5 μm. Fluorescence intensity of ICAM-1-GFP and MHC II-Cy5 is plotted along the cell diameter, showing differential distribution in WT and WASKO DC. (C) Number of cells exhibiting radial symmetry, as a percentage of cells interacting with the α-MHC II bilayer. A minimum of 30 cells per strain was analyzed. Cells with radial symmetry were defined as having at least 3 different diameter cross-sections showing plots similar to WT DC in B. *P = 0.0232; **P = 0.0092; ns, P = 0.0572. (D) WT, WASKO, and Y293F DCs interacting with the α-MHC II-Cy5 (red) bilayer were fixed and stained with phalloidin (blue). Original scale bars, 5 μm. (E) Three parameters were measured by use of ImageJ “Measure” and “Analyze particles” functions in cells interacting with an α-MHC II-Cy5 bilayer: average actin intensity across the contact; MHC II area as a percentage of the total contact area (actin); and number of peripheral microclusters (MC) per cell (size < 600 nm2). Means and sem are shown for a minimum of 25 cells per condition analyzed in 2 experiments. ***P(WT + WASKO) < 0.0001, P(WASKO + Y293F) = 0.0061, P(WT + Y293F) = 0.0664; *P(WT + WASKO) = 0.0113, P(WASKO + Y293F) = 0.0084, P(WT + Y293F) = 0.0769.
Figure 4.
Figure 4.. Novel actin organization at the DC synapse.
(A) WT, WASKO, and Y293F DCs interacting with an α-MHC II-Cy5 (red) and α-ICAM-1 bilayer were fixed and stained with phalloidin (blue). Original scale bars, 5 μm. (B) The polymerized actin was stained with phalloidin, and fluorescent intensity at the contact site as well as total actin area was quantified at the 4 time points. A minimum of 100 cells was analyzed in 4 experiments; means and sem are plotted. For actin intensity: *5 min: P(WT + WASKO) = 0.0113, P(WT + Y293F) = 0.0428; ***15 min: P(WT + WASKO) = 0.0005, P(WASKO + Y293F) = 0.0256; ***30 min: P(WT + WASKO) = 0.0007; ***60 min: P(WT + WASKO) = 0.0009. For total actin area: *15 min: P(WT + WASKO) = 0.0346. (C) Percentage of WT, WASKO, and Y293F DCs forming podosomes on an α-MHC II and α-ICAM-1 bilayer. A minimum of 400 cells was analyzed at each time point. “Actin clusters” are irregular, high-intensity actin structures, similar to those in WASKO cells at 30 and 60 min (A). (D) WT DC contacting an α-ICAM-1-only bilayer. Position of cells is depicted by DAPI staining (white). Phalloidin staining (blue) shows podosome rosettes. (E) The proportion of WT cells forming rings of podosomes in the 3 bilayer conditions is quantified. Means and sem from 3 experiments are shown; a minimum of 300 cells was analyzed. *P = 0.0241, **P = 0.0073 (F) WT DC contacting an α-MHC II-Cy5 and α-ICAM-1 bilayer, showing actin-rich podosomes (blue) and immunofluorescent staining (yellow): capping protein (F-actin capping protein, α subunit; upper), vinculin (lower). Colocalization of F-actin capping protein and actin produces a white overlay; 36 WT DCs were analyzed to calculate colocalization. Pearson correlation coefficient = 0.442 ± 0.14; Mander’s overlap coefficient = 0.777 ± 0.04. Original scale bars, 5 μm. A 3× zoom is shown to the right. (G) DCs were seeded on 2 different bilayers and on fibronectin (50 μg/ml) and fixed at set intervals. Diameter of the podosome actin cores was measured in ImageJ; >100 podosomes were measured for each condition. Synapse podosomes did not change significantly over time and showed a similar size to those formed on the ventral side of cells adhering to fibronectin.
Figure 5.
Figure 5.. Abnormal synapse formation has functional consequences for T cell activation.
(A) OVA-pulsed DCs were cocultured with CFSE-labeled T cells at 3 different DC:T cell ratios (1:1, 1:5, 1:8) for 48 h. Proliferation was measured by following CFSE dilution in the CD4+ population. Proliferation ratios were calculated from 5 independent experiments by determining the proportion of proliferated cells (above LPS-only control) and normalizing this to the WT value for each respective experiment. *P = 0.01–0.05; **P = 0.0095; ****P < 0.0001. (B) IL-2 secretion in supernatants from DC:T cell cocultures was measured using the ELISA kit (R&D Systems, Minneapolis, MN, USA) in 3 individual experiments in triplicate. A paired t test was used to calculate significance between WT and WASKO cocultures. *P = 0.0460. (C) Supernatants were collected from 1:1 DC:T cell suspensions, 48 h after coculture and tested for cytokine secretion by ELISA. Samples were tested in triplicates, and graphs represent the means and sem of 4 separate cocultures. A paired t test was used to calculate significance. *P = 0.0245 (IL-17).

References

    1. Smith-Garvin J. E., Koretzky G. A., Jordan M. S. (2009) T Cell activation. Annu. Rev. Immunol. 27, 591–619. - PMC - PubMed
    1. Bunnell S. C., Kapoor V., Trible R. P., Zhang W., Samelson L. E. (2001) Dynamic actin polymerization drives T cell receptor-induced spreading: a role for the signal transduction adaptor LAT. Immunity 14, 315–329. - PubMed
    1. Babich A., Li S., O’Connor R. S., Milone M. C., Freedman B. D., Burkhardt J. K. (2012) F-Actin polymerization and retrograde flow drive sustained PLCγ1 signaling during T cell activation. J. Cell Biol. 197, 775–787. - PMC - PubMed
    1. Beemiller P., Jacobelli J., Krummel M. F. (2012) Integration of the movement of signaling microclusters with cellular motility in immunological synapses. Nat. Immunol. 13, 787–795. - PMC - PubMed
    1. Al-Alwan M. M., Rowden G., Lee T. D., West K. A. (2001) The dendritic cell cytoskeleton is critical for the formation of the immunological synapse. J. Immunol. 166, 1452–1456. - PubMed

Publication types

MeSH terms

Substances