

Correspondence between Resting-State Activity and Brain Gene Expression
- PMID: 26590343
- PMCID: PMC4694561
- DOI: 10.1016/j.neuron.2015.10.022
Correspondence between Resting-State Activity and Brain Gene Expression
Abstract
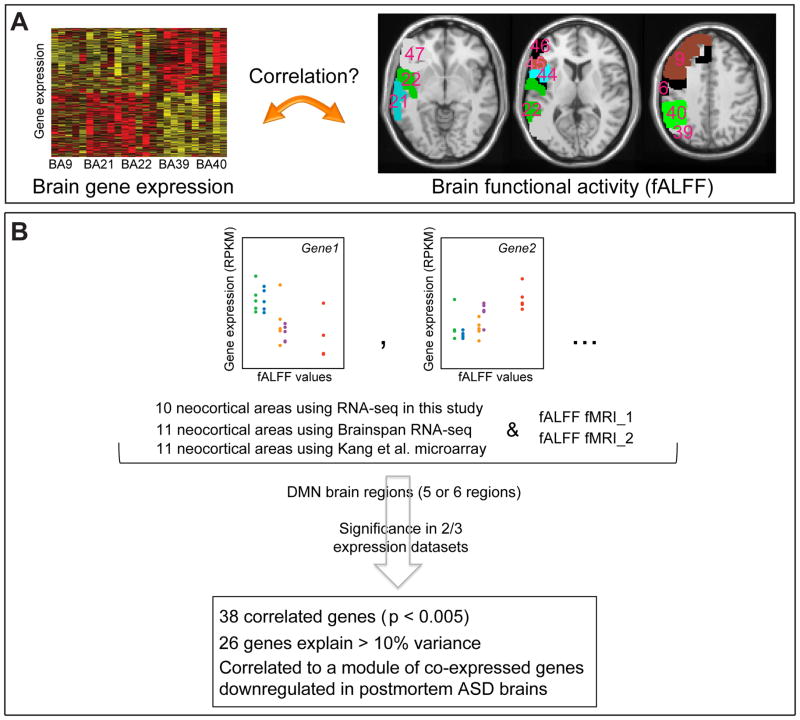
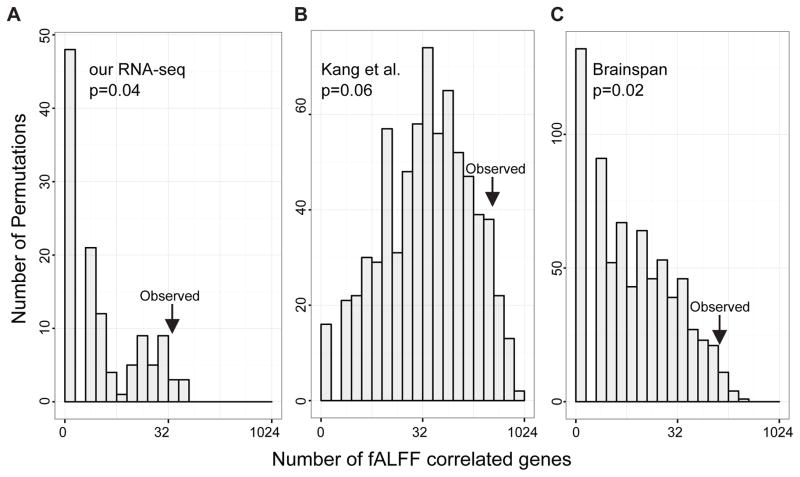
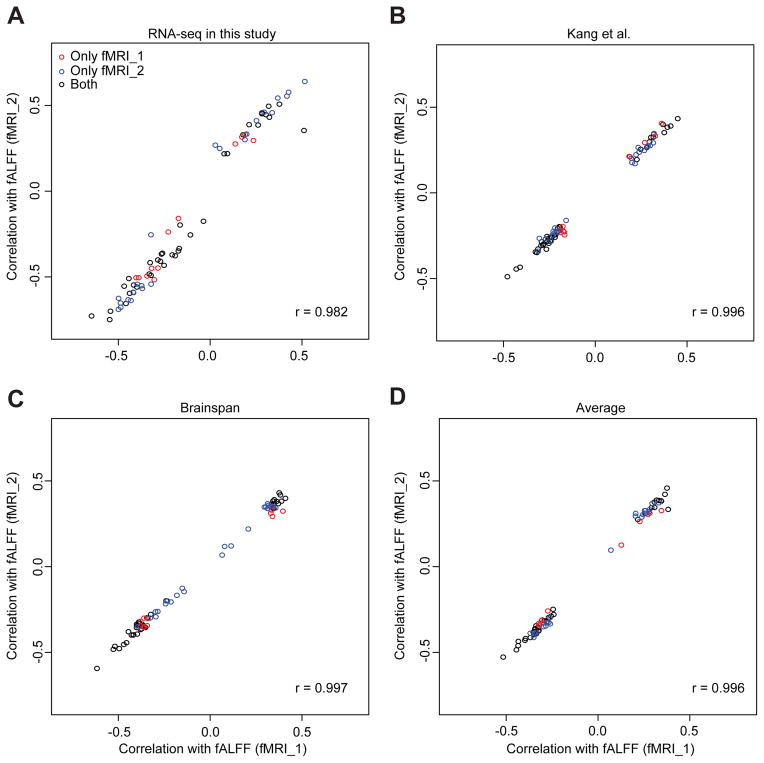
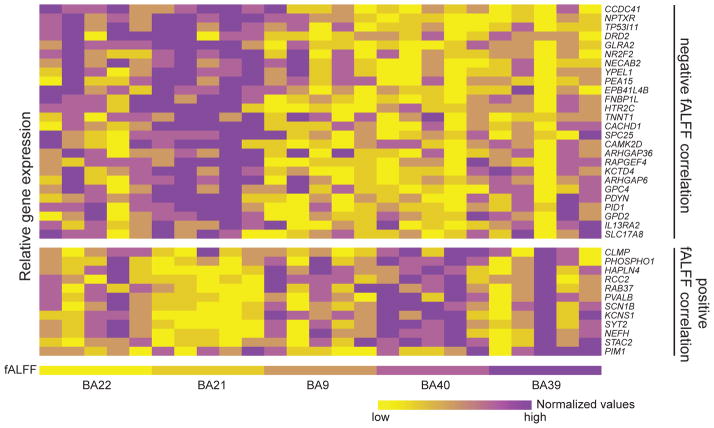
The relationship between functional brain activity and gene expression has not been fully explored in the human brain. Here, we identify significant correlations between gene expression in the brain and functional activity by comparing fractional amplitude of low-frequency fluctuations (fALFF) from two independent human fMRI resting-state datasets to regional cortical gene expression from a newly generated RNA-seq dataset and two additional gene expression datasets to obtain robust and reproducible correlations. We find significantly more genes correlated with fALFF than expected by chance and identify specific genes correlated with the imaging signals in multiple expression datasets in the default mode network. Together, these data support a population-level relationship between regional steady-state brain gene expression and resting-state brain activity.
Copyright © 2015 Elsevier Inc. All rights reserved.
Conflict of interest statement
Figures
References
-
- Amit DJ, Romani S. Search for fMRI BOLD signals in networks of spiking neurons. Eur J Neurosci. 2007;25:1882–1892. - PubMed
-
- Bacchelli E, Blasi F, Biondolillo M, Lamb JA, Bonora E, Barnby G, Parr J, Beyer KS, Klauck SM, Poustka A, et al. Screening of nine candidate genes for autism on chromosome 2q reveals rare nonsynonymous variants in the cAMP-GEFII gene. Mol Psychiatry. 2003;8:916–924. - PubMed
Publication types
MeSH terms
Substances
Associated data
- Actions
Grants and funding
- R01 MH094714/MH/NIMH NIH HHS/United States
- N01-HD-4-3383/HD/NICHD NIH HHS/United States
- P51 OD011132/OD/NIH HHS/United States
- R01 MH100027/MH/NIMH NIH HHS/United States
- P51OD11132/OD/NIH HHS/United States
- T32 NS048004/NS/NINDS NIH HHS/United States
- R01MH100027/MH/NIMH NIH HHS/United States
- N01-HD-4-3368/HD/NICHD NIH HHS/United States
- R01 MH103517/MH/NIMH NIH HHS/United States
- R37 MH060233/MH/NIMH NIH HHS/United States
- T32NS048004/NS/NINDS NIH HHS/United States
- R00 MH090238/MH/NIMH NIH HHS/United States
- R01MH094714/MH/NIMH NIH HHS/United States
- R01MH102603/MH/NIMH NIH HHS/United States
- R01MH103517/MH/NIMH NIH HHS/United States
- P51RR165/RR/NCRR NIH HHS/United States
- R01 MH102603/MH/NIMH NIH HHS/United States
- R00MH090238/MH/NIMH NIH HHS/United States
- R21 MH107672/MH/NIMH NIH HHS/United States
- R37MH060233/MH/NIMH NIH HHS/United States
- R21MH107672/MH/NIMH NIH HHS/United States
LinkOut - more resources
Full Text Sources
Other Literature Sources
Molecular Biology Databases
