. 2015 Nov 18;88(4):762-73.
doi: 10.1016/j.neuron.2015.10.039.

M4 Muscarinic Receptor Signaling Ameliorates Striatal Plasticity Deficits in Models of L-DOPA-Induced Dyskinesia

Affiliations

M4 Muscarinic Receptor Signaling Ameliorates Striatal Plasticity Deficits in Models of L-DOPA-Induced Dyskinesia

Weixing Shen et al. Neuron. .

Erratum in

Abstract

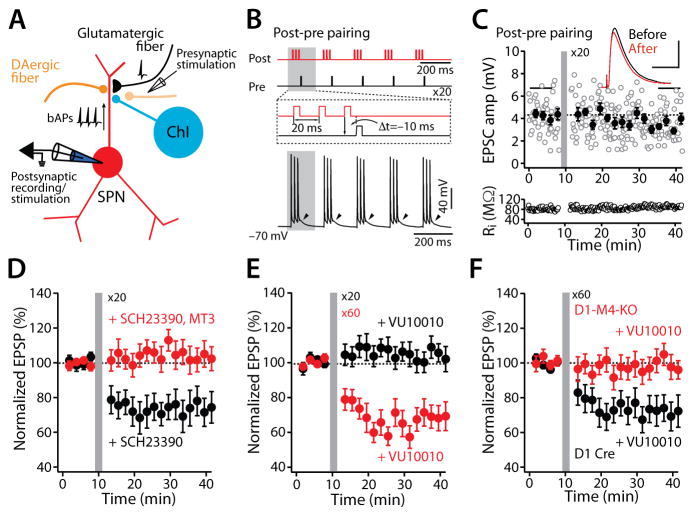
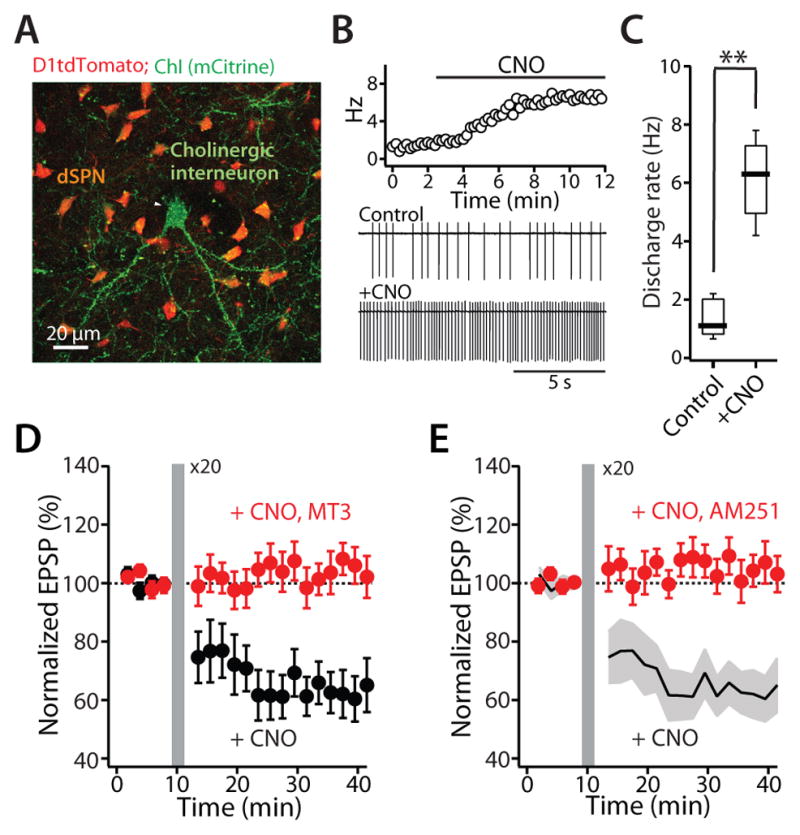
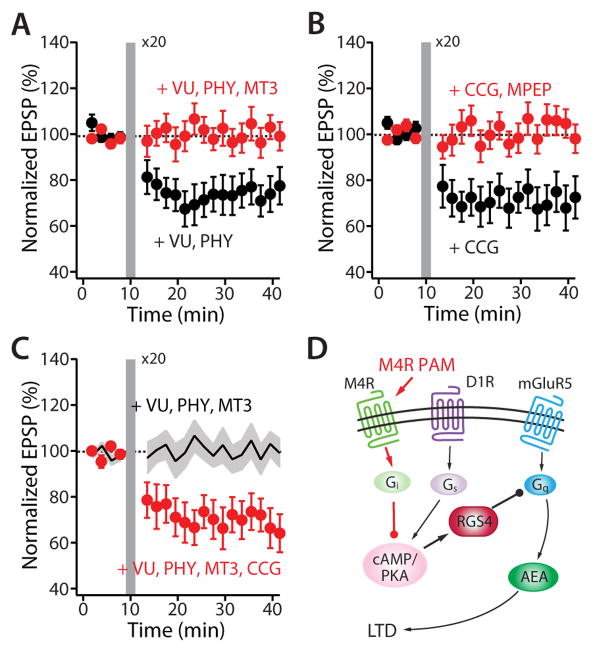
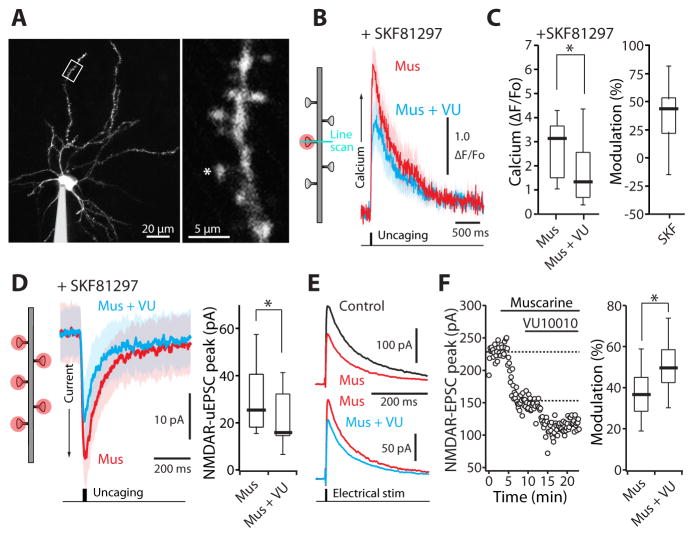
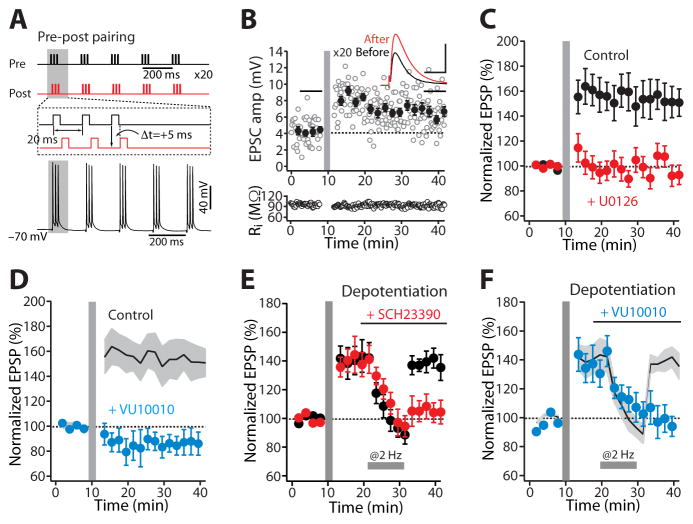
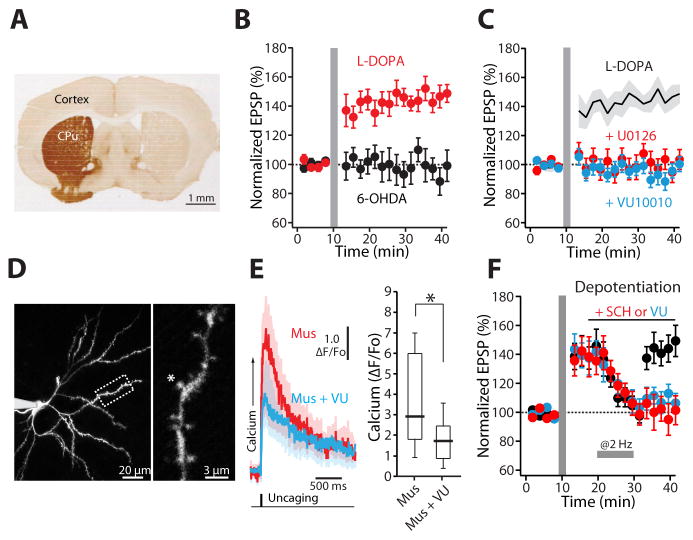
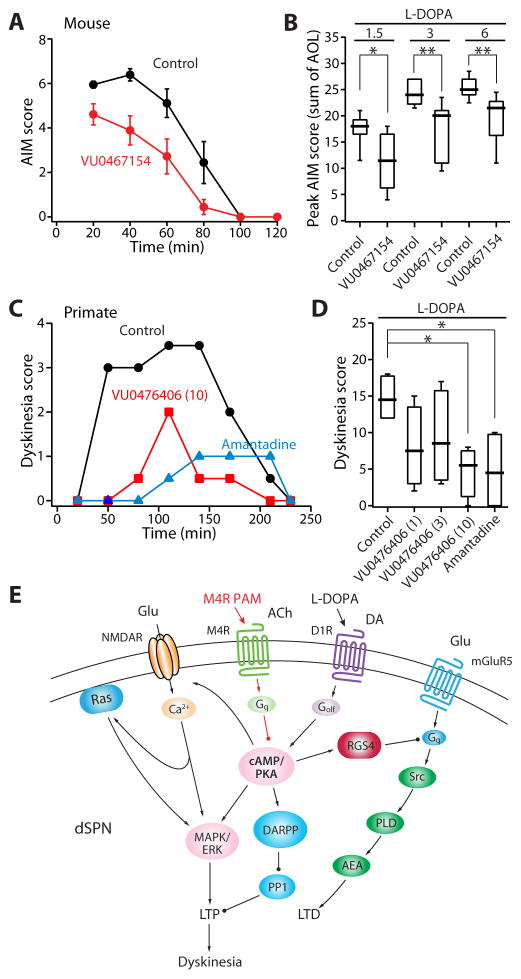
A balanced interaction between dopaminergic and cholinergic signaling in the striatum is critical to goal-directed behavior. But how this interaction modulates corticostriatal synaptic plasticity underlying learned actions remains unclear--particularly in direct-pathway spiny projection neurons (dSPNs). Our studies show that in dSPNs, endogenous cholinergic signaling through M4 muscarinic receptors (M4Rs) promoted long-term depression of corticostriatal glutamatergic synapses, by suppressing regulator of G protein signaling type 4 (RGS4) activity, and blocked D1 dopamine receptor dependent long-term potentiation (LTP). Furthermore, in a mouse model of L-3,4-dihydroxyphenylalanine (L-DOPA)-induced dyskinesia (LID) in Parkinson's disease (PD), boosting M4R signaling with positive allosteric modulator (PAM) blocked aberrant LTP in dSPNs, enabled LTP reversal, and attenuated dyskinetic behaviors. An M4R PAM also was effective in a primate LID model. Taken together, these studies identify an important signaling pathway controlling striatal synaptic plasticity and point to a novel pharmacological strategy for alleviating LID in PD patients.


Figures

Figure 1
Figure 1. M4R signaling promotes induction of LTD at dSPN glutamatergic synapses
(A) The experimental configuration. (B) The post-pre theta-burst pairing protocol for induction of LTD. (C) LTD was not induced by a post-pre timing pairing in dSPNs. Plots show EPSP amplitude (amp) and membrane input resistance (Ri) as a function of time. The dashed line represents the average EPSP amplitude before induction. STDP pairing is indicated by the vertical bar. Filled symbols specify the averages of 12 trials (± SEM). The averaged EPSP traces before and after induction are shown at the top. Scale bars, 2 mV x 80 ms. (D) In the presence of D1R antagonist SCH23390 (3 μM), a post-pre timing pairing revealed LTD; the LTD was disrupted by addition of the selective M4R antagonist MT3 (100 nM). Data are represented as mean ± SEM. Plot of the average EPSP amplitudes as a function of time. (E) With 20 repetitions of the pairing protocol, bath perfusion of VU10010 did not lead to LTD induction. However, when the number of repetitions was increased to 60 in the presence of the M4R PAM, LTD induction was robust. Plot of the average EPSP amplitudes as a function of time. Error bars represent ± SEM. (F) In D1-Cre mice, post-pre pairing led to LTD when VU10010 (5 μM) was bath applied; but the same protocol had no effect on the induction of LTD in D1-M4-KO mice. Data are shown as mean ± SEM. Plot of the average EPSP amplitudes as a function of time (see also Figures S1 and S2).
Figure 2
Figure 2. Elevating endogenous ChI activity with DREADD hM3D(q) enhances dSPN LTD induction
(A) ChAT Cre-dependent expression of DREADD hM3D(q) in ChIs (mCitrine reporter) in D1tdTomato BAC mouse. (B) DREADD cognate ligand CNO (10 μM) increased ChI spontaneous discharge rate recorded in cell-attached patches. (C) Box plot summary of the increase of discharge rate of ChIs. Box plot boxes indicate upper and lower quartiles; whiskers specify upper and lower 90%. **p < 0.01. (D) and (E) Enhancing local cholinergic signaling promoted the induction of LTD at neighboring dSPN glutamatergic synapses. Plot of the average EPSP amplitudes as a function of time. Error bars indicate SEM. The LTD was disrupted by (D) the M4R antagonist MT3 (100 nM) or (E) the CB1R antagonist AM251 (2 μM). Solid line (average) and gray shadow (± SEM) are control LTD from the panel (D) for reference.
Figure 3
Figure 3. M4R regulates dSPN LTD through RGS4 signaling
(A) LTD was induced with fewer (20) repetitions of the post-pre pairing protocol by co-application of the ACh esterase inhibitor physostigmine (PHY; 10 μM) and VU10010 (VU; 5 μM). The induction was blunted in the presence of the M4R antagonist MT3 (100 nM). Plot of normalized EPSP amplitude as a function of time. The dashed line represents the average of EPSP amplitude before induction. STDP induction is indicated by the vertical bar. (B) Intracellular application of the RGS4 specific inhibitor CCG203769 (CCG; 10 μM) promoted the induction of LTD, even in the absence of the M4R PAM VU10010. The LTD was disrupted by the mGluR5 antagonist MPEP (10 μM). Moreover, (C) CCG enhanced LTD induction even in the presence of M4R antagonist. Solid line (average) and gray shadow (± SEM) are the LTD antagonism by MT3 from the panel (A) for reference. Plot of the average EPSP amplitudes as a function of time. Error bars indicate SEM. (D) Schematic showing the proposed signaling pathway through which M4Rs and D1Rs modulate the induction of dSPN LTD (see also Figure S2).
Figure 4
Figure 4. M4R activation on dSPNs inhibits postsynaptic NMDAR-mediated Ca2+ transients and currents
(A) Low (left) and high (right) magnification maximum-intensity projections of a dSPN filled with Alexa Fluor 568. Spine was stimulated with 1 ms uncaging pulse of 720–725 nm light. (B) In the presence of the D1R agonist SKF81297 (3 μM), average NMDAR Ca2+ transients in a distal dSPN spine induced by a single glutamate uncaging pulse were reduced by the M4R PAM VU10010 (5 μM). Solid lines are averages across multiple spines and the shaded areas represent the mean ± SEM. (C) Box plot summary of modulation of NMDAR-mediated Ca2+ transients. (D) Addition of VU 10010 (5 μM) suppressed NMDAR-mediated uEPSC currents triggered by uncaging pulses of 500 Hz to five distal spines. Solid lines are averages across multiple spines and the shaded areas represent the mean ± SEM. (E) NMDAR-mediated EPSCs recorded from dSPNs in the presence of muscarine (3 μM; upper traces) and muscarine + VU10010 (5 μM; lower traces). EPSCs are averages of 10 consecutive trials. (F) Left: time course of EPSC amplitude from the experiment shown in (E). Muscarine and VU10010 were applied during the time indicated by the horizontal bars. Right: box plot sum of M4R mediated modulation of NMDAR currents. All box plot boxes indicate upper and lower quartiles; whiskers specify upper and lower 90%. *p < 0.05 (see also Figure S3).
Figure 5
Figure 5. M4R stimulation blunts LTP induction at dSPN synapses and enables depotentiation
(A) The pre-post theta-burst pairing protocol for induction of LTP. (B) LTP was induced by a pre-post timing pairing in dSPNs. Plots show EPSP amplitude (amp) and membrane input resistance (Ri) as a function of time. The dashed line represents the average EPSP amplitude before induction. The vertical bar indicates STDP induction. Filled symbols specify the averages of 12 trials (± SEM). The averaged EPSP traces before and after induction are shown at the top. Scale bars, 4 mV x 80 ms. (C) LTP induction was disrupted by MEK inhibitor U0126 (10 μM). Plot of the average EPSP amplitudes as a function of time. (D) LTP induction was also blocked by the M4R PAM VU10010 (5 μM). Solid line (average) and gray shadow (± SEM) are control LTP from the panel (C) for reference. (E) Synaptic depotentiation was not induced by LFS (@2 Hz for 10 min) during the time indicated by the horizontal bar. However, pre-perfusion of a D1R antagonist SCH23390 (3 μM) facilitated depotentiation. (F) VU10010 (5 μM) also promoted the reversal of established LTP. Solid line (average) and gray shadow (± SEM) are control from the panel (E) for reference. Error bars represent SEM.
Figure 6
Figure 6. M4R PAM attenuates synaptic plasticity deficits in dSPNs from LID mice
(A) Light microscopic image of a coronal section illustrating the loss of immunoreactivity for tyrosine hydroxylase (TH) after unilateral MFB 6-OHDA lesioning. CPu, caudate-putamen. (B) LTP induction was lost in prolonged 6-OHDA-lesioned animals. Shortly after the last injection of L-DOPA, LTP was recovered in dSPNs. Plot of average EPSP amplitude as a function of time. (C) The LTP was disrupted by U0126 (10 μM) or VU10010 (5 μM). Solid line (average) and gray shadow (± SEM) are LTP from the panel (B) for reference. (D) Low (left) and high (right) magnification maximum-intensity projections of a dSPN filled with Alexa Fluor 568. (E) NMDAR-mediated Ca2+ transients were decreased by addition of VU10010 (5 μM) in dSPNs from LID mice. Solid lines are averages across multiple spines and the shaded areas represent the mean ± SEM. *p < 0.05. (F) In dyskinetic animals, synaptic depotentiation was lost and restored by bath application of SCH23390 (3 μM) or VU10010 (5 μM). Horizontal bar indicates LFS (2 Hz, 10 min). Error bars represent SEM. Box plot boxes specify upper and lower quartiles; whiskers indicate upper and lower 90% (see also Figure S4).
Figure 7
Figure 7. M4R PAMs alleviate dyskinetic behaviors
(A) Plot of sum of mouse AIM scores (n = 9, mean ± SEM) as a function of time. Systemic treatment with VU0467154 (10 mg kg−1) produced a significant overall reduction in AIM scores (time: p < 0.001; group: p < 0.01; interaction: p < 0.01; repeated measure 2-way ANOVA followed by Bonferroni’s post test). (B) Box plot summation shows that VU0467154 attenuates LID behaviors over a range of L-DOPA doses. Mice were treated with ascending doses of L-DOPA combined with either the M4R PAM or its vehicle (n = 9 per group). VU0467154 was effective on each of the three L-DOPA doses (1.5, 3, or 6 mg kg−1), indicated by horizontal bars. Box plot boxes indicate upper and lower quartiles; whiskers specify upper and lower 90%. *p < 0.05; **p < 0.01. (C) Plot of sum of primate dyskinesia scores (median) as a function of time (Fr = 11.64, n = 4; p < 0.01, Friedman’s test). (D) Box plot summary of antidyskinetic effects of VU0476406 (1, 3, or 10 mg kg−1) or amantadine (20 mg kg−1). Systemic administration of VU0476406 (10 mg kg−1) or amantadine (20 mg kg−1) ameliorates dyskinesia scores. *p < 0.05. (E) Proposed signaling model of L-DOPA-induced deficits in dSPN synaptic plasticity and dyskinesia (see also Figures S5, S6 and S7).

Comment in

References

    1. Augustin SM, Beeler JA, McGehee DS, Zhuang X. Cyclic AMP and afferent activity govern bidirectional synaptic plasticity in striatopallidal neurons. J Neurosci. 2014;34:6692–6699. - PMC - PubMed
    1. Belujon P, Lodge DJ, Grace AA. Aberrant striatal plasticity is specifically associated with dyskinesia following levodopa treatment. Mov Disord. 2010;25:1568–1576. - PMC - PubMed
    1. Bernard V, Normand E, Bloch B. Phenotypical characterization of the rat striatal neurons expressing muscarinic receptor genes. J Neurosci. 1992;12:3591–3600. - PMC - PubMed
    1. Bezard E, Ferry S, Mach U, Stark H, Leriche L, Boraud T, Gross C, Sokoloff P. Attenuation of levodopa-induced dyskinesia by normalizing dopamine D3 receptor function. Nat Med. 2003;9:762–767. - PubMed
    1. Blazer LL, Storaska AJ, Jutkiewicz EM, Turner EM, Calcagno M, Wade SM, Wang Q, Huang XP, Traynor JR, Husbands SM, et al. Selectivity and anti-Parkinson’s potential of thiadiazolidinone RGS4 inhibitors. ACS Chem Neurosci. 2015;6:911–919. - PubMed

Publication types

MeSH terms