. 2015 Nov 19;163(5):1191-1203.
doi: 10.1016/j.cell.2015.10.074.

Descending Command Neurons in the Brainstem that Halt Locomotion

Affiliations

Descending Command Neurons in the Brainstem that Halt Locomotion

Julien Bouvier et al. Cell. .

Abstract

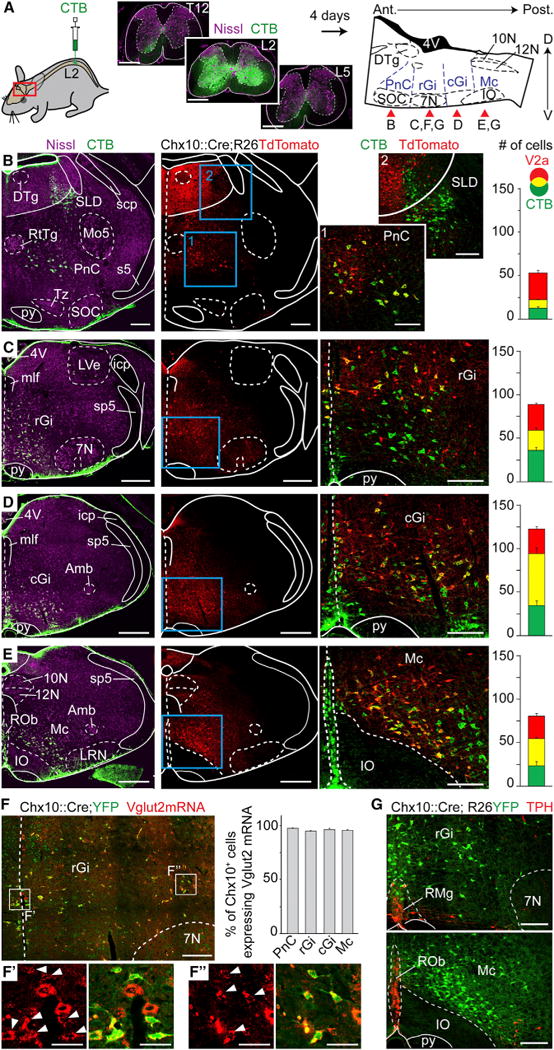
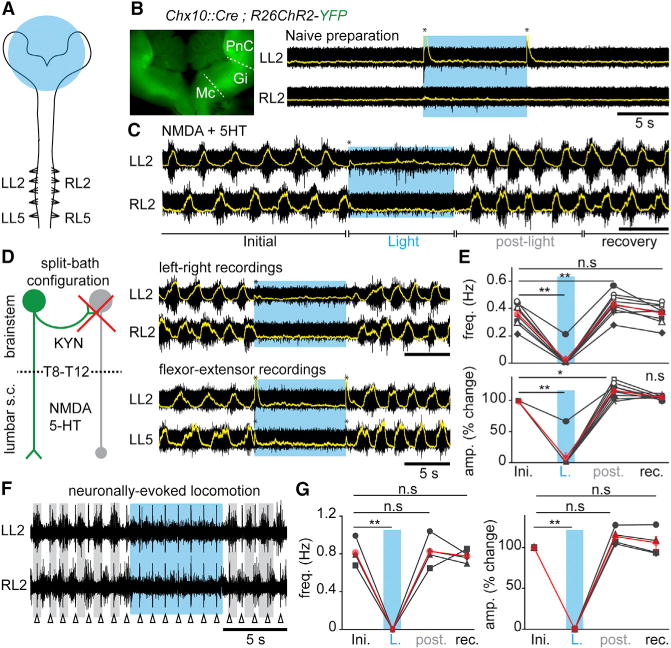
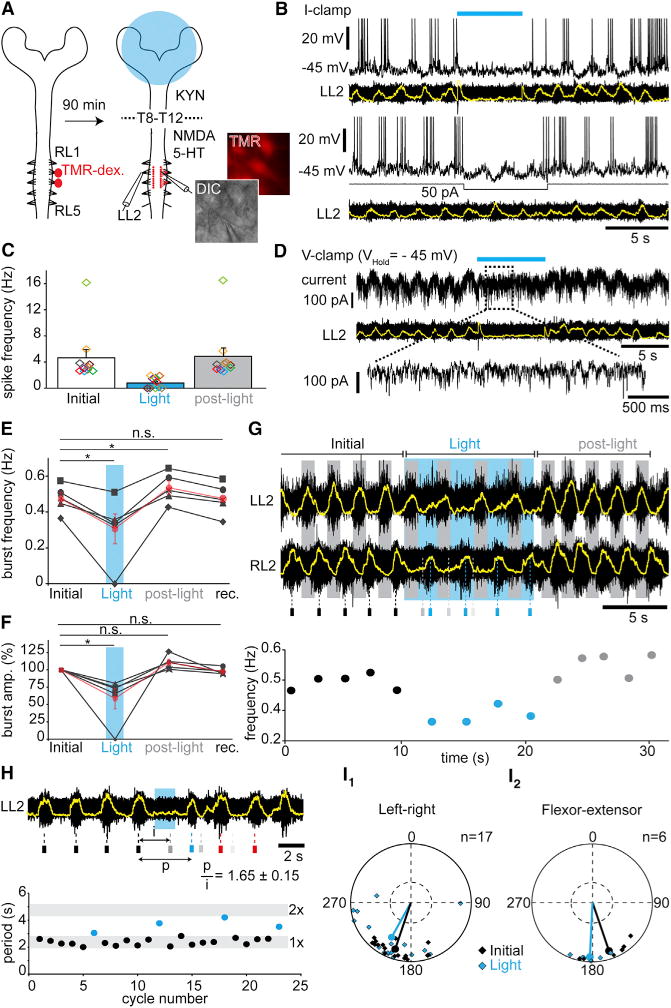
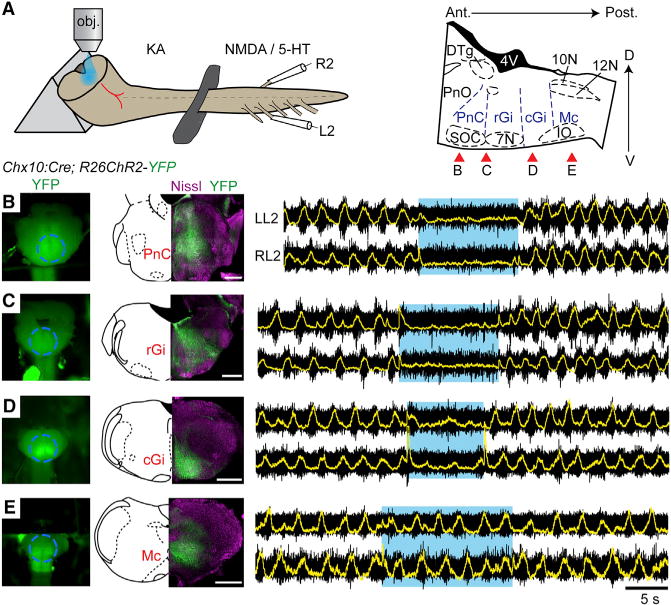
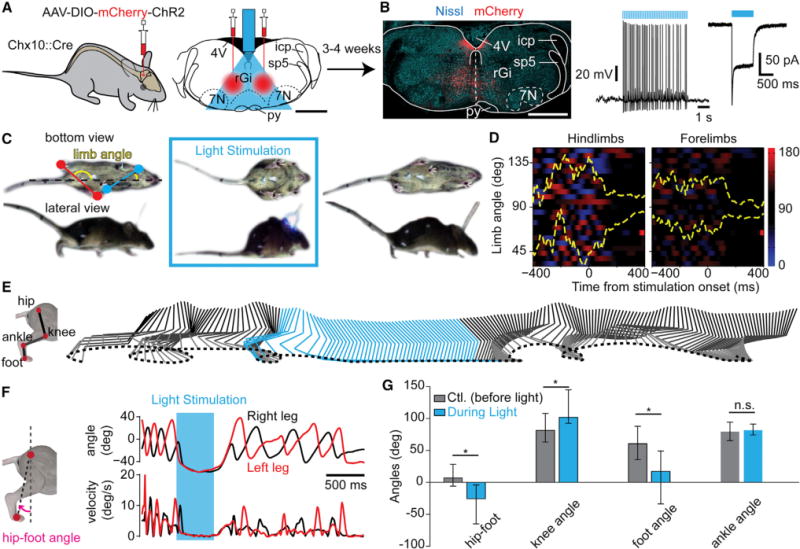
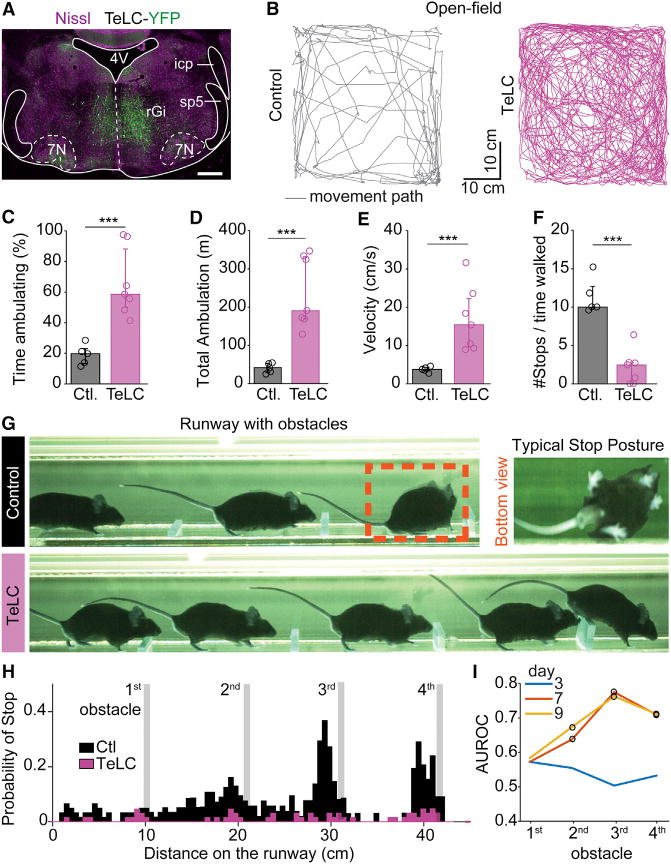
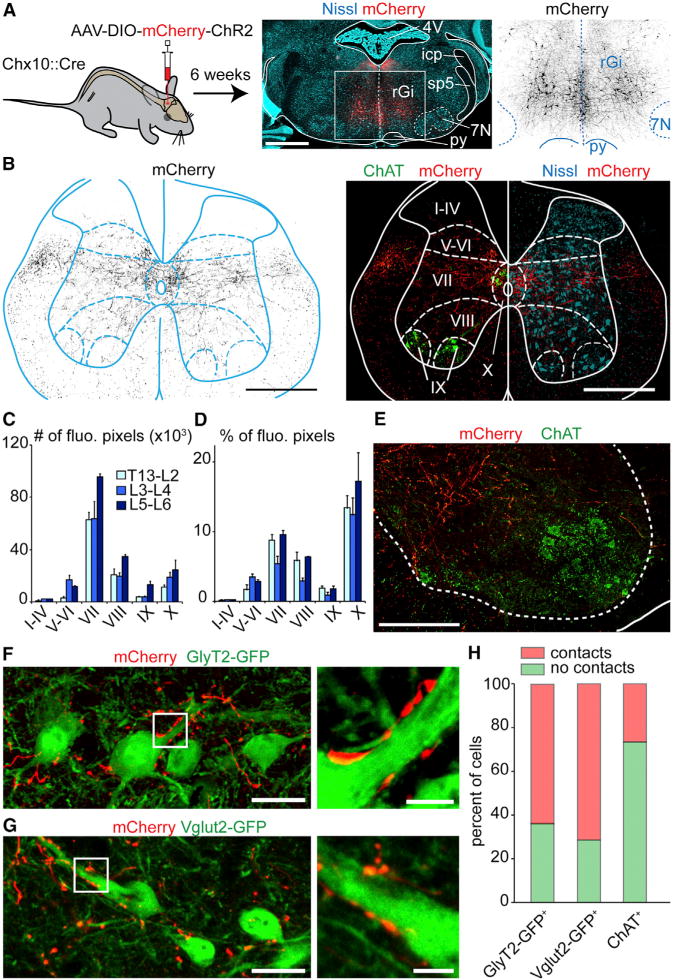
The episodic nature of locomotion is thought to be controlled by descending inputs from the brainstem. Most studies have largely attributed this control to initiating excitatory signals, but little is known about putative commands that may specifically determine locomotor offset. To link identifiable brainstem populations to a potential locomotor stop signal, we used developmental genetics and considered a discrete neuronal population in the reticular formation: the V2a neurons. We find that those neurons constitute a major excitatory pathway to locomotor areas of the ventral spinal cord. Selective activation of V2a neurons of the rostral medulla stops ongoing locomotor activity, owing to an inhibition of premotor locomotor networks in the spinal cord. Moreover, inactivation of such neurons decreases spontaneous stopping in vivo. Therefore, the V2a "stop neurons" represent a glutamatergic descending pathway that favors immobility and may thus help control the episodic nature of locomotion.


Conflict of interest statement

We declare no conflict of interest regarding this work.

Figures

Figure 1
Figure 1. V2a Brainstem Neurons Project to the Lumbar Spinal Cord and Are Excitatory
(A) Bilateral injections of the retrograde marker CTB at the 2nd lumbar segment of the spinal cord (left). To the right is a sagittal schematic of the brainstem indicating the approximate rostrocaudal levels shown in the specified panels (red arrows) where CTB-labeled neurons are detected. (B–E) Transverse hemi-sections at the levels indicated in (A) stained for CTB, Nissl, and V2a neurons (Tdtomato). Right-most pictures are magnifications of the blue boxed area; V2a reticulospinal neurons appear yellow. Bar-graphs show the average number of CTB, V2a, and double-labeled neurons per hemisection (n = 4 animals). Error bars are SEM. (F) Transverse hemi-section in the rGi indicating Vglut2+ glutamatergic (red) V2a neurons (YFP). Bar-graphs show the average percentage of Vglut2+;V2a neurons (n = 3 animals). Insets in F′ and F″ are magnified views of Vglut2 expression alone (left) and merged with YFP (right) of medially-(F′) and laterally positioned (F″) V2a neurons. White arrowheads indicate co-expression. Error bars are SEM. (G) Transverse hemi-sections stained for TPH and V2a neurons (YFP). Note the absence of co-expression (n = 4 animals). Scale bars (in μm): (A): 500, low magnifications in (B)–(E): 500; magnified views in (B)–(G): 200; F′ and F″: 50. Abbreviations used in all figures: 10N: dorsal motor nucleus of vagus; 12N: hypoglossal nucleus; 4V: 4th ventricle; 7N: facial nucleus; Amb: ambiguus nucleus; Gi: gigantocellular reticular nucleus; GiA: gigantocellular reticular nucleus alpha part; icp: inferior cerebellar peduncle; IO: Inferior olive; DTg: laterodorsal tegmental nucleus; LRN: lateral reticular nucleus; LVe: lateral vestibular nucleus; Mc: magnocellular reticular nucleus; mlf: medial longitudinal fasciculus; Mo5: motor trigeminal nucleus; PnC: caudal pontine reticular nucleus; py: pyramidal tract; ROb: raphe obscurus nucleus; RMg: raphe magnus nucleus; RtTg: reticulotegmental nucleus of the pons; s5: sensory root of the trigeminal nerve; scp: superior cerebellar peduncle; SLD: Sublaterodorsal tegmentum; SOC: Superior olivary complex; sp5: spinal trigeminal tract; Tz: nucleus of the trapezoid body. See also Figure S2.
Figure 2
Figure 2. V2a Brainstem Neurons Stop Slow-Frequency Locomotor-like Activity In Vitro
(A) Schematic experimental design for electrophysiological recordings in brainstem-spinal cord preparations from postnatal animals (0–4 days). The area of light stimulation is shown in blue. (B) Inset: ChR2-YFP expression in the “open-book” brainstem preparation. Raw (black) and integrated signals (superimposed in yellow) of L2 ventral roots in normal Ringer solution. Light-activation of brainstem V2a neurons (blue epoch) does not change baseline activity. The transient voltage deflections at light onset and offset (asterisks) are light-mediated artifacts. (C) Similar recordings during locomotor-like activity induced with 5–7 μM NMDA and 8 μM 5-HT. Light-activation of brainstem V2a neurons stops ongoing locomotor-like activity. (D) Left: the possible recruitment by V2a neurons (green) of other inhibitory descending neurons (gray) was blocked by applying KYN onto the brainstem in a split-bath configuration. Right: recordings of the flexor-dominated roots bilaterally (L2, top) and of flexor and extensor (L5)-dominated roots on the same side (bottom). (E) Average per animal (black, n = 9) and grand average among animals (red) of the instantaneous frequency and of the percent change in amplitude of drug-evoked locomotor bursts before (Initial: ini.), during light (L.), for 5 cycles following light offset (post), and for the following 20 s (recovery: rec). (F) Recordings of L2 roots bilaterally in the split-bath configuration during electrical stimulation (1Hz, Δ) at the first cervical segment. Vertical lines are stimulus artifacts. (G) Average per animal (black, n = 4) and grand-average among animals (red) of the instantaneous frequency and of the percent change in amplitude of descending fiber evoked locomotor bursts. In all panels: n.s. indicates non-significant, * indicates p < 0.05 and ** indicates p < 0.01 (paired t test); Error bars in (E) and (G) are SEM.
Figure 3
Figure 3. Light-Activation of Brainstem V2a Neurons Depresses Rhythm-Generating Levels of the Locomotor CPG
(A) Experimental design for labeling and whole-cell recording of lumbar motor neurons. TMR-dex: Tetramethyl-Rhodamine Dextran. (B) L2 motor neuron in current-clamp during drug-evoked locomotor-like activity. V2a neurons’ activation (blue bar) arrests both spiking and underlying membrane oscillations (top), while direct hyperpolarization of the same cell with current injection (bottom) preserves subthreshold oscillations. (C) Average per cell (colored rectangles, n = 10) and grand-average among cells (bar-graphs) of the instantaneous spiking frequencies of lumbar motor neurons before (initial), during (Light) and after (post-light) light-activation. (D) Same cell as in (B) recorded in voltage-clamp. Light-activation induces a loss of rhythmic currents. (E–F) Average per animal (n = 5) and grand-average among animals (red) of the instantaneous frequency (E) and of the percent changes in amplitude (F) of L2 locomotor bursts on preparations facing high NMDA concentrations (> 8 μM). * indicates p < 0.05 (paired t test). (G) Typical L2 ventral root recording during high-frequency locomotor-like activity (~0.5 Hz). Small rectangles below indicate the time of peak of the control RL2 bursts (black), and their forecasted (gray) and actual occurrences (blue) during light activation of brainstem V2a neurons, showing a non-graded slowing of the rhythm. Below is plotted the corresponding instantaneous frequency of RL2 bursts. (H) L2 ventral root recording during drug-evoked locomotor-like activity. The expected burst is silenced (gray bar below) and the rhythm reset by short light-pulse, as seen by the perturbed period (p) not falling in the range of twice the initial period (i). The graph below illustrates initial (black) and perturbed periods (blue) for four consecutive trials. (I) Circular plot showing the left-right (I1) or flexor-extensor (I2) phase-relationships for individual trials and for the mean preferred phase among all trials before (Initial, black) and during (Light, blue) light-activation. Phase values falling in the bottom-half of the outer circles indicate alternation. There is no significant difference between control and light conditions (Watson-William’s test p > 0.05). See also Figure S3 and S4. Error bars in (C), (E), and (F) are SEM.
Figure 4
Figure 4. V2a Stop Neurons Reside in the Rostral Gigantocellularis and Caudal Pontine Reticular Nuclei
(A) Experimental set-up. The brainstem is sectioned transversally to expose a given transverse plane to the light. Red arrows on the right indicate approximate levels of the sections performed in (B)–(E). (B–E) Simultaneous electrophysiological recordings of L2 roots on either side after a section exposing the PnC (B) and of the same preparation after having removed the PnC (C), and the rGi (D) or cGi (E). The ability of light stimulation to stop ongoing locomotion is lost when only the caudal-most medullary formation remains. The transient voltage deflections visible on the integrated traces at light onset and offset are light-mediated artifacts. Scale bar, 500 μm
Figure 5
Figure 5. Optogenetic Activation of Brainstem V2a Neurons Halts Locomotion in Freely-Moving Mice
(A) Scaled reconstruction of the implantation and illumination range following the bilateral viral injection in the rGi. (B) Transverse section showing mCherry expression (red) at the injection site. To the right is a mCherry+ neuron recorded in a transverse slice under synaptic isolation. (C) Detoured snapshots of a freely-moving Chx10∷Cre mouse 4 weeks post-injection before (left), during (center), and after (right) light-stimulation using pulsed blue light. The limb angle is defined as the angle between a line joining the two hindpaws (red) or forepaws (blue), with respect to the midline of the animal. (D) Color plot of hindlimbs’ and forelimbs’ angles 400 ms before and after light onset. The y axis represents 23 trials from seven animals. A gradient of color to red indicates positive angle (left limb behind the right limb), to blue indicates the reverse (right limb behind left limb), and black indicates perpendicular limbs to the body axis. In yellow are shown the 25 and 75 percentile of the distribution of the angle oscillations over time. Independently of the speed before stimulation, light activation of transfected V2a neurons stopped ongoing locomotion and animals remained in a stereotypical position with the limb perpendicular to the body axis (90°). (E) Kinematic representation of the relative movements of the hip, knee, ankle, and foot of one animal before (gray) and during (blue) light activation. Movements stopped in response to light and resumed upon light offset. (F) Evolution of the hip-foot angle (pink) as a function of time (top) and corresponding relative velocities (bottom). Light-activation led to a configuration where the foot was kept ahead of the hip. (G) Average (n = 7 mice) of the hip-foot, knee, foot, and ankle angles 400 ms before (gray) and during (blue, from 100 ms to 500 ms after light onset) light-activation of V2a neurons. Asterisks indicate significant different values (p < 0.05, U test for circular data). Error bars are 25–75 percentiles. Scale bar, 1 mm (A, B). See also Figure S5.
Figure 6
Figure 6. Blocking Synaptic Output from V2a Stop Neurons Increases Mobility
(A) Transverse brainstem section showing the expression of an AAV1/2-FLEX-TeLC-eYFP-WPRE virus following injection in the rGi bilaterally in a Chx10∷Cre animal. (B) Traces of movements for 10 min in an open field test 7 days after the injection of saline (control, left) or the TeLC virus (right). (C) Averages from individual animals (open circles) and grand-average among all individuals (bargraphs) of the percent time spent ambulating for controls (gray, n = 5) and TeLC-treated (pink, n = 8) subjects. Error bars are 25–75 percentiles. In all panels *** indicates p < 0.005 (U test). (D–F) Similar quantifications for (D) the total distance achieved while ambulating, (E) the average velocity of ambulation, and (F) the relative number of stops to the time spent ambulating. (G) Snapshots of a Chx10∷Cre mouse 9 days post-injection of saline (control, top) or TeLC virus (bottom) in the rGi. The control animal shown spontaneously halts before the 3rd obstacle and adopts a stereotypical stopping position, while the TeLC-treated animal does not stop at any obstacle (see also Movie S3). (H) Summary of the probability of stop for saline-(n = 6, black) or TeLC-injected (n = 8, pink) mice, after 9 days. Controls stopped with higher probability on the 3rd and 4th obstacles (p < 0.05, Kruskal-Wallis, Bonferroni correction for multiple comparisons) than TeLC-treated animals. (I) Direct comparison of the probability of stop before each obstacle between controls and TeLC mice. AUROC index gauges the difference between conditions where 0.5 indicates no difference while values toward zero or one indicate that the probability curves are different. Circles indicate significant differences (p < 0.05). See also Figure S6.
Figure 7
Figure 7. V2a Stop Neurons Terminate Predominantly in Lamina VII of the Lumbar Spinal Cord
(A) Bilateral injections of a Cre-dependent AAV-hChR2-mCherry-virus (middle: red; right: black) in the rGi of Chx10∷Cre animals. (B) Transverse L2 spinal cord section of the same animal showing transfected V2a processes (black on the left, red on the right). Rexed’s laminae are delineated using ChAT and Nissl staining. (C–D) Quantification in one animal of the number (C) or the percent (D) of fluorescent pixels in each lamina at the upper (T13-L1-L2), intermediate (L3–L4), and caudal (L5–L6) lumbar levels. (E) Magnified view of the descending V2a innervation (red) in the vicinity of ChAT+ motor neurons (green). (F, G) Similar anterograde labelings on a Chx10∷Cre; GlyT2-GFP (E) or Chx10∷Cre; Vglut2-GFP animal (F) showing putative V2a contacts (red) onto glycinergic and glutamatergic neurons, respectively. (H) Percent of glycinergic (232 cells), glutamatergic (105 cells), and motor neurons somatas (124 cells) exhibiting no (green) or more than one (red) putative V2a contact. Scale bars (in μm): (A): 1000, (B): 500, (E): 200, (F, G): 25, insets in (F,G): 5; Error bars in (C) and (D) are SEM; See also Figure S7.

References

    1. Al-Mosawie A, Wilson JM, Brownstone RM. Heterogeneity of V2-derived interneurons in the adult mouse spinal cord. Eur J Neurosci. 2007;26:3003–3015. - PubMed
    1. Alvarez FJ, Fyffe RE. The continuing case for the Renshaw cell. J Physiol. 2007;584:31–45. - PMC - PubMed
    1. Andersson LS, Larhammar M, Memic F, Wootz H, Schwochow D, Rubin CJ, Patra K, Arnason T, Wellbring L, Hjälm G, et al. Mutations in DMRT3 affect locomotion in horses and spinal circuit function in mice. Nature. 2012;488:642–646. - PMC - PubMed
    1. Azim E, Jiang J, Alstermark B, Jessell TM. Skilled reaching relies on a V2a propriospinal internal copy circuit. Nature. 2014;508:357–363. - PMC - PubMed
    1. Bellardita C, Kiehn O. Phenotypic characterization of speed-associated gait changes in mice reveals modular organization of locomotor networks. Curr Biol. 2015;25:1426–1436. - PMC - PubMed

Publication types

Substances