. 2015 Nov 23:5:16950.
doi: 10.1038/srep16950.

Structure of human carbamoyl phosphate synthetase: deciphering the on/off switch of human ureagenesis

Affiliations

Structure of human carbamoyl phosphate synthetase: deciphering the on/off switch of human ureagenesis

Sergio de Cima et al. Sci Rep. .

Abstract

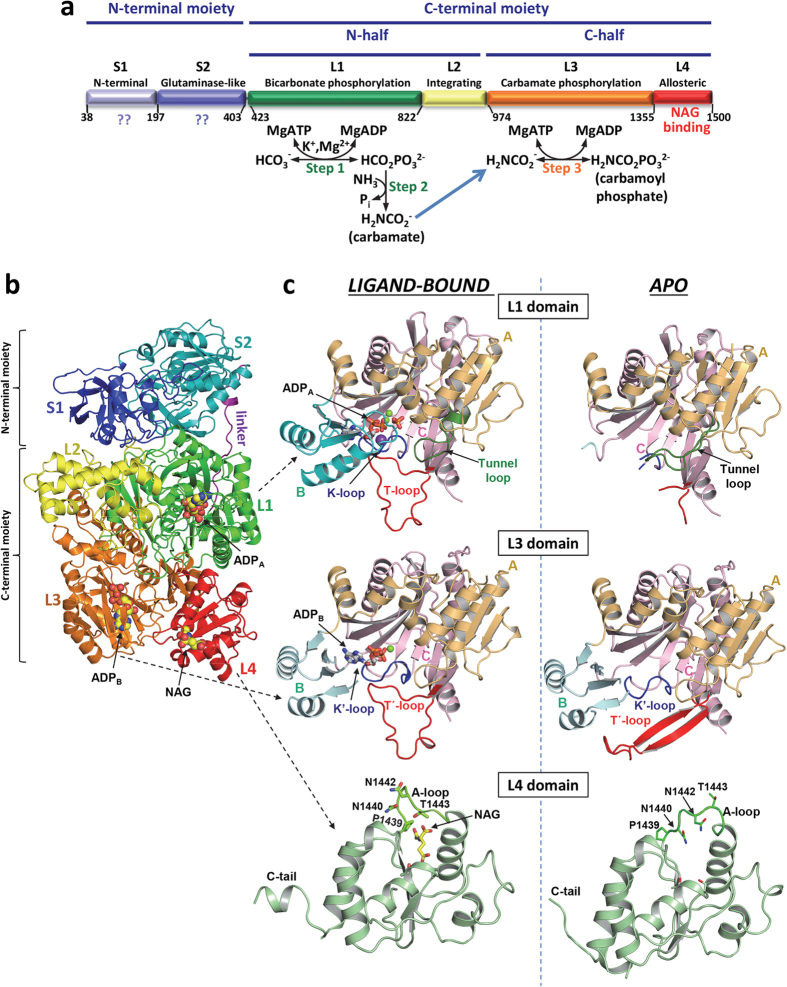
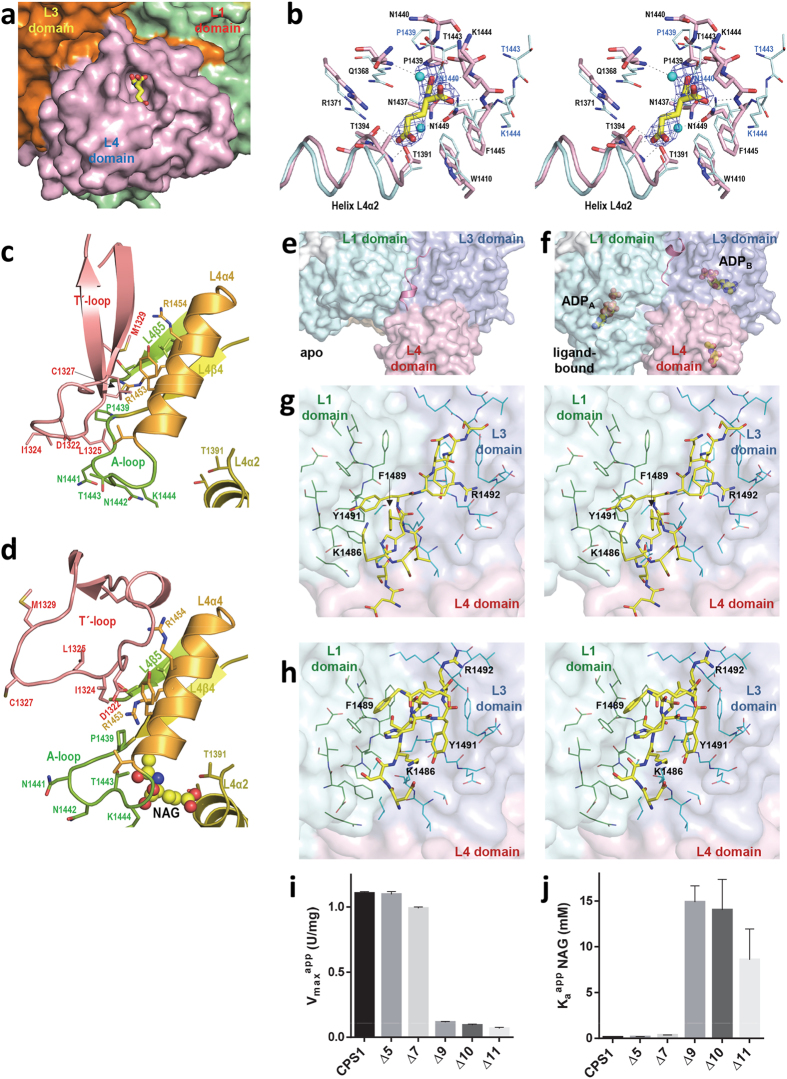
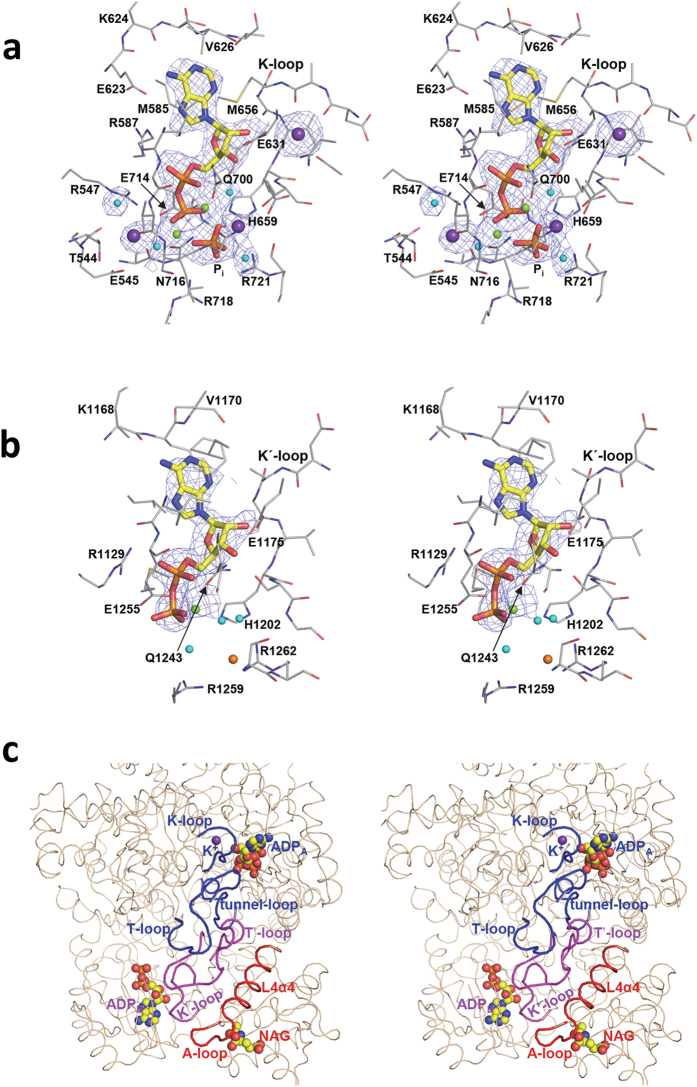
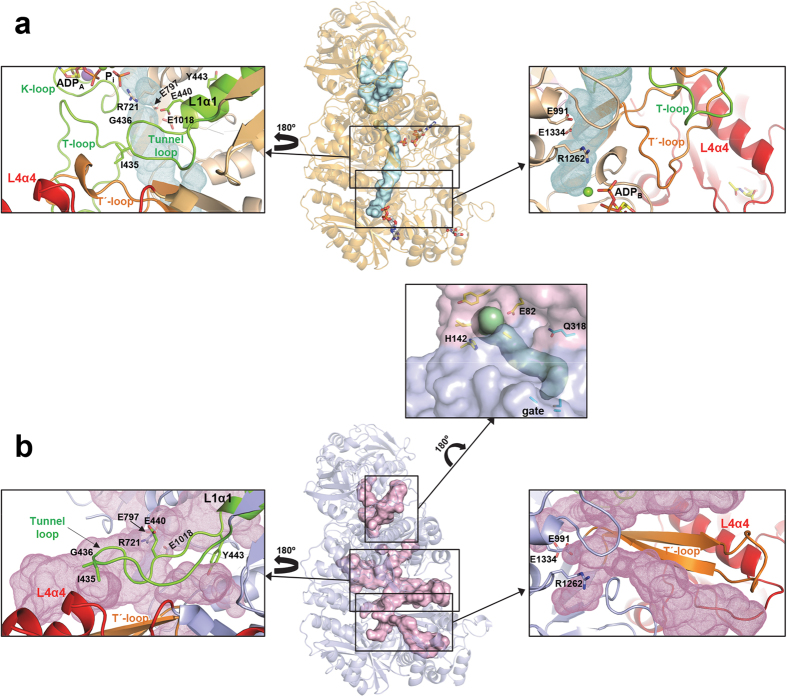
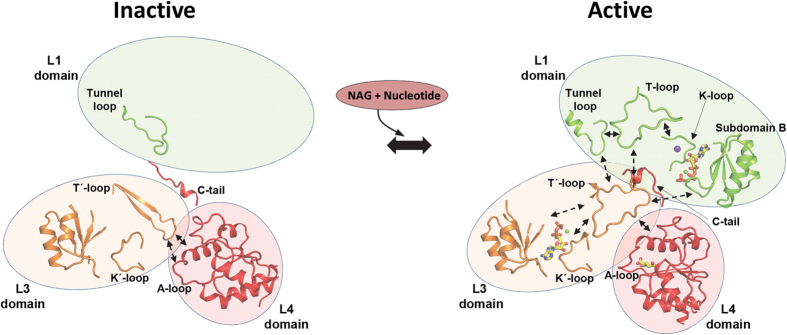
Human carbamoyl phosphate synthetase (CPS1), a 1500-residue multidomain enzyme, catalyzes the first step of ammonia detoxification to urea requiring N-acetyl-L-glutamate (NAG) as essential activator to prevent ammonia/amino acids depletion. Here we present the crystal structures of CPS1 in the absence and in the presence of NAG, clarifying the on/off-switching of the urea cycle by NAG. By binding at the C-terminal domain of CPS1, NAG triggers long-range conformational changes affecting the two distant phosphorylation domains. These changes, concerted with the binding of nucleotides, result in a dramatic remodeling that stabilizes the catalytically competent conformation and the building of the ~35 Å-long tunnel that allows migration of the carbamate intermediate from its site of formation to the second phosphorylation site, where carbamoyl phosphate is produced. These structures allow rationalizing the effects of mutations found in patients with CPS1 deficiency (presenting hyperammonemia, mental retardation and even death), as exemplified here for some mutations.


Figures

Figure 1
Figure 1. Structure of human CPS1.
(a) Scheme of the mature CPS1 polypeptide, indicating its two moieties (top), which are homologous to the small and large subunits of CPS from E. coli. Also indicated are the two sequence-related halves of the large moiety (middle). Domain composition with names and boundaries, given as residue numbers, is indicated in the lower bar. The three steps of the CPS1 reaction are shown below the corresponding domains where they occur. The blue arrow indicates carbamate migration between the phosphorylation active centers, a process contributed mainly by residues from both phosphorylation domains. (b) Cartoon representation of the CPS1 monomer, with domains shown in different colors, and labeled. The structure depicted corresponds to the ligand-bound conformation. The two ADPs and NAG molecules found bound to CPS1 are shown in space-filling representation. In (c), domains L1, L3 and L4 are shown expanded, in the ligand-bound (left) and apo (right) forms. In L1 and L3 the three subdomains A, B and C, and important loops mentioned in the text are labeled and represented with different colors. In the L4 domain some residues from the A-loop are shown (as sticks) to highlight the large structural changes of these side chains when NAG is bound. The ADP molecules, a phosphate and NAG are shown in rods representation, magnesium ions are shown as green spheres and the potassium ion bound to the K-loop is shown as a violet sphere.
Figure 2
Figure 2. The allosteric L4 domain.
(a) View of NAG bound in its binding pocket in the L4 domain, not far from the interface with the L3 domain. (b) Stereo view of the superposition of the NAG site of the apo (carbon atoms colored cyan) and ligand-bound (protein and NAG carbon atoms colored pink and yellow, respectively) forms, identifying the residues by labeling them. When the position of one residue changes much, the residue is labeled in blue for the apo form. The unbiased (Fo-Fc) omit electron density map obtained prior to building the ligand is shown as a blue grid contoured at 2σ. (c,d) Helix L4α4 and some adjacent regions of the L4 domain and the T′-loop from domain L3 are shown, in the (c) apo and (d) ligand-bound forms. NAG is shown in spheres representation. The side-chains of some residues are shown in sticks representation and some secondary structure elements and residues are identified by labeling in the same color as the structural element to which they belong. (e,f) C-tail from domain L4 interacting with neighbor domains L1 and L3, in the apo and ligand-bound forms, and (g,h) respective close-up stereo-views of (e,f) with some residues labeled to highlight the radical changes of both the C-tail structure and their interactions with neighbor domains. (i,j) Influence of C-terminal truncations of the indicated length (Δn denotes the number of deleted residues starting from the C-terminus) on (g) the activity of the enzyme at saturation of NAG (Vmaxapp), and on (h) the concentration of NAG (KaappNAG) needed for attaining an activity of 0.5 × Vmaxapp. CPS1 denotes the wild-type enzyme.
Figure 3
Figure 3. Stereo views of the binding sites for the two molecules of the nucleotide that are used in the reaction, and for the loop system used in signal transmission.
ADP binding in domains L1 (a) and L3 (b). Protein and ADP and phosphate are shown in sticks representation (carbon atoms in grey for the protein and in yellow for the ligands). The lone phosphate is labeled Pi. Potassium, magnesium, chloride ions and water molecules are spheres colored purple, green, orange and cyan, respectively. The (Fo-Fc) electron density maps, computed without the ligands, are shown as a blue grid contoured at 2σ. (c) Close up of the structure of the majority of the C-terminal moiety, to show the binding of both ADP molecules and of NAG and to highlight the relations of helix L4α4 and of the loops more centrally involved in signal transmission. Whereas the overall structure is in brown thin string, the highlighted elements are in thicker string and are labeled, with red, magenta and blue coloring depending on whether they belong to L4, L3 or L1, respectively.
Figure 4
Figure 4. Tunnels and cavities in CPS1.
Overall views (center) of tunnels and cavities (surface representation) in (a) the ligand-bound and (b) the apo forms of CPS1. The carbamate tunnel linking the two phosphorylation active sites (see text) is well defined only in the ligand-bound conformation. Boxes at both sides show detailed views of the structural elements forming the carbamate tunnel. The tunnel loop (colored green) and the T′-loop (colored orange) occlude in the ligand-bound form many of the cavities found in the apo form. Some side chains are explicitly shown to highlight the structural changes. A possible ammonia tunnel, which remains invariant between the apo and ligand bound forms, is depicted in the central box. Residues at the entrance to this tunnel and at the conserved gate are shown with carbon atoms colored yellow and cyan, respectively.
Figure 5
Figure 5. Scheme of CPS1 activation.
Schematic representation of the structural changes and interactions (indicated as double dashed arrows) between the different elements involved in the activation of CPS1 upon binding of NAG and the nucleotide. Ligands are shown in sticks representation. Binding of NAG alters the A-loop, which in the apo form interacts with the T′-loop from the L3 domain. This loop experiences a radical reorganization between the apo and ligand-bound forms. The T′-loop interacts also with the T-loop (from the L1-domain) influencing both ATP binding sites mainly through their interaction with the K′- and K-loops, respectively. These changes together with the remodeling of the tunnel-loop and reorientations between domains result in the building of a functional carbamate tunnel. Stabilization of the modified architecture is achieved through the C-tail fixing the relative orientations of domains L1, L3 and L4.

References

    1. Cohen P. P., Hall L. M. & Metzenberg R. L. Isolation and characterization of a naturally occurring stimulator of citrulline biosynthesis. Nature 178, 1468–1469 (1956). - PubMed
    1. Rubio V., Ramponi G. & Grisolia S. Carbamoyl phosphate synthetase I of human liver. Purification, some properties and immunological cross-reactivity with the rat liver enzyme. Biochim. Biophys. Acta, 659, 150–160 (1981). - PubMed
    1. Bachmann C., Colombo J. P. & Jaggi K. N-acetylglutamate synthetase (NAGS) deficiency: diagnosis, clinical observations and treatment. Adv. Exp. Med. Biol. 153, 39–45 (1982). - PubMed
    1. Brusilow S. W. & Horwich A. L. Urea cycle enzymes. In Scriver C. R., Beaudet A. L., Sly W. S. & Valle D., editors; Child, B., Kinzler, K. W. & Vogelstein, B., associated editors. The Metabolic and Molecular Bases of Inherited Disease. 8th edition. New York, McGraw-Hill. Vol 2, pp 1909–1963 (2001).
    1. Stewart P. M. & Walser M. Short term regulation of ureagenesis. J. Biol. Chem. 255, 5270–5280 (1980). - PubMed

Publication types

MeSH terms

LinkOut - more resources