. 2015 Nov 23:5:16963.
doi: 10.1038/srep16963.

MIG-seq: an effective PCR-based method for genome-wide single-nucleotide polymorphism genotyping using the next-generation sequencing platform

Affiliations

MIG-seq: an effective PCR-based method for genome-wide single-nucleotide polymorphism genotyping using the next-generation sequencing platform

Yoshihisa Suyama et al. Sci Rep. .

Abstract

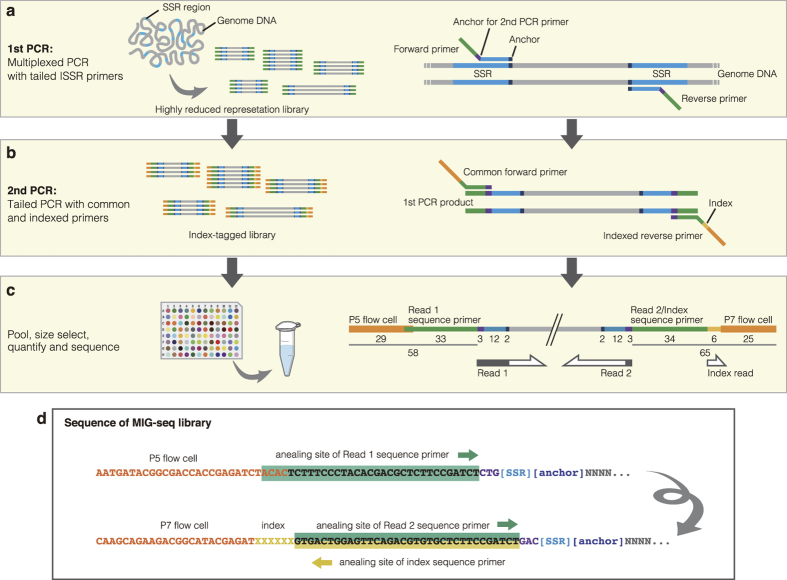
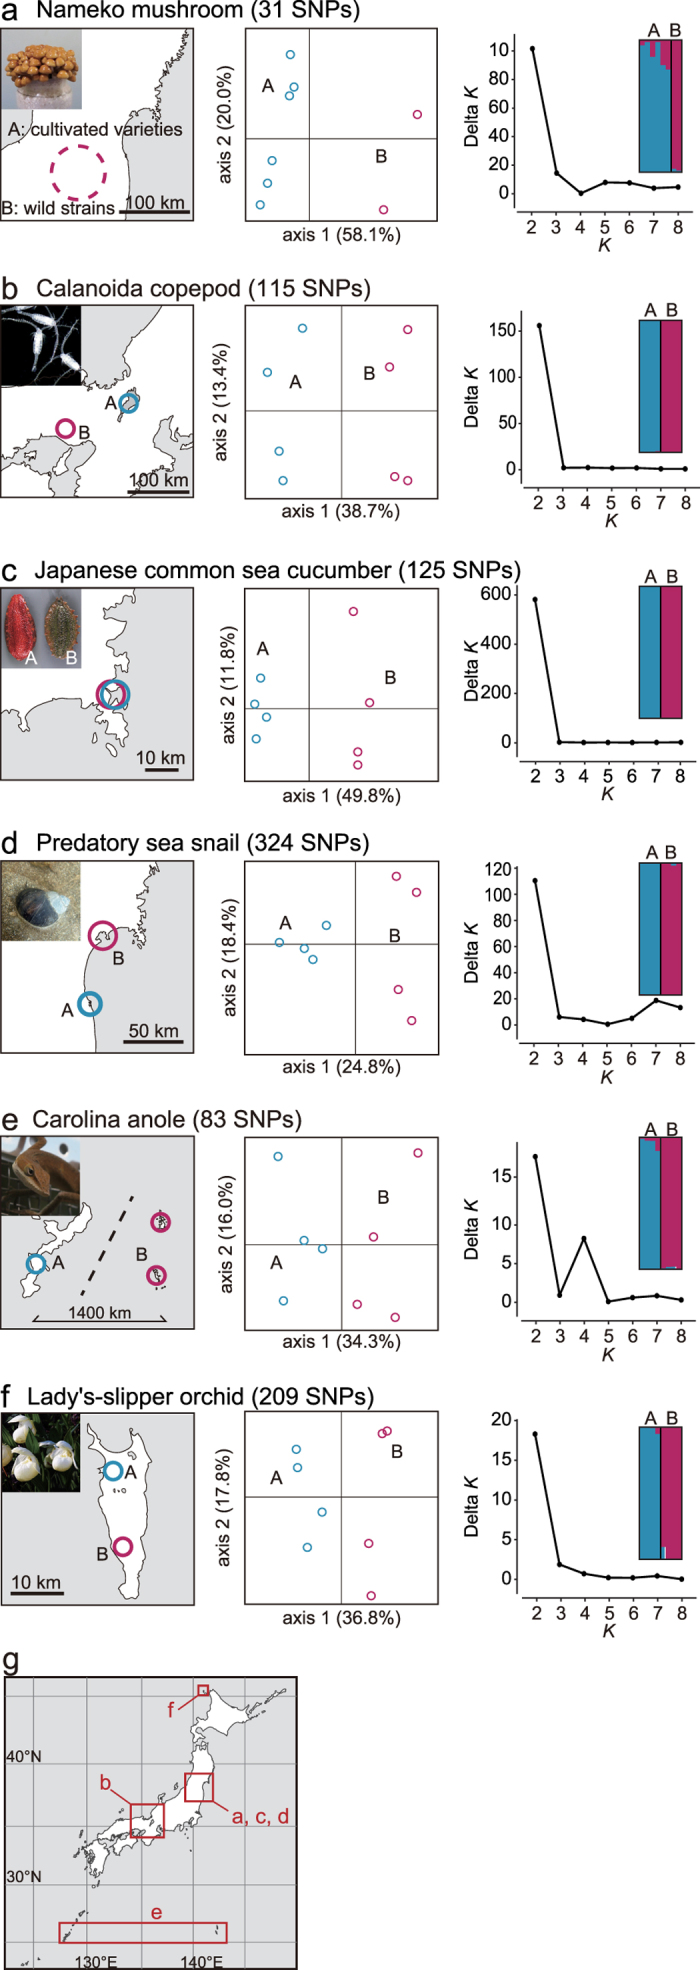
Restriction-enzyme (RE)-based next-generation sequencing methods have revolutionized marker-assisted genetic studies; however, the use of REs has limited their widespread adoption, especially in field samples with low-quality DNA and/or small quantities of DNA. Here, we developed a PCR-based procedure to construct reduced representation libraries without RE digestion steps, representing de novo single-nucleotide polymorphism discovery, and its genotyping using next-generation sequencing. Using multiplexed inter-simple sequence repeat (ISSR) primers, thousands of genome-wide regions were amplified effectively from a wide variety of genomes, without prior genetic information. We demonstrated: 1) Mendelian gametic segregation of the discovered variants; 2) reproducibility of genotyping by checking its applicability for individual identification; and 3) applicability in a wide variety of species by checking standard population genetic analysis. This approach, called multiplexed ISSR genotyping by sequencing, should be applicable to many marker-assisted genetic studies with a wide range of DNA qualities and quantities.


Figures

Figure 1
Figure 1. Construction of the MIG-seq library.
(a) Multiple non-repetitive regions from various inter-simple sequence repeats (ISSRs) are amplified from genomic DNA by multiplexed PCR with tailed ISSR primers (1st PCR). (b) The 1st PCR products are subsequently used as the templates for the 2nd PCR (tailed PCR). This step enables the addition of complementary sequences for the binding sites of Illumina sequencing flow cell and indices (barcodes) for each sample to the 1st PCR products, using common forward and indexed reverse primers. (c) After measuring the approximate concentration of each 2nd PCR product, they are pooled in equimolar concentrations as a single mixture library. The mixture is then purified, fragments with a size range of 300–800 bp are isolated, the final concentration is measured by quantitative PCR, and is then used for Illumina paired-end sequencing (reads 1 and 2) and index reading. Sequencing of the first 17 nucleotides (primer region) of read 1, and 3 nucleotides (anchor region) of read 2 are skipped using the ‘DarkCycle’ option of the sequencer (indicated as the gray region in the arrows). (d) The sequence of the resulting library consists of binding sites for the P5 flow cell oligonucleotides and read 1 sequencing primer, forward ISSR primer, DNA insert, reverse ISSR primer, binding sites for read 2 and index sequencing primers, and P7 flow cell oligonucleotides.
Figure 2
Figure 2. An example of clone identification by MIG-seq analysis.
(a) Spatial distribution of 18 ramets (samples) and three clonal groups (genets, enclosed by dotted line) of Sasa palmata in the Kawatabi Field Science Center, Tohoku University (the main building is indicated on the map), inferred from 144 SNP markers discovered by MIG-seq analysis. Circles indicate the sampling site of each ramet in the distribution area (dark gray) of the species. White and light-gray areas indicate cultivated fields and conifer plantations, respectively. White and blue circles indicate ramets in an inferred clone and ramets from different clones, respectively. The map was generated by YM using Adobe Illustrator CC 2015 version 19.1.0 (Adobe Systems, San Francisco, CA, USA). (b) Matrix of the differences between pairwise numbers of SNPs in the 144 SNP markers among 18 samples of the species. White and blue columns indicate pairs of inferred clones with a small number of different SNPs (0–6) and ramets from different clones with large numbers of different SNPs (27–71), respectively. (c) Histogram showing the frequency distribution of the differences between the pairwise numbers of SNPs in the 144 SNP markers among 18 samples of the species. White and blue bars show the first peak represented by pairs of inferred clones, and the second peak is represented by pairs of ramets from different clones, respectively.
Figure 3
Figure 3
Examples of population genetic analysis based on MIG-seq for eight samples from two different populations (sources) each of six species: (a) nameko mushroom (Pholiota microspora); (b) Calanoida copepod (Eodiaptomus japonicus); (c) Japanese common sea cucumber (Apostichopus japonicus); (d) predatory sea snail (Laguncula pulchella); (e) Carolina anole (Anolis carolinensis); (f) lady’s-slipper orchid (Cypripedium macranthos var. rebunense). Sampling locations (left), plots of principal coordinate analysis (center), estimation of the optimum number of clusters (K, right), and proportion of the membership coefficient of eight samples in the STRUCTURE analysis (upper right) are shown. (g) Their sampling areas on a large-scale map are also shown. The map was based on the blank map available from Geospatial Information Authority of Japan and modified by YM using Adobe Illustrator CC 2015 version 19.1.0 (Adobe Systems). Photos by Manami Kanno (a,c), Wataru Makino (b), Jotaro Urabe (d), and Yoshihisa Suyama (e,f).

Similar articles

Cited by

References

    1. Davey J. W. et al. Genome-wide genetic marker discovery and genotyping using next-generation sequencing. Nat. Rev. Genet. 12, 499–510 (2011). - PubMed
    1. Altshuler D. et al. An SNP map of the human genome generated by reduced representation shotgun sequencing. Nature 407, 513–516 (2000). - PubMed
    1. Miller M. R. et al. Rapid and cost-effective polymorphism identification and genotyping using restriction site associated DNA (RAD) markers. Genome Res. 17, 240–248 (2007). - PMC - PubMed
    1. Van Tassell C. P. et al. SNP discovery and allele frequency estimation by deep sequencing of reduced representation libraries. Nat. Methods 5, 247–252 (2008). - PubMed
    1. Baird N. A. et al. Rapid SNP discovery and genetic mapping using sequenced RAD markers. PLoS ONE 3, e3376 (2008). - PMC - PubMed

Publication types

MeSH terms