. 2015 Nov 5;60(3):475-86.
doi: 10.1016/j.molcel.2015.09.013. Epub 2015 Oct 22.

Functional Dynamics within the Human Ribosome Regulate the Rate of Active Protein Synthesis

Affiliations

Functional Dynamics within the Human Ribosome Regulate the Rate of Active Protein Synthesis

Angelica Ferguson et al. Mol Cell. .

Abstract

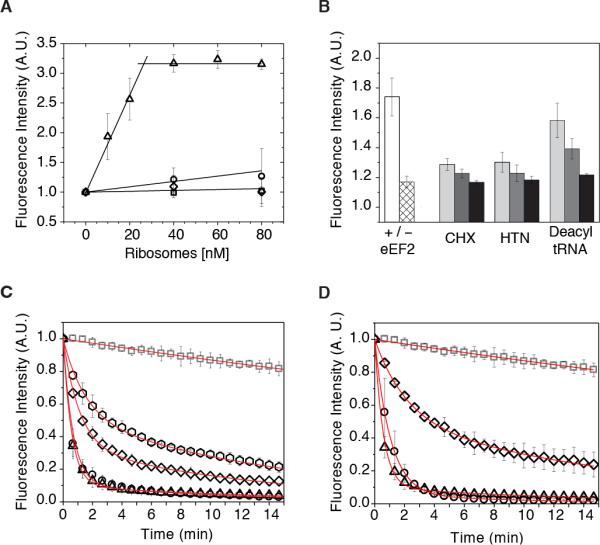
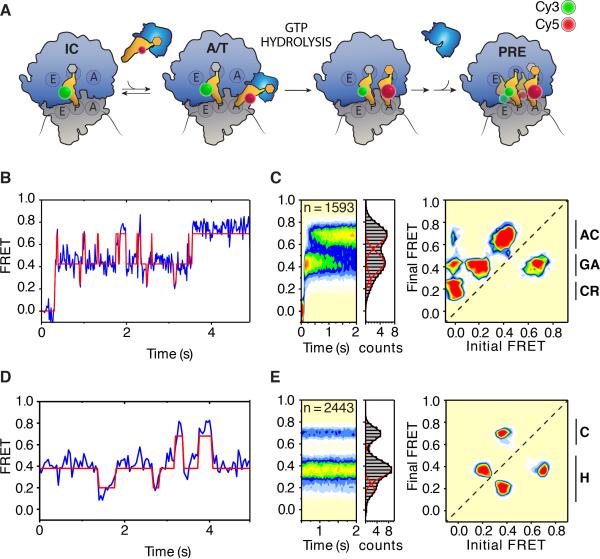
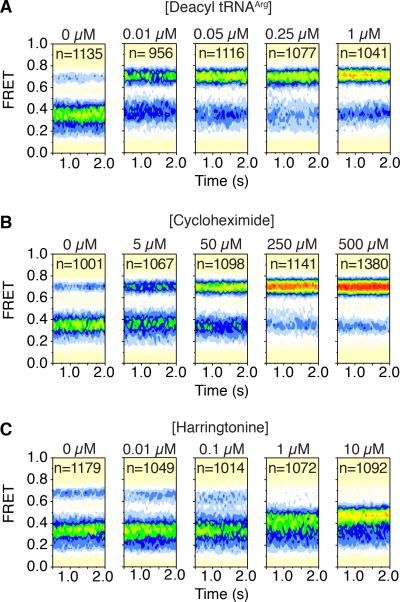
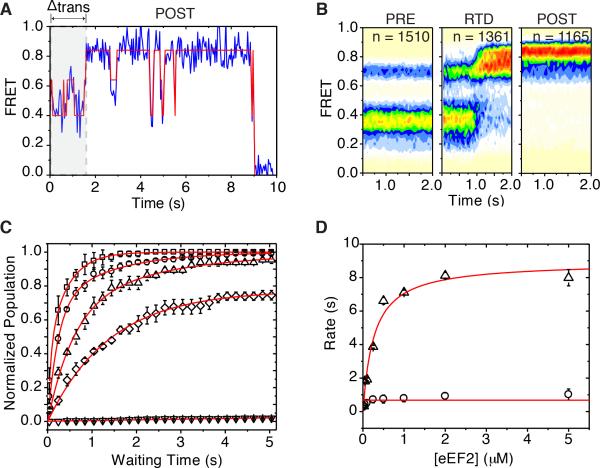
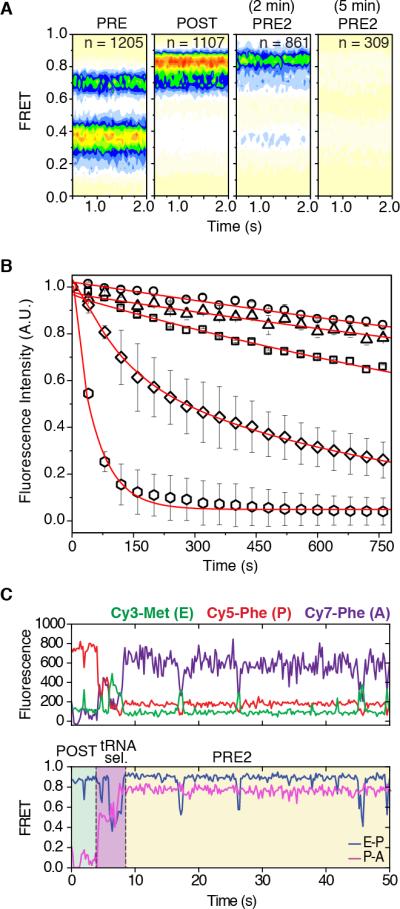
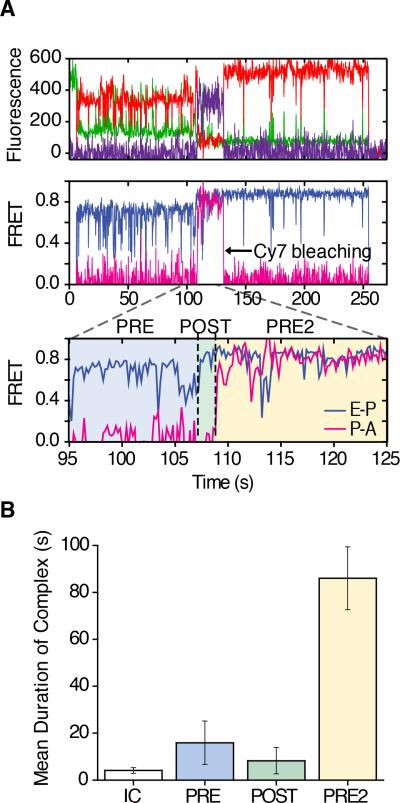
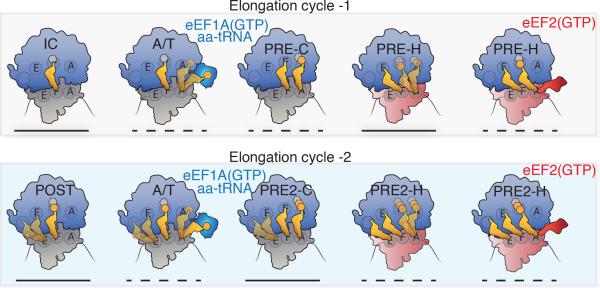
The regulation of protein synthesis contributes to gene expression in both normal physiology and disease, yet kinetic investigations of the human translation mechanism are currently lacking. Using single-molecule fluorescence imaging methods, we have quantified the nature and timing of structural processes in human ribosomes during single-turnover and processive translation reactions. These measurements reveal that functional complexes exhibit dynamic behaviors and thermodynamic stabilities distinct from those observed for bacterial systems. Structurally defined sub-states of pre- and post-translocation complexes were sensitive to specific inhibitors of the eukaryotic ribosome, demonstrating the utility of this platform to probe drug mechanism. The application of three-color single-molecule fluorescence resonance energy transfer (smFRET) methods further revealed a long-distance allosteric coupling between distal tRNA binding sites within ribosomes bearing three tRNAs, which contributed to the rate of processive translation.


Figures

Figure 1
Figure 1. Human ribosomes are translationally active in vitro
(A) “Fraction-active” assay reporting on the competency of 80S ICs assembled in vitro to accept (Cy3B)Phe-tRNAPhe into the A site. The incorporation of (Cy3B)Phe-tRNAPhe into 80S IC's programmed with Met-tRNAiMet in the P-site and a UUC codon in the A site (triangles); UCU codon in the A site (squares); UUC codon in the A site but lacking P-site tRNA (circles); in the absence of mRNA (diamonds). (B) “Processive translation assay” monitoring (Cy3B)Phe-tRNAPhe ternary complex de-quenching upon mixing with 80S ICs. The left cluster represents biological triplicates in the presence (white bar) and absence (hatched bar) of eEF2. Bar graphs to the right represent biological triplicates of ligand-induced inhibition in the presence of eEF2 and (from left) 5 μM (light gray), 50 μM (dark gray) or 500 μM (black) cycloheximide (CHX); 0.1 μM (light gray), 1 μM (dark gray) or 10 μM (black) harringtonine (HTN); 0.005 μM (light gray), 0.05 μM (dark gray) or 0.5 μM (black) deacylated tRNA. (C) “Puromycin peptidyltransferase assay”: photobleaching control (gray squares); 2 mM PMN (triangles); 2 mM PMN plus 200 μM anisomycin (hexagons), 2 mM PMN plus 20 μM sparsomycin (diamonds), 2 mM PMN plus 200 μM chloramphenicol (circles). (D) PMN assay performed on distinct elongation cycle intermediates: 80S IC photobleaching control (gray squares), 80S IC plus 2 mM PMN (triangles); PRE complex plus 2 mM PMN (diamonds), POST complex plus 2 mM PMN (circles). Data are represented as mean +/− SD. See also Figure S1, Tables S1, S2.
Figure 2
Figure 2. The human 80S pre-translocation complex undergoes large-scale spontaneous conformational changes
(A) Schematic representation of aa-tRNA selection depicting the positions of P- and A-site tRNAs site-specifically labeled with Cy3 (green sphere) and Cy5 (red sphere), respectively. aa-tRNA enter the A site in ternary complex with eEF1a (blue) and GTP. (B) Representative pre-steady state single-molecule FRET recording of productive aa-tRNA selection. (C) Population FRET histograms (left panels) and transition density plot (right panel) showing the distribution of FRET states and the frequency of transitions between states, respectively, observed during aa-tRNA selection. Codon recognition (CR), GTPase activated (GA) and fully accommodated (AC) states are indicated (far right). (D) Representative steady-state single-molecule FRET recording of the pre-translocation (PRE) complex. (E) Population FRET histograms (left panels) and transition density plot (right panel) showing the distribution of FRET states and the frequency of transitions between states, respectively, within the PRE complex. Classical (C) and hybrid (H) FRET states are indicated (far right). In FRET histograms and TDPs, FRET state occupancy is indicated by a color heat-map ranging from (least populated) white – blue – green – yellow – orange – red (most populated). See also Figure S2.
Figure 3
Figure 3. Ligand-induced changes of the human 80S pre-translocation complex
Population FRET histograms showing the impact of (A) deacylated-tRNAArg (B) cycloheximide (CHX) and (C) harringtonine (HTN) on the equilibrium distribution of FRET states in the human 80S PRE complex bearing Cy3- and Cy5-labeled P- and A-site tRNAs, respectively. See also Figure S3.
Figure 4
Figure 4. eEF2 rapidly catalyzes formation of a stable post-translocation state
(A) A representative single-molecule FRET trace shows the time between injection of eEF2 and the transition to high FRET upon translocation (gray) and a dynamic POST complex. (B) Population FRET histograms show the distribution of states during translocation. From left: pre translocation complex (PRE); real-time delivery (RTD) of eEF2; post-translocation complex (POST). (C) Translocation monitored by imaging PRE complexes during the stopped-flow delivery of increasing concentrations of eEF2 in the presence of GTP (1 mM) or GDPNP (1 mM) and monitoring the conversion of individual FRET trajectories to a distinct high- (~0.82) FRET state. Curves from top: 5 μM (~ 8 s−1) squares; 250 nM (~ 4 s−1) circles; 50 nM (~ 2 s−1) triangles; 2 μM + GDPNP (~0.4 s−1) diamonds; no eEF2 (no translocation measured) inverted triangles. Data are represented as mean +/− SEM. (D) The KM of eEF2's interaction with the PRE complex was estimated by the 0.5Vmax of tfast (triangles) to be approximately 400 nM. tslow (circles) did not change with eEF2 concentration. Data are represented as mean +/− SD. See also Figure S4.
Figure 5
Figure 5. E-site tRNA dissociates more rapidly from the PRE2 complex
(A) Population FRET histograms show the distribution of states in the PRE complex (first panel), POST complex (second panel), PRE2 complex after 2 min (third panel) and the PRE2 complex after 5 min (last panel). (B) Cy3-tRNAMet dissociation from the E site tracked by the loss of fluorescence via time-lapse imaging. E-site tRNA stability for 80S IC (~0.03 min−1) squares; PRE (~0.02 min−1) circles; POST (~0.02 min−1) triangles; PRE2 (~0.25 min−1) diamonds; PRE2 + eEF2 (~1.2 min−1) hexagons. Data are represented as mean +/− SD. (C) A representative pre-steady state single-molecule FRET trace of productive aa-tRNA selection showing dynamic motions within the ribosome bearing three fluorescently-labeled tRNAs. The area in green indicates the time occupied by a stable POST complex before delivery of Cy7-labeled ternary complex; tRNA selection is highlighted in blue; the PRE2 complex is highlighted in yellow. See also Figure S5.
Figure 6
Figure 6. Stability and dynamics of the human 80S PRE complex bearing three tRNA species
(A) Fluorescence channels (top panel) and a representative pre-steady state single-molecule FRET trace (mid panel). Zoom (lower panel) demonstrates productive aa-tRNA selection (blue region), translocation to a POST state (green region), and a second round of productive aa-tRNA selection (yellow region), where dynamic motions occur within the ribosome bearing three fluorescently-labeled tRNAs. (B) Mean duration of states during processive translation. Data are represented as mean +/− SD. See also Figure S6.
Figure 7
Figure 7. Schematic representation of the translation elongation cycle in human cells
The first (top) and second (bottom) elongation cycles depicting eEF1A-catalyzed conversion of the 80S IC and POST complexes to PRE and PRE2 complexes, respectively. aa-tRNA entry into the A site proceeds through transient A/T-state intermediates wherein dynamic processes are observed in both the A and E sites (schematized as blurred tRNA positions). A-site tRNA motions are represented as transient excursions of aa-tRNA towards the A site; E-site tRNA motions are represented as transient excursions away from the P site. The spontaneous exchange of PRE and PRE2 complexes between classical (C) and hybrid (H) tRNA positions (schematized as blurred tRNA positions) is influenced by the 40S subunit configuration: unrotated (gray) or rotated (red). eEF2 acts on hybrid state PRE complexes in which both A- and P-site tRNAs adopt hybrid positions (PRE-H and PRE2-H) to catalyze directional substrate translocation, forming the POST complex (POST2 complex not shown). Lines underneath each ribosome complex indicates their relative thermodynamic stabilities: solid (stable) and dashed (transient).

Similar articles

Cited by

References

    1. Andersen CBF, Becker T, Blau M, Anand M, Halic M, Balar B, Mielke T, Boesen T, Pedersen JS, Spahn CMT, et al. Structure of eEF3 and the mechanism of transfer RNA release from the E-site. Nature. 2006;443:663–668. - PubMed
    1. Anger AM, Armache J-P, Berninghausen O, Habeck M, Subklewe M, Wilson DN, Beckmann R. Structures of the human and Drosophila 80S ribosome. Nature. 2013;497:80–85. - PubMed
    1. Behrmann E, Loerke J, Budkevich TV, Yamamoto K, Schmidt A, Penczek PA, Vos MR, Bürger J, Mielke T, Scheerer P, et al. Structural snapshots of actively translating human ribosomes. Cell. 2015;161:845–857. - PMC - PubMed
    1. Blaha G, Nierhaus KH. Features and functions of the ribosomal E site. Cold Spring Harb. Symp. Quant. Biol. 2001;66:135–146. - PubMed
    1. Blanchard SC, Kim HD, Gonzalez RL, Puglisi JD, Chu S. tRNA dynamics on the ribosome during translation. Proc. Natl. Acad. Sci. U.S.A. 2004;101:12893–12898. - PMC - PubMed

Publication types

LinkOut - more resources