. 2012 Aug;102(5):1832-1856.
doi: 10.1257/aer.102.5.1832.

Europe's Tired, Poor, Huddled Masses: Self-Selection and Economic Outcomes in the Age of Mass Migration

Affiliations

Europe's Tired, Poor, Huddled Masses: Self-Selection and Economic Outcomes in the Age of Mass Migration

Ran Abramitzky et al. Am Econ Rev. 2012 Aug.

Abstract

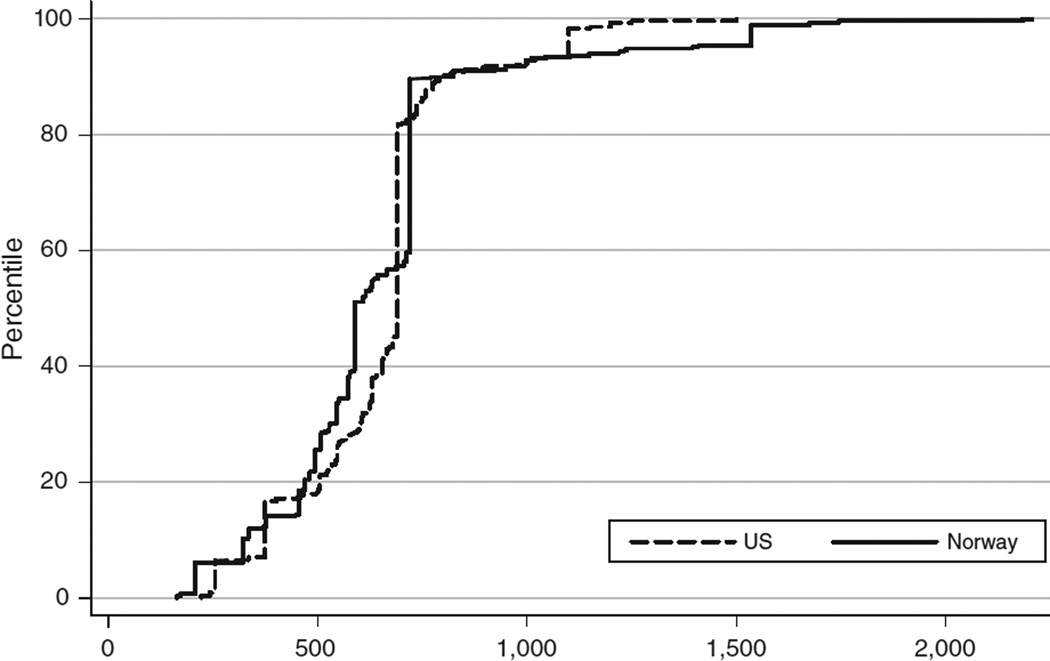
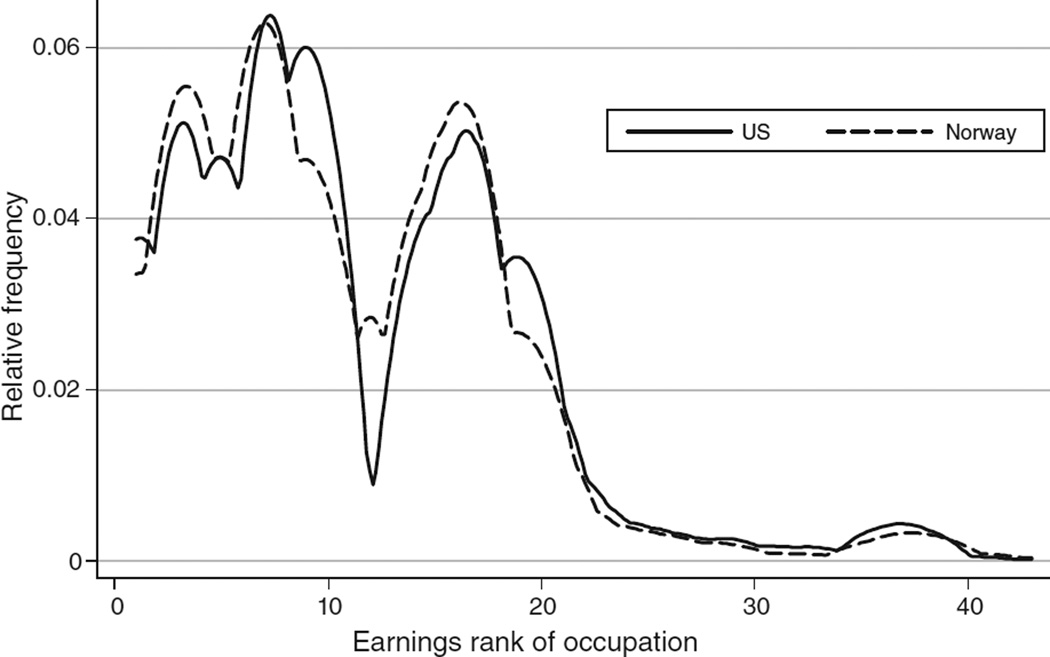
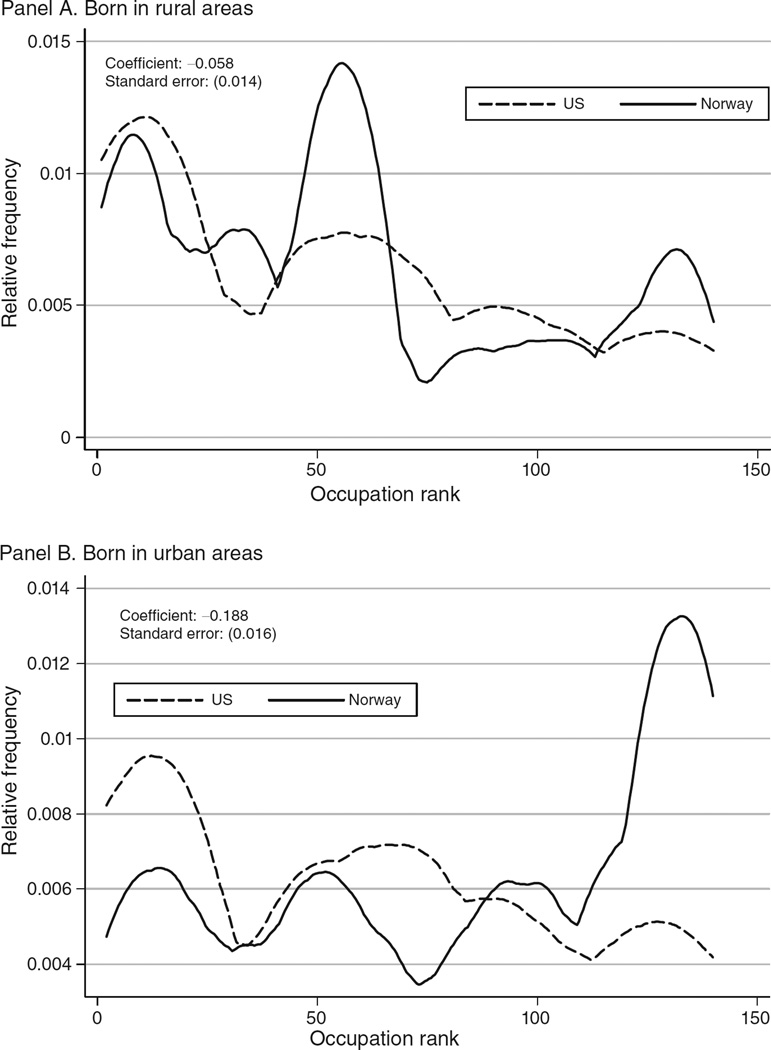
During the age of mass migration (1850-1913), one of the largest migration episodes in history, the United States maintained a nearly open border, allowing the study of migrant decisions unhindered by entry restrictions. We estimate the return to migration while accounting for migrant selection by comparing Norway-to-US migrants with their brothers who stayed in Norway in the late nineteenth century. We also compare fathers of migrants and nonmigrants by wealth and occupation. We find that the return to migration was relatively low (70 percent) and that migrants from urban areas were negatively selected from the sending population. "Keep, ancient lands, your storied pomp!" cries she With silent lips. "Give me your tired, your poor, Your huddled masses yearning to breathe free, The wretched refuse of your teeming shore. Send these, the homeless, tempest-tost to me, I lift my lamp beside the golden door!"--Emma Lazarus (1883).


Figures

Figure 1
Figure 1
Cumulative Income Distribution Functions in the United States and Norway in 1900 Notes: US and Norwegian distributions contain all men aged 38 to 50 in the respective censuses of 1900. The x-axis is scaled in 1900 US dollars. Individuals are assigned the mean earnings for their occupation and are arrayed from lowest- to highest-paid occupations. The Norwegian distribution is rescaled to have the same mean as the US distribution (the actual Norwegian and US means are US$(1900)350 and US$(1900)643, respectively).
Figure 2
Figure 2
Comparing the Occupational Distributions of Migrants Who Stay in the United States or Return to Norway between 1880 and 1900 [Table: see text] Notes: Return migrants are defined as Norwegian-born men observed in the 1880 US census who are matched to the 1900 Norwegian census (N = 1,205). Persistent migrants are Norwegian-born men in the US census of 1880 who are matched to the 1900 US census (N = 2,392). For comparison, unmatched men are Norwegian-born men in the 1880 US census who cannot be matched to either Norway or the United States in 1900. The occupation score measure, which is taken from the 1880 IPUMS sample, is constructed by ordering occupations according to their median earnings in 1950. The mean occupation score and share of the sample with an occupation score in the bottom quartile (score < 12) are reported in the accompanying table. On both measures, the differences between matched and unmatched men are not statistically significant. We mark differences between return and persistent migrants that are statistically different at the 10 percent level with an *.
Figure 3
Figure 3
Comparing the Occupational Distributions of Norwegian-Born Men in the United States and Norway In 1900 Notes: Each figure presents the relative frequency of 144 earning categories (representing 189 distinct occupations) for Norwegian-born men in the United States and in Norway. All men are assigned the mean US earnings in their occupation. Men are divided by rural or urban place of birth. Farmers, the largest occupational category, is excluded from the figure for reasons of scale. We report coefficients and standard errors from OLS regressions of ln(earnings) on a dummy for living in the United States controlling for a quadratic in age.

References

    1. Aaronson Daniel. Using Sibling Data to Estimate the Impact of Neighborhoods on Children’s Educational Outcomes. Journal of Human Resources. 1998;33(4):915–946.
    1. Abramitzky Ran. The Effect of Redistribution on Migration: Evidence from the Israeli Kibbutz. Journal of Public Economics. 2009;93(3–4):498–511.
    1. Abramitzky Ran, Boustan Leah Platt, Eriksson Katherine. Europe’s Tired, Poor, Huddled Masses: Self-Selection and Economic Outcomes in the Age of Mass Migration: Dataset. American Economic Review. 2012 http://dx.doi.org/10.1257/aer.102.5.1832. - DOI - PMC - PubMed
    1. Abramitzky Ran, Braggion Fabio. Migration and Human Capital: Self-Selection of Indentured Servants to the Americas. Journal of Economic History. 2006;66(4):882–905.
    1. Akee Randall. Who Leaves? Deciphering Immigrant Self-Selection from a Developing Country. Economic Development and Cultural Change. 2010;58(2):323–344.

LinkOut - more resources