

Paradoxical Relationship Between Body Mass Index and Thyroid Hormone Levels: A Study Using Mendelian Randomization
- PMID: 26595101
- PMCID: PMC4880123
- DOI: 10.1210/jc.2015-3505
Paradoxical Relationship Between Body Mass Index and Thyroid Hormone Levels: A Study Using Mendelian Randomization
Abstract
Context: Free T3 (FT3) has been positively associated with body mass index (BMI) in cross-sectional studies in healthy individuals. This is difficult to reconcile with clinical findings in pathological thyroid dysfunction.
Objective: We aimed to investigate whether childhood adiposity influences FT3 levels.
Design: Mendelian randomization using genetic variants robustly associated with BMI.
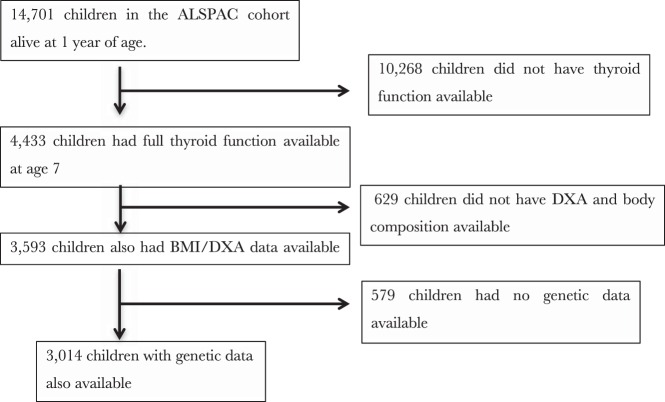
Setting: Avon Longitudinal Study of Parents and Children, a population-based birth cohort.
Participants: A total of 3014 children who had thyroid function measured at age 7, who also underwent dual x-ray absorptiometry scans at ages 9.9 and 15.5 years and have genetic data available.
Main outcome measures: FT3.
Results: Observationally at age 7 years, BMI was positively associated with FT3: β-standardized (β-[std]) = 0.12 (95% confidence interval [CI]: 0.08, 0.16), P = 4.02 × 10(-10); whereas FT4 was negatively associated with BMI: β-(std) = -0.08 (95% CI: -0.12, -0.04), P = 3.00 × 10(-5). These differences persisted after adjustment for age, sex, and early life environment. Genetic analysis indicated 1 allele change in BMI allelic score was associated with a 0.04 (95% CI: 0.03, 0.04) SD increase in BMI (P = 6.41 × 10(-17)). At age 7, a genetically determined increase in BMI of 1.89 kg/m(2) was associated with a 0.22 pmol/L (95% CI: 0.07, 0.36) increase in FT3 (P = .004) but no substantial change in FT4 0.01 mmol/L, (95% CI: -0.37, 0.40), P = .96.
Conclusion: Our analysis shows that children with a genetically higher BMI had higher FT3 but not FT4 levels, indicating that higher BMI/fat mass has a causal role in increasing FT3 levels. This may explain the paradoxical associations observed in observational analyses. Given rising childhood obesity levels, this relationship merits closer scrutiny.
References
-
- Hoogwerf BJ, Nuttall FQ. Long-term weight regulation in treated hyperthyroid and hypothyroid subjects. Am J Med. 1984;76:963–970. - PubMed
-
- Dale J, Daykin J, Holder R, Sheppard MC, Franklyn JA. Weight gain following treatment of hyperthyroidism. Clin Endocrinol (Oxf). 2001;55:233–239. - PubMed
-
- Taylor PN, Razvi S, Pearce SH, Dayan CM. Clinical review: a review of the clinical consequences of variation in thyroid function within the reference range. J Clin Endocrinol Metab. 2013;98:3562–3571. - PubMed
-
- Asvold BO, Bjøro T, Vatten LJ. Association of serum TSH with high body mass differs between smokers and never-smokers. J Clin Endocrinol Metab. 2009;94:5023–5027. - PubMed
-
- Fox CS, Pencina MJ, D'Agostino RB, et al. Relations of thyroid function to body weight: cross-sectional and longitudinal observations in a community-based sample. Arch Intern Med. 2008;168:587–592. - PubMed
Publication types
MeSH terms
Substances
Grants and funding
LinkOut - more resources
Full Text Sources
Other Literature Sources
Research Materials
