. 2016 Jan;13(1):74-80.
doi: 10.1038/nmeth.3664. Epub 2015 Nov 23.

Multiplexed analysis of chromosome conformation at vastly improved sensitivity

Affiliations

Multiplexed analysis of chromosome conformation at vastly improved sensitivity

James O J Davies et al. Nat Methods. 2016 Jan.

Abstract

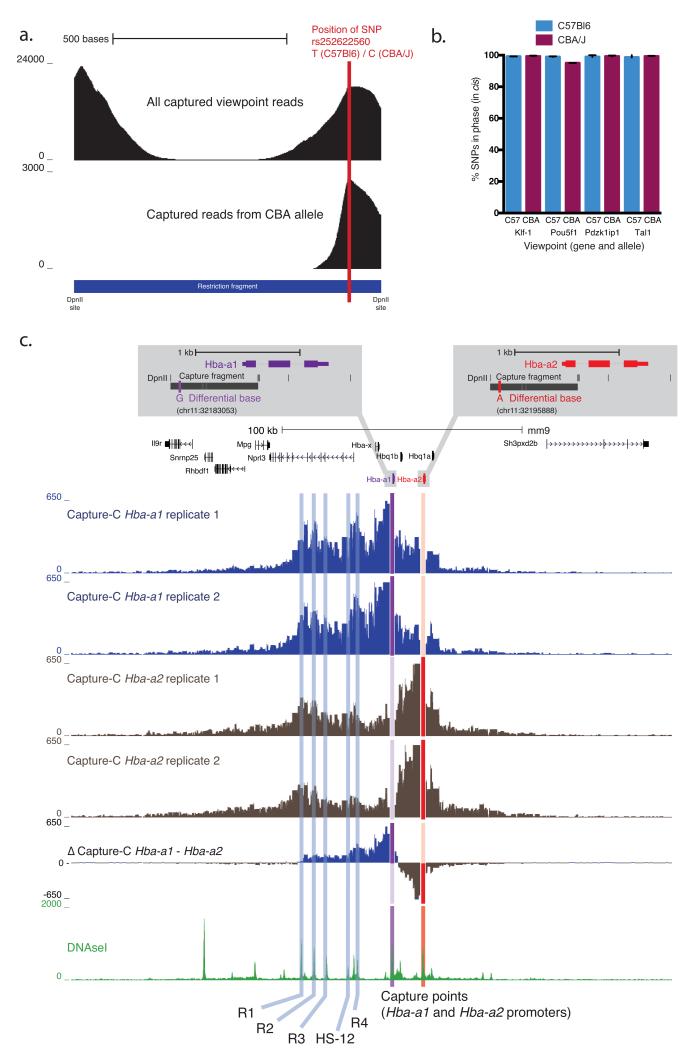
Methods for analyzing chromosome conformation in mammalian cells are either low resolution or low throughput and are technically challenging. In next-generation (NG) Capture-C, we have redesigned the Capture-C method to achieve unprecedented levels of sensitivity and reproducibility. NG Capture-C can be used to analyze many genetic loci and samples simultaneously. High-resolution data can be produced with as few as 100,000 cells, and single-nucleotide polymorphisms can be used to generate allele-specific tracks. The method is straightforward to perform and should greatly facilitate the investigation of many questions related to gene regulation as well as the functional dissection of traits examined in genome-wide association studies.


Figures

Figure 1
Figure 1. Overview of the method
a. Experimental workflow. High-resolution 3C libraries generation:, crosslinking live cells (1); digestion of chromatin, optimized for four cutter restriction enzymes (eg Dpn II) (2); ligation (3); de-crosslinking and DNA extraction (4). This 3C library is sonicated to produce random ~200 bp fragments (5) followed by; sequencing adaptor ligation and indexing (6); pooling of indexed samples (7) hybridization with biotinylated oligonucleotides to the pool of indexed samples (8); pull down using streptavidin beads (9) and PCR from beads using adapter P5&7 sequences (10). Steps 8-10 are repeated, resulting in enrichments up to 3,000,000-fold over the uncaptured 3C library, and sequenced (11). b. Analysis. 1. Raw data (FASTQ). 2. Reconstruction of paired reads into original fragments. 3. in silico digestion into component restriction fragments to allow for mapping. 4. Reads not containing a restriction site or a captured viewpoint are discarded as background. 5. Reads that are not unique are collapsed into a single representative read. 6. Interactions are only reported if a read pair maps within a captured fragment and maps outside all of the capture fragments and proximity exclusion regions in the experiment (usually 1 kb on either side of the captured viewpoint fragments). This is done to prevent undigested material being reported as interacting and to prevent the reporting of fragments captured by two different oligonucleotides. The data are then filtered to remove regions with problematic mappability due to copy number differences33 and mis-mapped reads from the proximity exclusion region.
Figure 2
Figure 2. Comparison of single and double oligonucleotide capture
3C material generated from erythroid cells was captured using a single set of oligonucleotides designed to the α globin promoters (Supplementary Data). The two copies of the gene are virtually identical, therefore interaction profiles were generated from both genes simultaneously. After the first oligonucleotide capture step some of the material was sequenced using the Illumina MiSeq. The remaining library was used as input for a second round of oligonucleotide capture and then sequenced. a. Comparison of the enrichment (to scale) resulting from the single (i) and double capture (iii) and the subsequent sequence read categorization following alignment (iii and iv). (i) Single capture resulted in 5-20,000 fold enrichment but only 0.3% of the reads contained a sequence that mapped to the captured fragment. (ii) Double capture increased the enrichment markedly; producing up to 3,000,000 fold enrichment. This dramatically increased the percentage of reads containing a restriction fragment that map to the capture region from 0.3% to 48.6%. The number of unique interactions was increased around 30-fold following double capture (from 10,832 to 327,787) (iii & iv) as library complexity now becomes the limiting factor. b. Comparison of the raw informative interactions count per restriction enzyme fragment for single and double capture. The red vertical lines denote the location of captured viewpoints. The light blue lines highlight the five well described regulatory elements in the mouse (R1, R2, R3, R4 and HS-12). This showed that double capture did not notably alter the local interaction profile yet has 30-fold increased sensitivity.
Figure 3
Figure 3. Identification of regulatory elements using comparative analysis
Top panels show the overlaid normalized mean Capture-C profiles from eythroid (genes active in red) and ES cells (genes inactive in blue) at three erythroid specific loci α globin, β globin and Slc25A37 (Mitoferrin 1) in (erythroid n=4 and ES cells n=3). These data were generated along with the profiles for another 32 gene promoters simultaneously from seven samples in a single capture reaction (making a total of 245 interaction profiles from one oligonucleotide capture reaction). The Y-axis denotes the mean number of unique interactions per restriction fragment, scaled to a total of 100,000 interactions genome-wide. The captured viewpoint fragments are highlighted in red and the interactions with the well-known enhancers (as annotated by DNAseI hypersensitivity) are highlighted as black hatched lines. The differential track (Δ Capture-C) shows that interactions with the local erythroid enhancers are clearly and specifically increased in erythroid cells when the genes are active. Below this DESeq2 analysis of the differential enrichment (minus log10 adjusted p-values) mapped across the three loci. The DESeq2 analysis shows the highly significant (< 10−30) enrichment of the known regulatory interactions.
Figure 4
Figure 4. SNP specific interaction profiles
a. Required positioning of SNP. Density plot of the total reads and CBA SNP allele reads from mapping to the Tal-1 captured restriction fragment (the Tal-1 promoter fragment is shown). SNPs under the captured regions allowed for the generation of allele specific interaction profiles in F1 crosses between C57BL/6 and CBA/J mice (see also Supplementary Figure 22). In the example locus the SNP rs252622560 has been used to separate interactions from the two different alleles. b. Interactions occur in cis. Graphical representation of the percentage of SNPs in phase in the interacting reads compared with the strain of the captured allele in cis. This demonstrates that the chromosome predominately interacts with itself in cis rather than its sister chromatid. c. SNP specific NG Capture-C. Using this approach we generated specific interaction profiles for Hba-a1 and Hba-a2 paralogous genes. A single nucleotide difference between the two genes allowed the generation of specific tracks (see inset). Hba-a1 is the more active of the two genes, producing around 70% of the total mRNA. Comparison of the two biological replicates showed that the SNP specific profiles are highly reproducible. The Δ Capture-C track showed the difference of the mean Hba-a1 and Hba-a2 profiles. This revealed that that the Hba-a1 gene preferentially interacts with the enhancers, particularly proximal HS-12 and R4 elements. The Hba-a2 gene interacts much more strongly with the chromatin between the two genes. Interestingly Hba-a2 interacts with the most distal enhancer (R1) to a very similar degree as the Hba-a1 gene.

Similar articles

Cited by

References

    1. Wang Z, Gerstein M, Snyder M. RNA-Seq: a revolutionary tool for transcriptomics. Nat Rev Genet. 2009;10:57–63. - PMC - PubMed
    1. Mikkelsen TS, et al. Genome-wide maps of chromatin state in pluripotent and lineage-committed cells. Nature. 2007;448:553–60. - PMC - PubMed
    1. Robertson G, et al. Genome-wide profiles of STAT1 DNA association using chromatin immunoprecipitation and massively parallel sequencing. Nat Methods. 2007;4:651–7. - PubMed
    1. Hesselberth JR, et al. Global mapping of protein-DNA interactions in vivo by digital genomic footprinting. Nat Methods. 2009;6:283–9. - PMC - PubMed
    1. Buenrostro JD, Giresi PG, Zaba LC, Chang HY, Greenleaf WJ. Transposition of native chromatin for fast and sensitive epigenomic profiling of open chromatin, DNA-binding proteins and nucleosome position. Nat Methods. 2013;10:1213–8. - PMC - PubMed

Publication types