. 2015 Dec;17(12):1556-68.
doi: 10.1038/ncb3272. Epub 2015 Nov 23.

Glutamine synthetase activity fuels nucleotide biosynthesis and supports growth of glutamine-restricted glioblastoma

Affiliations

Glutamine synthetase activity fuels nucleotide biosynthesis and supports growth of glutamine-restricted glioblastoma

Saverio Tardito et al. Nat Cell Biol. 2015 Dec.

Abstract

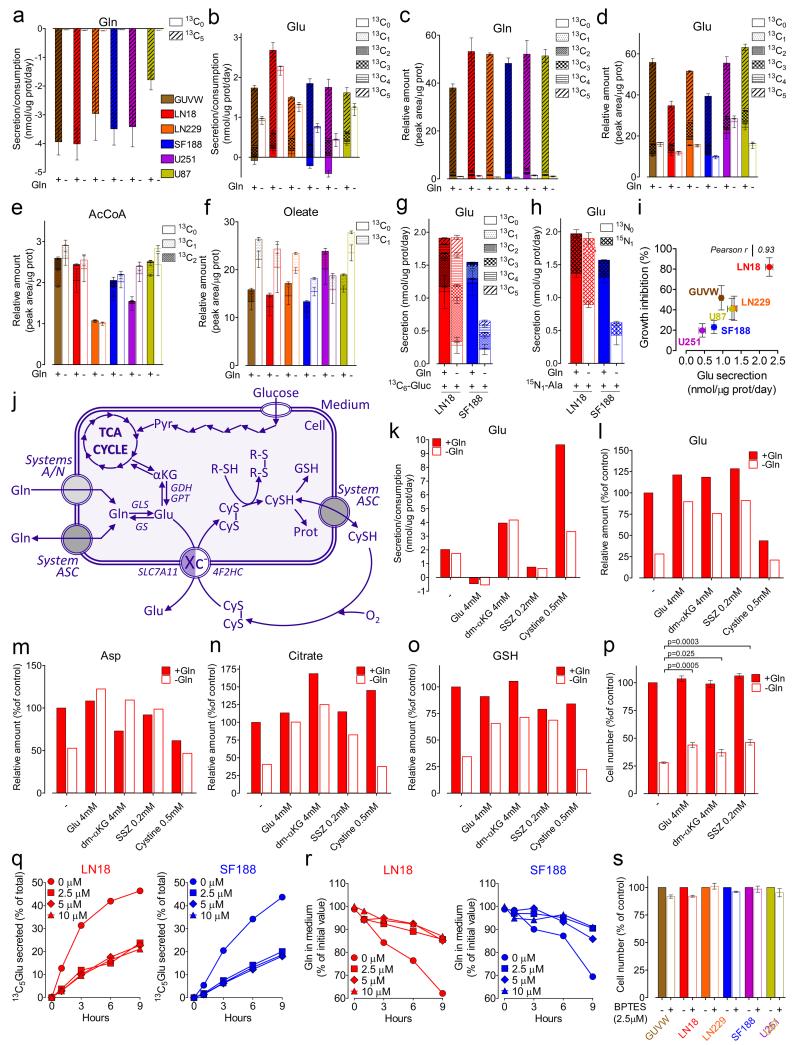
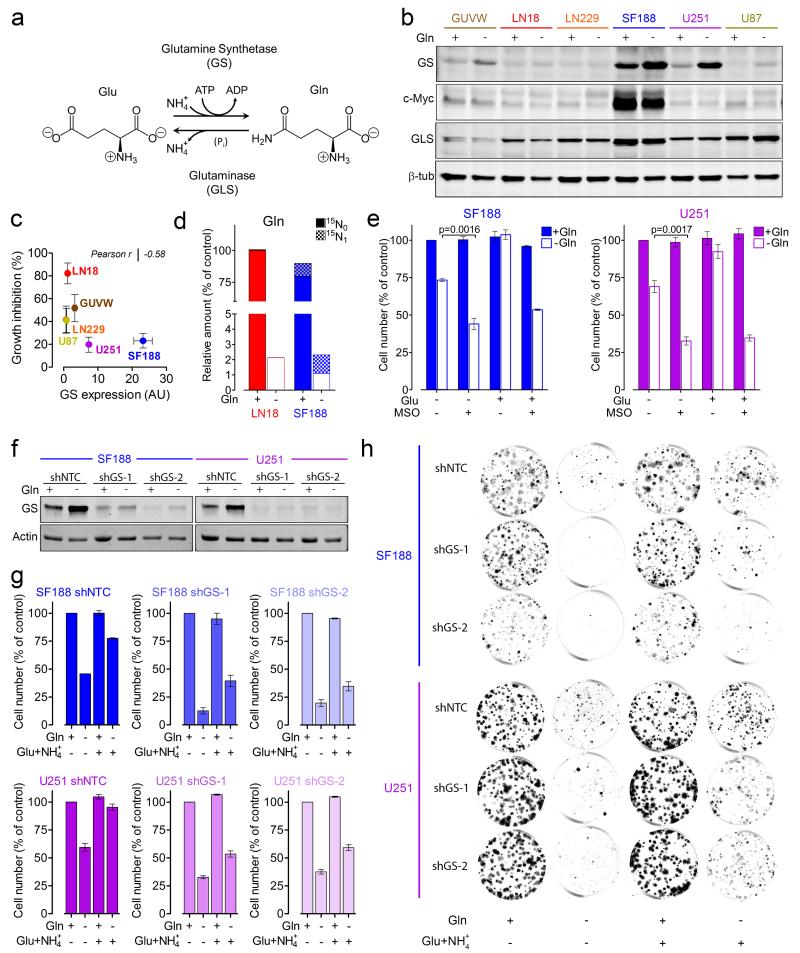
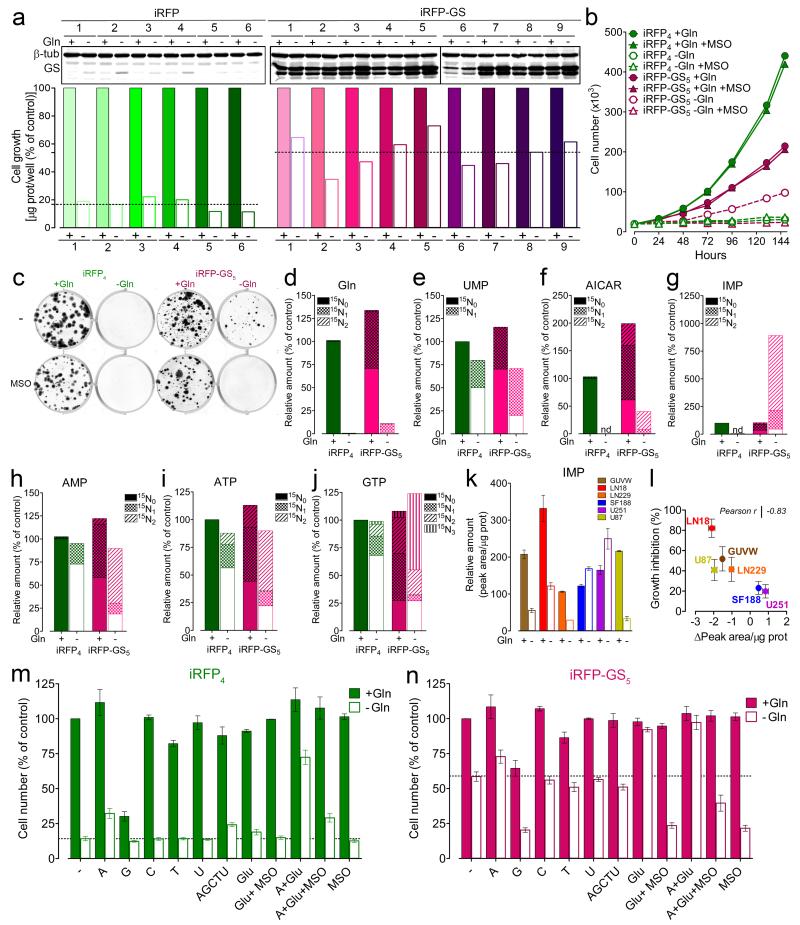
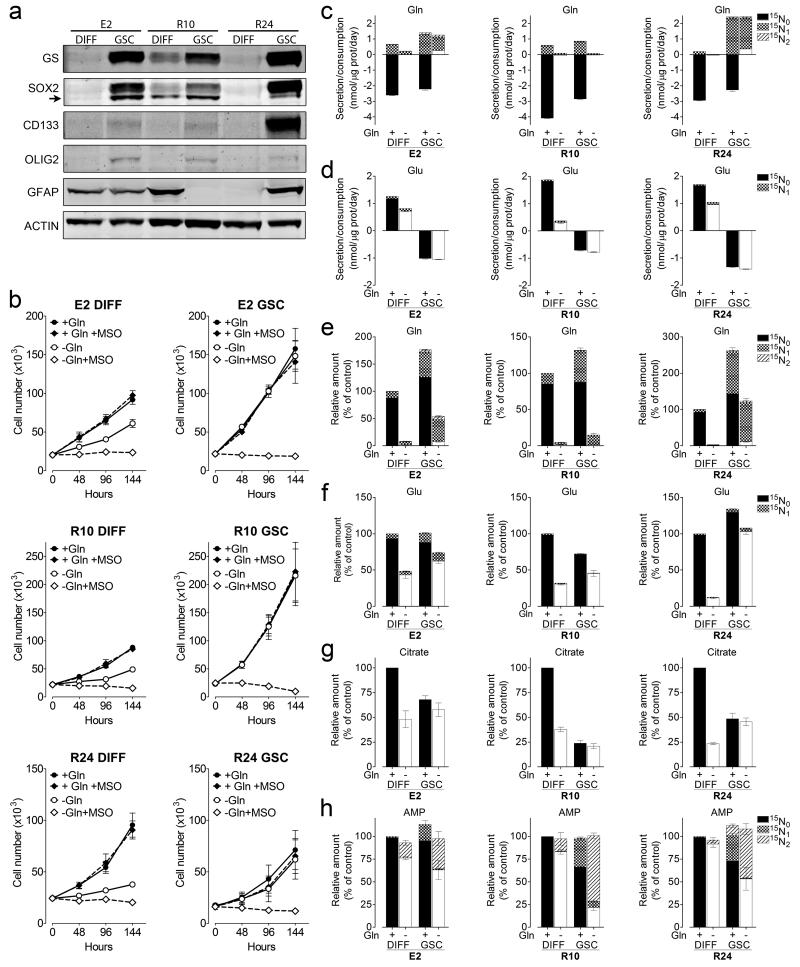
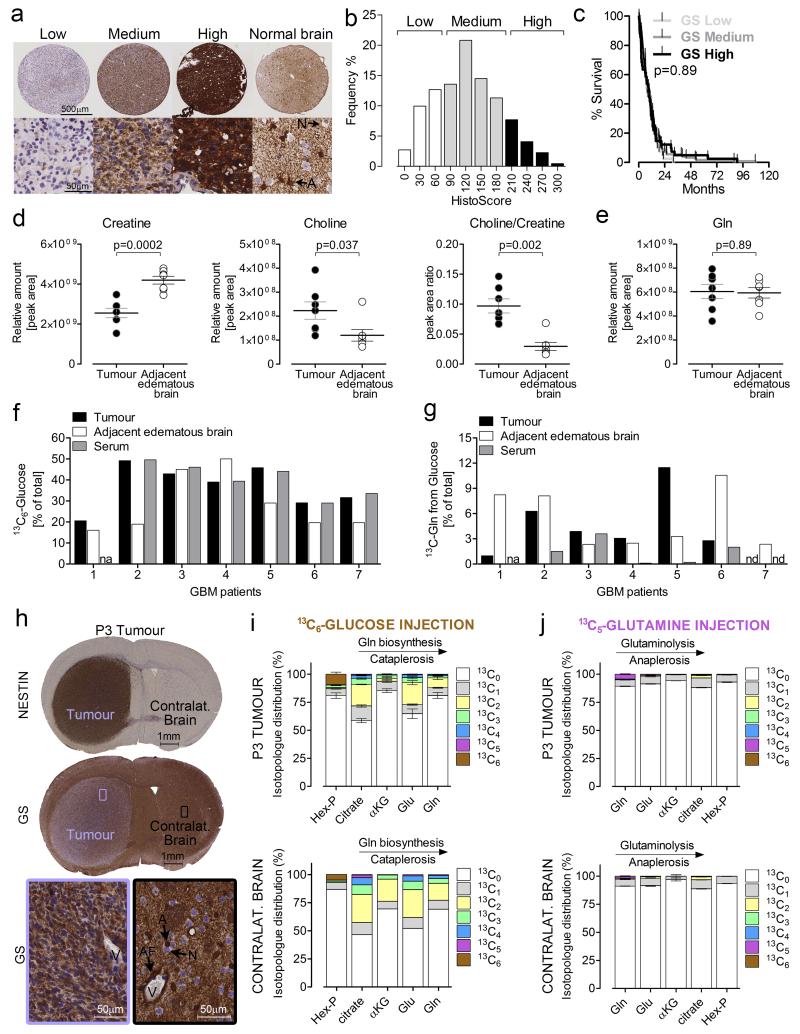
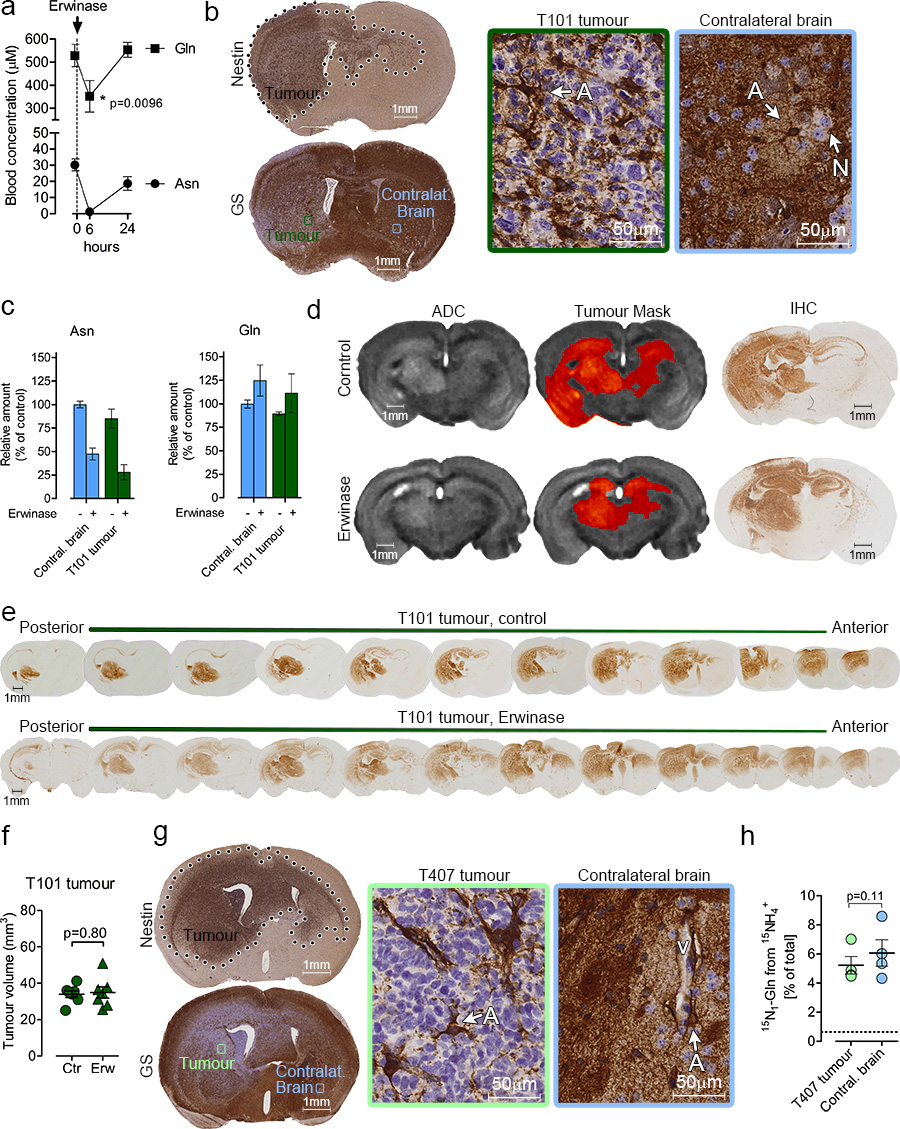
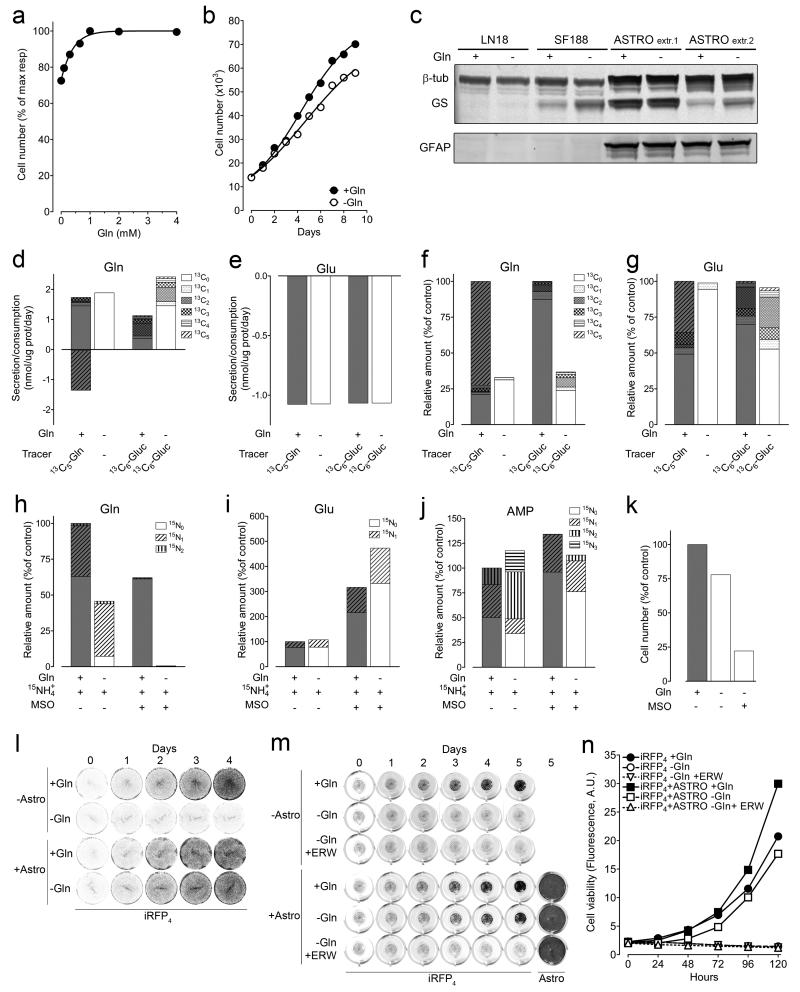
L-Glutamine (Gln) functions physiologically to balance the carbon and nitrogen requirements of tissues. It has been proposed that in cancer cells undergoing aerobic glycolysis, accelerated anabolism is sustained by Gln-derived carbons, which replenish the tricarboxylic acid (TCA) cycle (anaplerosis). However, it is shown here that in glioblastoma (GBM) cells, almost half of the Gln-derived glutamate (Glu) is secreted and does not enter the TCA cycle, and that inhibiting glutaminolysis does not affect cell proliferation. Moreover, Gln-starved cells are not rescued by TCA cycle replenishment. Instead, the conversion of Glu to Gln by glutamine synthetase (GS; cataplerosis) confers Gln prototrophy, and fuels de novo purine biosynthesis. In both orthotopic GBM models and in patients, (13)C-glucose tracing showed that GS produces Gln from TCA-cycle-derived carbons. Finally, the Gln required for the growth of GBM tumours is contributed only marginally by the circulation, and is mainly either autonomously synthesized by GS-positive glioma cells, or supplied by astrocytes.


Figures

Figure 1
Figure 1
Gln starvation reduces GBM cell proliferation. (a) Dose-response curves for cell lines incubated for 3 days in DMEM or SMEM with the indicated concentrations of Gln. (b) Cells were incubated for the indicated times in SMEM +/− Gln. (c) Cells were incubated for 72 hours in SMEM +/− Gln or Glucose as indicated. Each dot represents the number of dead cells (with plasma membrane integrity loss) normalized over a confluence index. The resulting cell death index was assessed every hour. (d) Cell cycle distribution of cell lines incubated for 3 days +/− Gln. Mean of 3 independent experiments is shown in Supplementary Figure 1b. (e) Growth inhibition caused by Gln starvation. Mean ± S.E.M. n=3 independent experiments. (f) Scatter plot of the doubling time obtained for the cell lines in Gln-fed conditions, in relation to growth inhibition caused by Gln starvation. Mean ± S.E.M. n=3 independent experiments. (a-d) Data derive from one experiment performed twice (a, b, c), or three times (d). Raw data of independent repeats are provided in the statistics source data Supplementary Table 5.
Figure 2
Figure 2
The effects of Glu secretion, and GLS inhibition on GBM cells growth and metabolism. (a-b) Cells were incubated for 24h +/− 13C5-Gln. Secretion (positive bars) and consumption (negative bars) rates of Gln and Glu isotopologues are shown. Mean ± S.E.M. n=3 independent experiments. (c-f) Cells were incubated as in (a-b) and the levels of intracellular Gln, Glu, Acetyl CoA, and oleate isotopologues are shown. Mean ± S.E.M. n=3 independent experiments. (g-h) LN18 and SF188 cells were incubated for 24h +/− Gln in media where glucose (g) or alanine (h) where fully replaced by 13C6-glucose or 15N1-alanine respectively. The isotopologues distributions of Glu released in the medium are shown. Mean ± S.E.M. n=3 independent experiments. (i) Scatter plot of Glu secretion observed in the absence of Gln, in relation to the growth inhibition caused by Gln starvation. Mean ± S.E.M. n=3 independent experiments. (j) A schematic representation of the Xc activity in the context of Glu metabolism. Adapted from Bannai et al. (k) LN18 cells were incubated for 24h +/− Gln in media supplemented or not with Glu, α-ketoglutarate dimethylester (dm-αKG), sulfasalazine (SSZ), or cystine, at the indicated concentrations, and the secretion/consumption rates of Glu are shown. (l-o) LN18 cells were incubated as in (k) and the intracellular levels of Glu (l), aspartate (m), citrate (n), and reduced form of glutathione (o) are shown as % of untreated control. (p) LN18 cells were incubated for 72h as described for (k). Cell number is shown as % of untreated control. Mean ± S.E.M. n=4 independent experiments. p values refer to a two-tailed t test for unpaired samples. (q-r) Cells were pre-incubated in medium with 0, 2.5, 5, 10, 15, 30μM BPTES for 3h. At t=0 medium was replaced with one containing 13C5-Gln. The abundance of 13C5-Glu (q) or 13C5-Gln (r) in the medium was monitored over time. In all conditions cells were exposed to 0.3% DMSO. (s) Cells were incubated in medium +/− 2.5μM BPTES for 72h, and counted. DMSO was 0.3% in all conditions. Mean ± S.E.M. n=3 independent experiments. (k, l, m, n, o, q, r) Data derive from one experiment performed once (k, l, m, n, o), or twice (q, r). Raw data of independent repeats are provided in the statistics source data Supplementary Table 5.
Figure 3
Figure 3
GS sustains cell growth during Gln starvation. (a) GS and GLS catalysed reactions. (b) Cells were incubated for 24h +/− Gln and protein expression was assessed. Unprocessed scans of western blots are shown in Supplementary Figure 8. (c) Scatter plot of GS protein expression observed in Gln-fed condition (Arbitrary Units, AU) in relation to the growth inhibition caused by Gln starvation. Mean ± S.E.M. n=3 independent experiments. (d) LN18 and SF188 cells were incubated for 24h +/− Gln in the presence of 0.8 mM NH4+15. The intracellular levels of Gln isotopologues are shown as % of 15N0-Gln in LN18 cells. Data derive from one experiment performed twice. Raw data of independent repeats are provided in the statistics source data Supplementary Table 5. (e) SF188 and U251 cells were incubated for 72h +/− Gln in medium supplemented with 4mM Glu and 1mM MSO as indicated. Cells numbers are shown as % of untreated control. Mean ± S.E.M. n=3 independent experiments. (f) SF188 and U251 cells stably expressing a non-targeting control shRNA (shNTC) or two sequences targeting GS (shGS-1 and shGS-2) were incubated for 24h +/− Gln. (g) Cells were incubated for 72h +/− Gln in medium supplemented with 4mM Glu, and 0.8mM NH4+, as indicated. Cell number is shown as % of the respective Gln-fed control. Mean ± S.E.M. n=3 independent experiments. (h) Cells were incubated for 12-17 days +/− Gln in medium supplemented with 4mM Glu, and 0.8mM NH4+ as indicated. Colonies obtained in representative wells are shown. n=4 independent experiments, quantified as shown in Supplementary Figure 4b.
Figure 4
Figure 4
GS activity regulates cell growth and purine availability under Gln starvation. (a) Top: LN18 clones stably expressing iRFP or iRFP-GS were incubated +/− Gln for 5 days and protein expression assessed. Unprocessed scans of western blots are shown in Supplementary Figure 8. Bottom: For each clone growth was determined from the protein amount and referred as % of respective control. Dashed lines show the mean % values obtained - Gln. (b) iRFP4 and iRFP-GS5 cells were incubated for the indicated times in medium +/− Gln and MSO (1mM), and counted. (c) iRFP4 and iRFP-GS5 cells were incubated +/− Gln and MSO (1mM) for 21 days, and colonies in representative wells are shown. Data derive from one experiment performed twice. (d-j) iRFP4 and iRFP-GS5 cells were incubated +/− Gln for 24h in medium supplemented with 0.8 mM NH4+15. The intracellular isotopologues of Gln, UMP, AICAR, IMP, AMP, ATP, and GTP are shown as % of values obtained for the 15N0 metabolites in iRFP4 cells in the presence of Gln. (k) Cell lines were incubated +/− Gln for 24h and the relative amount of intracellular IMP is shown. Mean ± S.E.M. n=3 independent experiments. (l) Scatter plot of the changes in intracellular IMP levels in relation to the growth inhibition caused by Gln starvation. Mean ± S.E.M. n=3 independent experiments. (m-n) iRFP4 (m) and iRFP-GS5 (n) cells were incubated for 72h +/− Gln in medium containing adenosine (A) guanosine (G) cytidine (C) thymidine (T) uridine (U), each at 0.2mM, or in combination (AGCTU) at 0.2 mM each, Glu (4mM), MSO (1mM), as indicated. Cells numbers are shown as % of untreated control. Dashed lines show percentage values obtained in the absence of Gln without any further supplementation. Mean ± S.E.M. n=3 independent experiments. (a, b, d, e, f, g, h, i, j) Data derive from one experiment performed once (a, b) or twice (d-j). Raw data of independent repeats are provided in the statistics source data Supplementary Table 5.
Figure 5
Figure 5
Gln metabolism in differentiated (DIFF) and GBM Stem-like (GSC) primary human GBM cells. (a) Protein expression was assessed in E2, R10 and R24 cells maintained in DMEM/F-12 and supplemented as described in the Methods section. Arrow points to SOX2 specific band. A representative experiment repeated twice is shown. Unprocessed scans of western blots are shown in Supplementary Figure 8. (b) Cells were incubated in SMEM supplemented as described in the Methods section, +/− 0.65mM Gln and 1mM MSO as indicated. Mean ± S.E.M. n=3 independent experiments. (c-d) The exchange rates of Gln (c) and Glu (d) isotopologues in cells incubated for 24h in SMEM +/− 0.65mM Gln supplemented with of 0.8mM NH4+15. Mean ± S.E.M. n=3 independent experiments. (e-h) The Intracellular content of Gln (e), Glu (f), citrate (g), and AMP (h) isotopologues in cells incubated as in (c-d). Mean ± S.E.M. n=3 independent experiments.
Figure 6
Figure 6
Gln metabolism in GBM patients and primary orthotopic xenografts. (a) GBM tissue microarray. GS immuno-staining of representative tissue cores at low and high magnification (top and bottom respectively). A: Astrocyte, N: Neuron. (b) Frequency distribution of GBM patients (n=209) divided according to their histoscore for GS, and categorized as low, medium, and high. Normal astrocytes were used as a reference for defining maximal immunoreactivity. (c) Kaplan Meier curves for GBM patients divided into low, medium, and high GS expression. p value refers to a log-rank (Mantel-Cox) test. (d-e) creatine, choline, choline to creatine ratio (d), and Gln (e) levels in tumor tissue and adjacent edematous brain of GBM patients injected with 13C6-glucose before surgical intervention. n= 7 patients, p values refer to a two-tailed t test for paired samples. (f-g) 13C6-glucose (f), and 13C Gln (g) enrichment in serum at time of tumour resection, in tumor tissue, and in adjacent edematous tissue. Gln isotopologues incorporating one or more 13C-atoms, over the total amount of Gln detected (% of total) are shown. na: not available, nd: not detectable. Values were corrected for the natural abundance of 13C. (h) Coronal section of human P3 GBM xenograft grown in brain of immunocompromised mice, and stained for human nestin and GS. Lower panels are magnification of the respective framed regions. A: astrocytes, AF: astrocytic end-feet, N: neuron, V: blood vessel. (i, j) Isotopologue distribution of metabolites (Hexose phosphates, citrate, α-KG, Glu, Gln) obtained in mice orthotopically xenografted with human P3 GBM, and injected in the tail vain with a bolus of 13C6-Glucose (i) or 13C5-Gln (j). Tissues were sampled 22min after injection. The values are mean ± S.E.M. n=3 mice for all conditions, except for contralateral brain of mice injected with glucose, where 2 mice were used. (i, j) Raw data of independent repeats are provided in the statistics source data Supplementary Table 5.
Figure 7
Figure 7
Glutamine supply for GBM tumours with low GS expression. (a) Gln and Asn levels were measured by HPLC-MS in peripheral blood samples obtained at indicated time points from immunocompromised mice intraperitoneally injected with Erwinase (5U/gr of body weight). Mean ± S.E.M. n=5 mice. p values refer to a two-tailed t test for paired samples. (b) Coronal section of human T101 GBM xenograft grown in brain of immunocompromised mice, and stained for human nestin and GS. Left panels are magnification of the respective framed regions. A: astrocytes, N: neuron. (c) Immunocompromised mice were orthotopically implanted with T101 GBM tumours and treated with Erwinase for 6 weeks as described in the Methods section. Asn and Gln were assessed in the tumour and contralateral brain 6h after the last Erwinase injection. Mean ± S.E.M. n=3 mice. (d) MRI-based Apparent Diffusion Coefficient (ADC) maps of T101 GBM tumours treated with Erwinase as described in (c). The tumour mask has been manually delineated to highlight the tumour region. IHC staining of brain sections corresponding to the MRI scans are shown. T101 tumours were stained with an anti-human EGFR antibody. (e) Two representative series of coronal sections of T101 brain xenografts, were stained for human EGFR. Mice were treated with Erwinase as in (c). (f) Volumes of T101 orthotopic tumours obtained thorough quantitative imaging of EGFR-stained serial sections of brains. Mice were treated with Erwinase as in (c). Mean ± S.E.M. n=7 mice. p value refer to a two-tailed t test for unpaired samples. (g) Coronal section of human T407 GBM xenograft grown in brain of immunocompromised mice, and stained for human nestin and GS. Left panels are magnification of the respective framed regions. A: astrocytes, V: blood vessel. (h) 15N1-Gln enrichment in T407 GBM tumours and in contralateral brains, after a 4h intracarotid infusion with NH4+15. The dashed lines correspond to the natural abundance of 15N1-Gln. Mean ± S.E.M. n=4 mice. p value refer to a two-tailed t test for paired samples.
Figure 8
Figure 8
Astrocytes feed with Gln GBM cells. (a, b) Astrocytes were incubated in SMEM for 6 days with 0, 0.1, 0.3, 0.65, 1, 2, 4mM Gln (a) or for the indicated times with 0 and 0.65mM Gln (b). (c) Astrocytes derived from two independent extractions, and cell lines, were incubated for 3 days +/− Gln and protein expression assessed. Unprocessed scans of western blots are shown in Supplementary Figure 8. (d-j) Astrocytes were incubated in SMEM for 24h in the presence of 5.56mM Glucose (13C6 or 13C0), 0.65mM Gln (13C5 or 13C0), 0.8mM 15NH4+, and 1mM MSO as indicated. Secretion/consumption rates (positive/negative bars respectively) are shown for Gln (d) and Glu (e). Intracellular levels of Gln (f) and Glu (g) isotopologues are reported as % of control (total of isotopologues in Gln fed conditions). The intracellular isotopologues of Gln (h), Glu (i), AMP (j) are shown as % of control (total isotopologues in the presence of Gln and 15NH4. (k) Astrocytes were incubated for 6 days +/− 0.65mM Gln, and 1mM MSO and counted. (l) Astrocytes were grown to confluence in multi-well plates. iRFP4 cells were seeded in wells +/− astrocytes, and +/− Gln. The fluorescence of iRFP4 cells in representative wells is shown. The experiment was performed twice with comparable results. (m) Astrocytes were grown to confluence in multi-well plates. iRFP4 cells seeded in transwell inserts were co-cultured +/− astrocytes, +/−Gln, and +/− Erwinase (Erw) as indicated. Fluorescence of iRFP4 cells in representative inserts is shown. At day 5 astrocytes were stained with sulphorodamine-B and the fluorescence of representative wells is shown. (n) Quantification of the iRFP4 fluorescence as described for (m). (a, b, d, e, f, g, h, i, j, k, n) Data derive from one experiment performed twice. Raw data of independent repeats are provided in the statistics source data Supplementary Table 5.

Comment in

  • Rethinking glutamine addiction.
    Krall AS, Christofk HR. Krall AS, et al. Nat Cell Biol. 2015 Dec;17(12):1515-7. doi: 10.1038/ncb3278. Nat Cell Biol. 2015. PMID: 26612572

References

    1. Moreadith RW, Lehninger AL. The pathways of glutamate and glutamine oxidation by tumor cell mitochondria. Role of mitochondrial NAD(P)+-dependent malic enzyme. The Journal of biological chemistry. 1984;259:6215–6221. - PubMed
    1. Yuneva MO, et al. The metabolic profile of tumors depends on both the responsible genetic lesion and tissue type. Cell metabolism. 2012;15:157–170. doi:10.1016/j.cmet.2011.12.015. - PMC - PubMed
    1. Wise DR, et al. Myc regulates a transcriptional program that stimulates mitochondrial glutaminolysis and leads to glutamine addiction. Proc Natl Acad Sci U S A. 2008;105:18782–18787. doi:10.1073/pnas.0810199105. - PMC - PubMed
    1. DeBerardinis RJ, et al. Beyond aerobic glycolysis: transformed cells can engage in glutamine metabolism that exceeds the requirement for protein and nucleotide synthesis. Proc Natl Acad Sci U S A. 2007;104:19345–19350. doi:10.1073/pnas.0709747104. - PMC - PubMed
    1. Tardito S, et al. L-Asparaginase and inhibitors of glutamine synthetase disclose glutamine addiction of beta-catenin-mutated human hepatocellular carcinoma cells. Current cancer drug targets. 2011;11:929–943. - PubMed

Publication types

MeSH terms

LinkOut - more resources