. 2016 Jan;12(1):22-8.
doi: 10.1038/nchembio.1965. Epub 2015 Nov 23.

CRISPR-Cas9-based target validation for p53-reactivating model compounds

Affiliations

CRISPR-Cas9-based target validation for p53-reactivating model compounds

Michael Wanzel et al. Nat Chem Biol. 2016 Jan.

Abstract

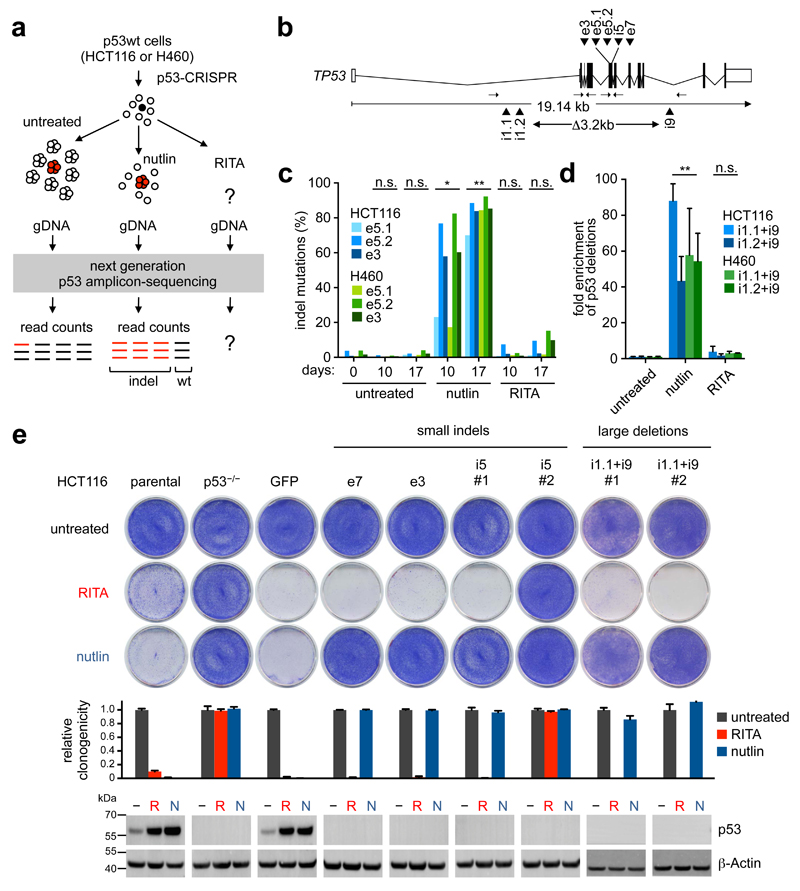
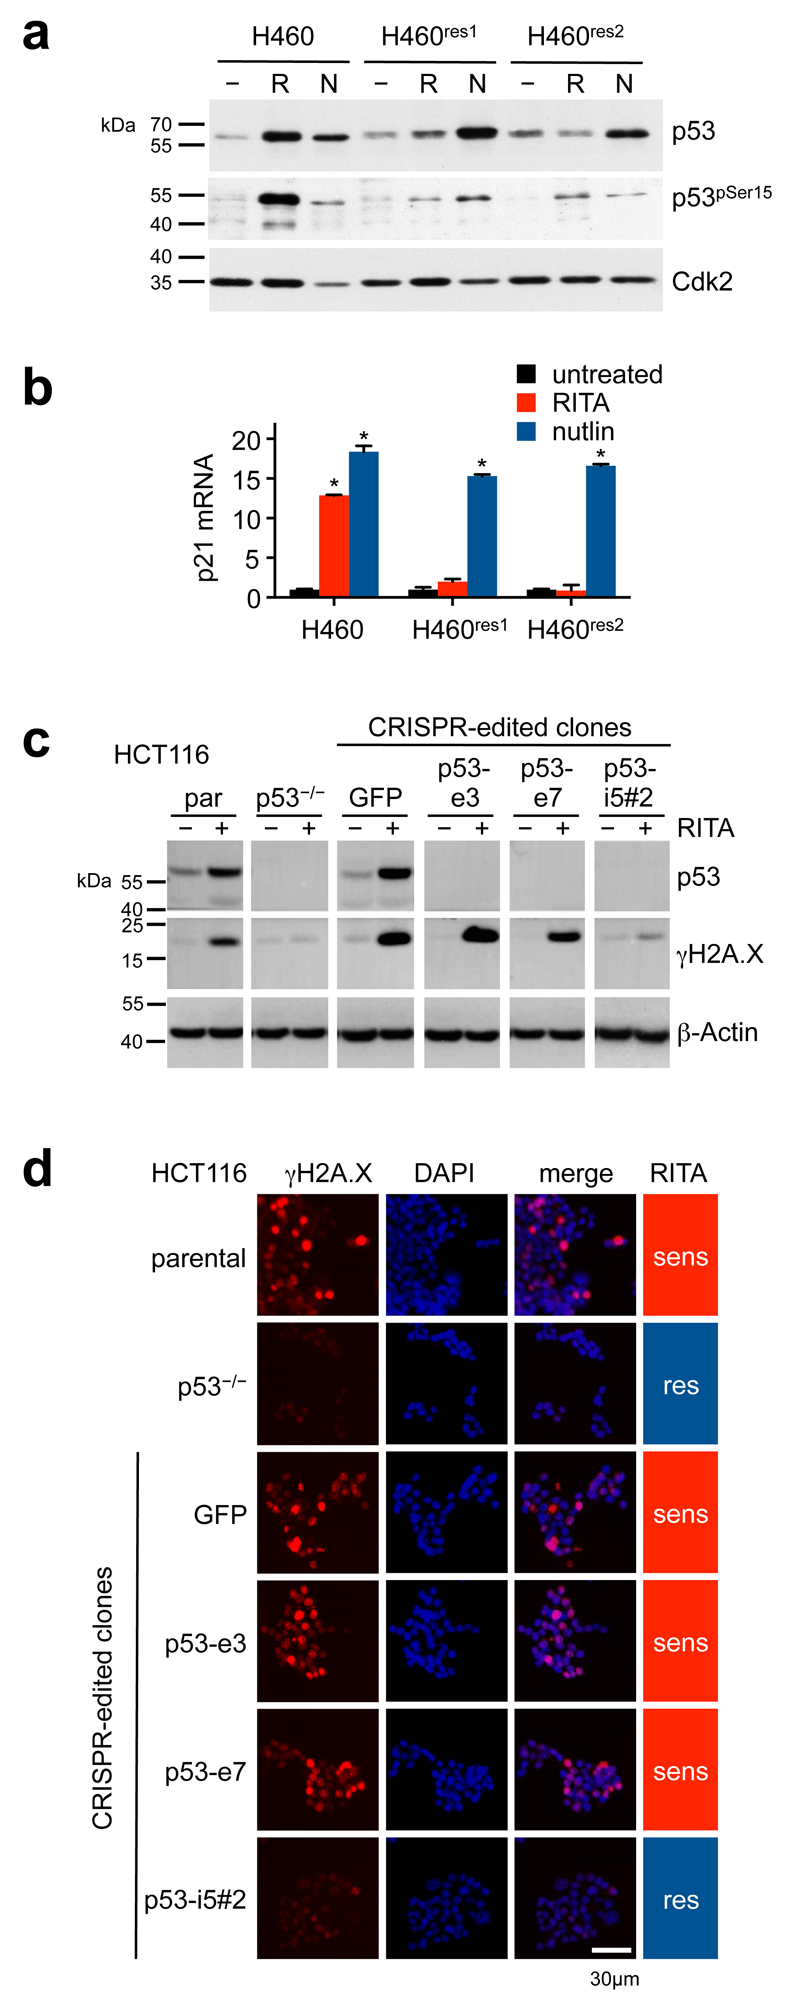
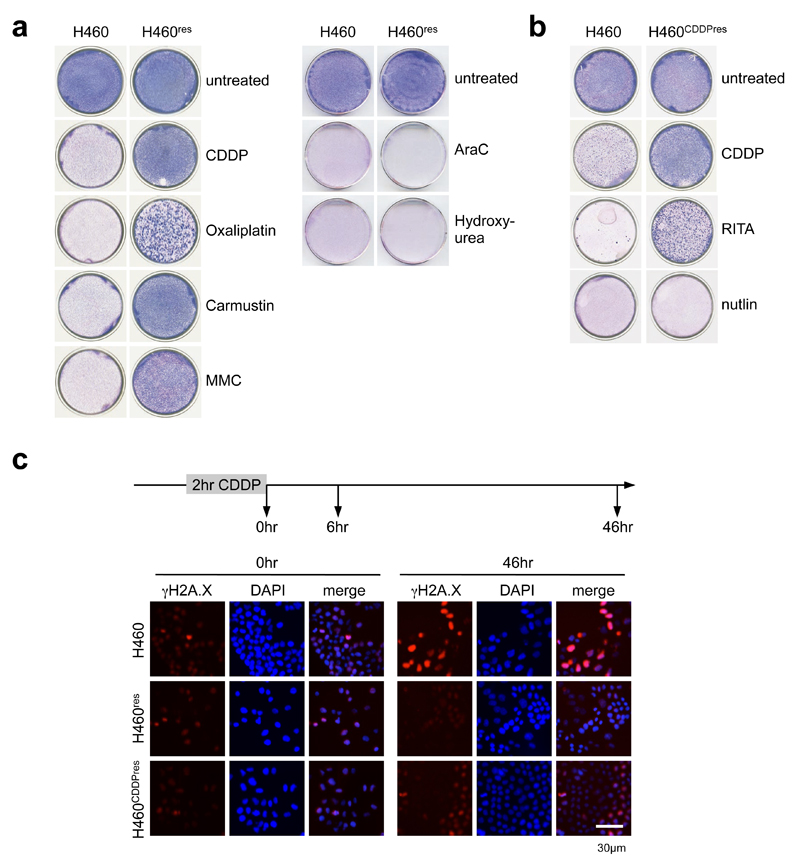
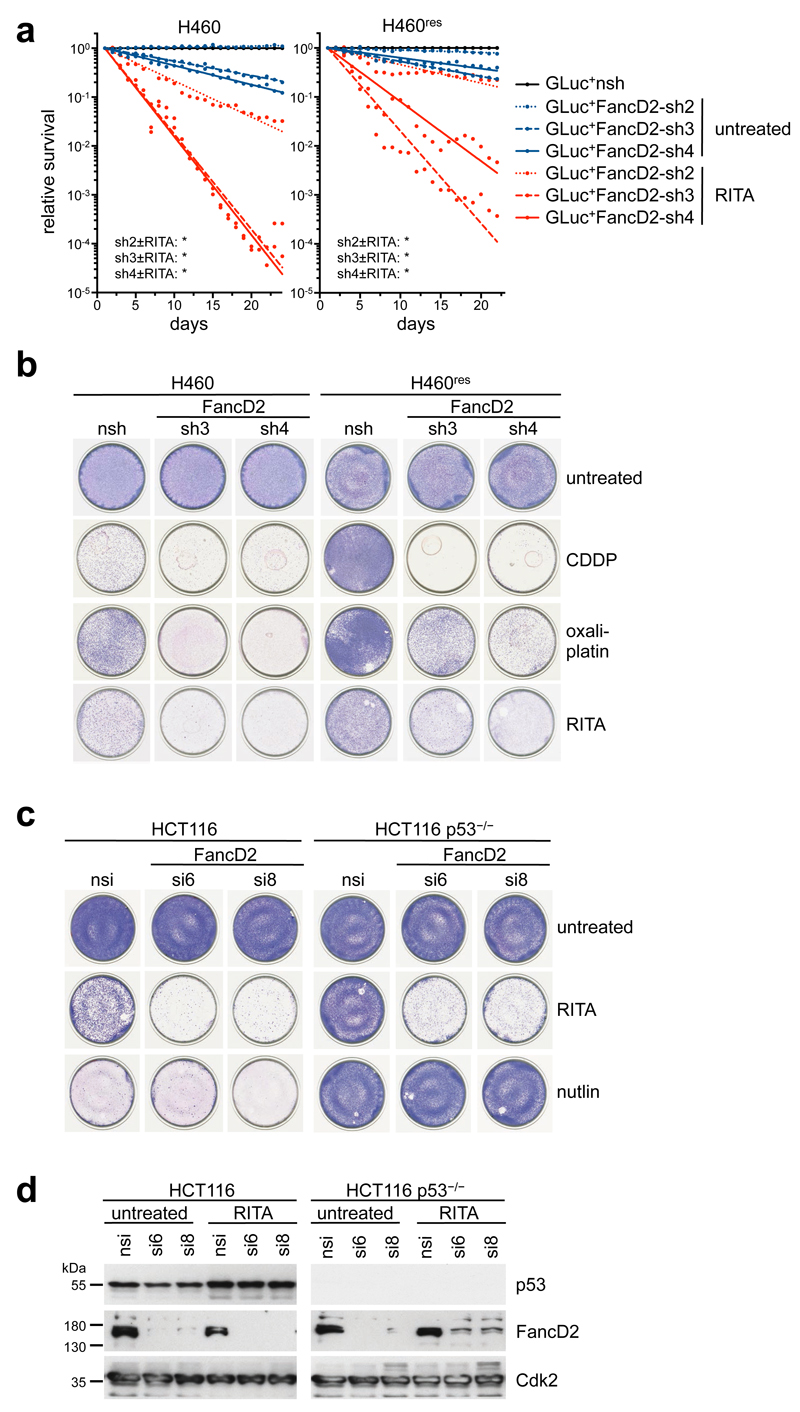
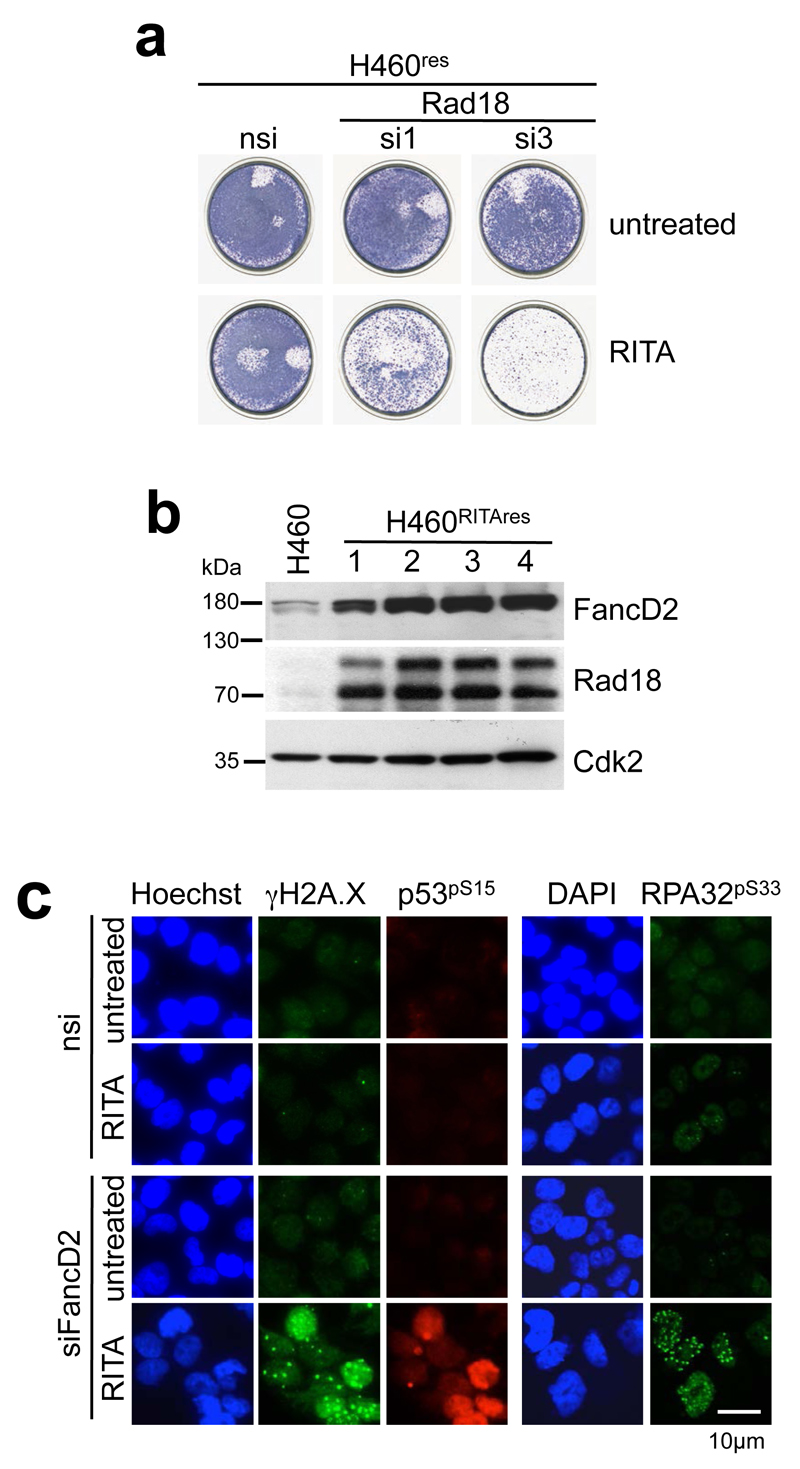
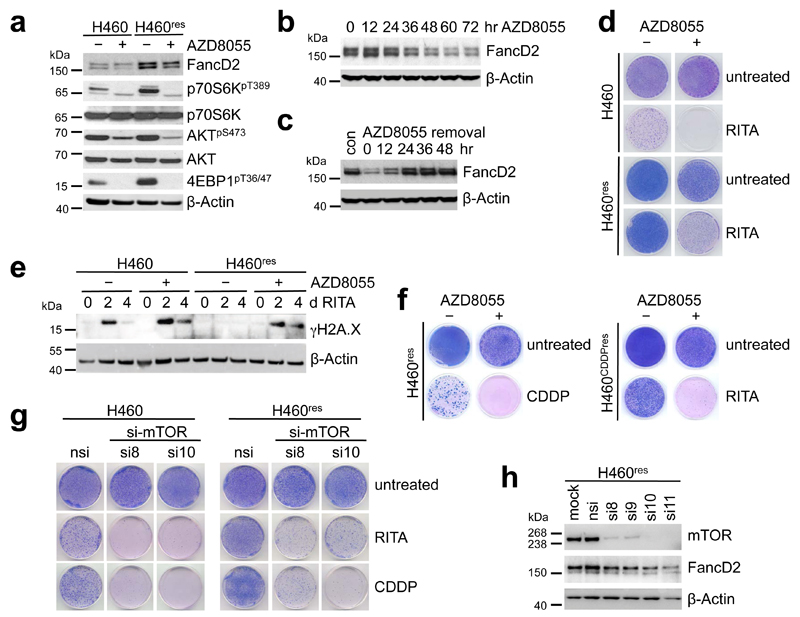
Inactivation of the p53 tumor suppressor by Mdm2 is one of the most frequent events in cancer, so compounds targeting the p53-Mdm2 interaction are promising for cancer therapy. Mechanisms conferring resistance to p53-reactivating compounds are largely unknown. Here we show using CRISPR-Cas9-based target validation in lung and colorectal cancer that the activity of nutlin, which blocks the p53-binding pocket of Mdm2, strictly depends on functional p53. In contrast, sensitivity to the drug RITA, which binds the Mdm2-interacting N terminus of p53, correlates with induction of DNA damage. Cells with primary or acquired RITA resistance display cross-resistance to DNA crosslinking compounds such as cisplatin and show increased DNA cross-link repair. Inhibition of FancD2 by RNA interference or pharmacological mTOR inhibitors restores RITA sensitivity. The therapeutic response to p53-reactivating compounds is therefore limited by compound-specific resistance mechanisms that can be resolved by CRISPR-Cas9-based target validation and should be considered when allocating patients to p53-reactivating treatments.


Conflict of interest statement

Competing financial interests

The authors declare no competing financial interests.

Figures

Figure 1
Figure 1. p53-deficient cells are resistant to nutlin but not RITA.
(a) Schematic outline of CRISPR-Cas9–based p53 enrichment assay. WT, wild type. (b) Schematic representation of the TP53 gene locus. Cleavage sites (black triangles) of CRISPR-Cas9 nucleases and primers (arrows) used for PCR analysis are indicated. (c) Enrichment of cells with TP53 indel mutations. Shown are percentages of mutated sequencing reads in cells treated with 7 μM nutlin or 1 μM RITA for the indicated time points. Enrichment versus untreated cells at day 0 was tested for significance using the nonparametric Friedman′s test and corrected for multiple comparisons using Dunn′s test (*P < 0.05; **P < 0.01; NS, not significant). (d) Enrichment of cells with deletion of exons 2–9 in TP53. Cells cotransfected with a nuclease pair were treated as in c for 10 d and analyzed by qPCR for deletion of exons 2–9. Shown is the fold enrichment in treated versus untreated cells (mean ± s.d., n = 3). Enrichment versus untreated cells was tested for significance by nonparametric Friedman′s test corrected for multiple comparisons by Dunn′s test (**P < 0.01; NS, not significant). (e) Colony formation of HCT116 parental and HCT116 p53−/− (ref. 17) cells under the indicated treatments compared to CRISPR-Cas9-generated single cell clones with small indels or large deletions in TP53. ‘GFP’ represents negative control cells transfected with a GFP-targeted nuclease. Western blots confirm the successful inactivation of p53. Relative clonogenicity is shown as mean ± s.d. (n = 4). MW, molecular weight; R, RITA treatment; N, nutlin treatment.
Figure 2
Figure 2. RITA sensitivity correlates with induction of DNA damage.
(a,b) Expression of p53 protein, p53-Ser15 phosphorylation and p21 mRNA of parental H460 cells and two RITA-resistant H460 cell pools treated as indicated for 24 h (R, 1 μM RITA; N, 10 μM nutlin). p21 expression is shown normalized to GAPDH expression and relative to untreated cells (mean ± s.d. n = 3; *, P < 0.0001, by two-way analysis of variance and Sidak′s multiple comparisons test) by western blotting (a) and RTqPCR( b). MW, molecular weight; R, RITA treatment; N, nutlin treatment. (c,d) Expression of p53 and γH2A.X in parental and HCT116 derivate clones after a 16 h treatment with 1 μM RITA, as shown by western blotting (c) and immunofluorescence (d). Color bars indicate RITA sensitivity, as in Figure 1e.
Figure 3
Figure 3. RITA resistant cells are cross-resistant to cisplatin.
(a) Colony formation of parental and RITA-resistant H460 cells 7 d following a 3-d treatment with 3 μΜ CDDP, 8 μg ml−1 oxaliplatin, 50 μg ml−1 carmustin and 0.05 μg ml−1 mitomycin C (MMC) or treated continuously with 0.5 μg ml−1 cytarabin (AraC) and 0.5 mM hydroxyurea. (b) Colony formation of parental and CDDP-resistant H460 cells continuously treated with 3 μM CDDP, 1 μM RITA and 10 μM nutlin. (c) Increased DNA damage repair in RITA- and CDDP-resistant H460 cells. Immunofluorescence analysis of γH2A.X at indicated time points following a 2-h treatment with 16 μM CDDP is shown.
Figure 4
Figure 4. RITA resistance is mediated by FancD2.
(a) Parental and RITA-resistant H460 cells transduced with lentiviral vectors expressing secreted luciferases (GLuc or CLuc) coupled to shRNA targeting FancD2. FancD2 knockdown sensitizes parental (left) and RITA-resistant (right) H460 cells to RITA in a competitive co-culture setting. Shown is the relative mean survival of GLuc+ cells expressing the indicated shRNAs in 1:1 cocultures with CLuc+ NSH cells assayed in triplicate (n = 3) in the absence (blue) or presence (red) of RITA (parental: 0.125 μM, resistant: 2 μM). *P < 0.0001; statistical significance between treated and untreated cell mixtures was assessed by two-way analysis of variance with Tukey's multiple comparisons test. (b) Colony formation of parental and RITA-resistant H460 cells transduced with the indicated shRNAs treated continuously with 1 μM RITA or for 3 d with 8 μg ml−1 oxaliplatin and 3 μM CDDP. (c,d) FancD2 knockdown sensitizes parental HCT116 and HCT116 p53−/− cells to RITA but not nutlin, as shown by a colony formation assay (c) and western blotting (d). MW, molecular weight; NSH, non-targeting negative control shRNA; NSI, non-targeting negative control siRNA; si6 and si8, FancD2-targeting siRNAs.
Figure 5
Figure 5. RAD18 depletion sensitizes to RITA.
(a) Colony formation of RITA-resistant H460 cells treated with 2 μM RITA following knockdown of Rad18. NSI, non-targeting negative control siRNA; si1 and si3, Rad18-targeting siRNAs. (b) Western blotting reveals high-level expression of FancD2 and Rad18 in multiple different RITA-resistant H460 clones compared to parental H460 cells. MW, molecular weight. (c) Immunofluorescence analysis indicates induction of DNA damage markers γH2A.X and RPA32 phosphorylated at Ser33 (RPA32pS33) in FancD2-depleted H460 cells following 3-d treatment with 2 μM RITA.
Figure 6
Figure 6. RITA resistance is overcome with mTOR inhibitors.
(a) Elevated mTOR signaling in RITA-resistant H460 cells. Western blot of parental H460 and RITA-resistant H460res cells in the presence and absence mTOR kinase inhibitor AZD8055, respectively. MW, molecular weight. (b) mTOR inhibition results in progressive downregulation of FancD2 in RITA-resistant H460res cells treated with AZD8055 for the indicated time points. (c) FancD2 downregulation by 3-d treatment of RITA-resistant H460res cells with AZD8055 is reversible upon removal of AZD8055 within 24–48 h. (d) AZD8055 reduces clonogenic growth of RITA-treated parental and RITA-resistant H460res cells. Cells were grown in the absence or presence of AZD8055 for 3 d, treated with a combination of AZD8055 and RITA for 3 d, and finally treated with RITA only for a further 7 d. H460, 1 μΜ RITA; H460res, 2 μΜ RITA. (e) AZD8055 treatment enhances γH2A.X induction by RITA. (f) AZD8055 reduces clonogenic growth of RITA-resistant H460res cells treated for 3 d with 3.3 μΜ CDDP and of CDDP-resistant H460CDDP treated continuously with 1 μΜ RITA. (g,h) mTOR knockdown reduces clonogenic growth of parental H460 and RITA-resistant H460res cells treated continuously with 1 μΜ RITA or for 3 d with 3.3 μΜ CDDP. Western blotting confirms mTOR knockdown efficiency. In all experiments, AZD8055 was used at 1 μΜ for H460 and at 2 μΜ for H460res and H460CDDPres. si8-11, mTOR-targeting siRNAs.

Similar articles

Cited by

References

    1. Pant V, Lozano G. Limiting the power of p53 through the ubiquitin proteasome pathway. Genes Dev. 2014;28:1739–1751. - PMC - PubMed
    1. Ventura A, et al. Restoration of p53 function leads to tumour regression in vivo. Nature. 2007;445:661–665. - PubMed
    1. Martins CP, Brown-Swigart L, Evan GI. Modeling the therapeutic efficacy of p53 restoration in tumors. Cell. 2006;127:1323–1334. - PubMed
    1. Xue W, et al. Senescence and tumour clearance is triggered by p53 restoration in murine liver carcinomas. Nature. 2007;445:656–660. - PMC - PubMed
    1. Feldser DM, et al. Stage-specific sensitivity to p53 restoration during lung cancer progression. Nature. 2010;468:572–575. - PMC - PubMed

Publication types

MeSH terms