. 2016 Jan;19(1):117-26.
doi: 10.1038/nn.4173. Epub 2015 Nov 23.

Mesolimbic dopamine signals the value of work

Affiliations

Mesolimbic dopamine signals the value of work

Arif A Hamid et al. Nat Neurosci. 2016 Jan.

Abstract

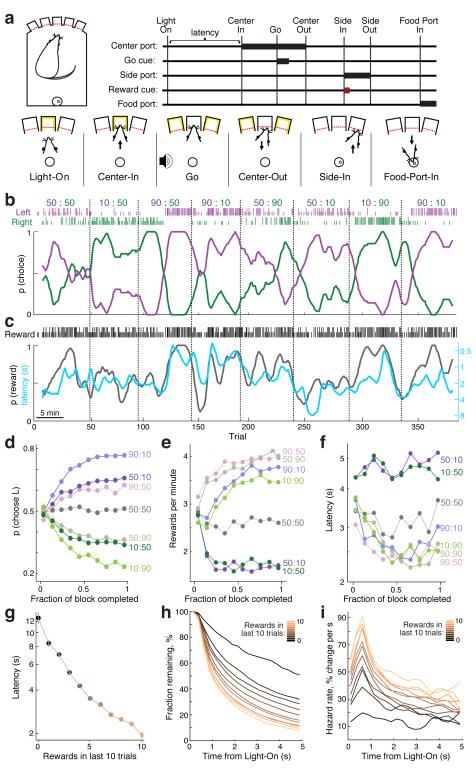
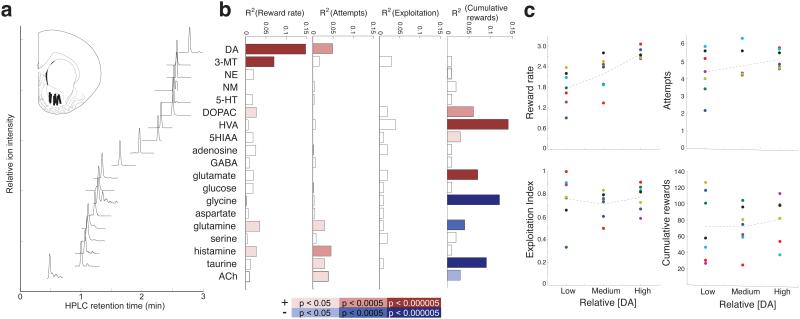
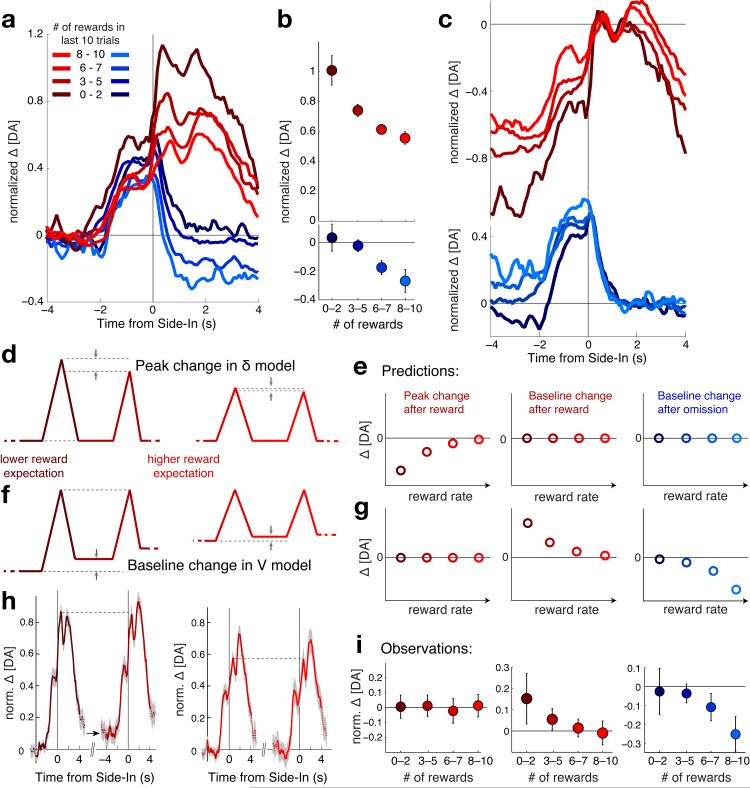
Dopamine cell firing can encode errors in reward prediction, providing a learning signal to guide future behavior. Yet dopamine is also a key modulator of motivation, invigorating current behavior. Existing theories propose that fast (phasic) dopamine fluctuations support learning, whereas much slower (tonic) dopamine changes are involved in motivation. We examined dopamine release in the nucleus accumbens across multiple time scales, using complementary microdialysis and voltammetric methods during adaptive decision-making. We found that minute-by-minute dopamine levels covaried with reward rate and motivational vigor. Second-by-second dopamine release encoded an estimate of temporally discounted future reward (a value function). Changing dopamine immediately altered willingness to work and reinforced preceding action choices by encoding temporal-difference reward prediction errors. Our results indicate that dopamine conveys a single, rapidly evolving decision variable, the available reward for investment of effort, which is employed for both learning and motivational functions.


Figures

Figure 1
Figure 1. Adaptive choice and motivation in the trial-and-error task
(a) Sequence of behavioral events (in rewarded trials). (b) Choice behavior in a representative session. Numbers at top denote nominal block-by-block reward probabilities for left (purple) and right (green) choices. Tick marks indicate actual choices and outcomes on each trial (tall ticks indicate rewarded trials, short ticks unrewarded). The same choice data is shown below in smoothed form (thick lines; 7-trial smoothing). (c) Relationship between reward rate and latency for the same session. Here tick marks are used to indicate only whether trials were rewarded or not, regardless of choice. Solid black line shows reward rate, and cyan line shows latency (on inverted log scale), both smoothed in the same way as B. (d) Choices progressively adapt towards the block reward probabilities (data set for panels d-i: n = 14 rats, 125 sessions, 2738 +/− 284 trials per rat). (e) Reward rate breakdown by block reward probabilities. (f) Latencies by block reward probabilities. Latencies become rapidly shorter when reward rate is higher. (g) Latencies by proportion of recent trials rewarded. Error bars represent s.e.m. (h) Latency distributions presented as survivor curves (i.e. the average fraction of trials for which the Center-In event has not yet happened, by time elapsed from Light-On) broken down by proportion of recent trials rewarded. (i) Same latency distributions as panel h, but presented as hazard rates (i.e. the instantaneous probability that the Center-In event will happen, if it has not happened yet). The initial bump in the first second after Light-On reflects engaged trials (see Supplementary Fig.1), after that hazard rates are relatively stable and continue to scale with reward history.
Figure 2
Figure 2. Minute-by-minute dopamine levels track reward rate
(a) Total ion chromatogram of a single representative microdialysis sample, illustrating the set of detected analytes in this experiment. X-axis indicates HPLC retention times, y-axis indicates intensity of ion detection for each analyte (normalized to peak values). (Inset) locations of each microdialysis probe within the nucleus accumbens (all data shown in the same Paxinos atlas section; six were on the left side and one on the right). Abbreviations: DA, dopamine; 3-MT, 3-methoxytyramine; NE, norepinephrine; NM, normetanephrine; 5-HT, serotonin; DOPAC, 3,4-dihydroxyphenylacetate acid; HVA, homovanillic acid; 5HIAA, 5-hydroxyindole-3-acetic acid, GABA, γ-aminobutyric acid; ACh, acetylcholine. (b) Regression analysis results indicating strength of linear relationships between each analyte and each of four behavioral measures (reward rate; number of attempts; exploitation index; and cumulative rewards). Data are from 6 rats (7 sessions, total of 444 one-minute samples). Color scale shows p-values, Bonferroni-corrected for multiple comparisons (4 behavioral measures * 19 analytes), with red bars indicating a positive relationship and blue bars a negative relationship. Since both reward rate and attempts showed significant correlations with [DA], we constructed a regression model that included these predictors and an interaction term. In this model R2 remained at 0.15 and only reward rate showed a significant partial effect (p < 2.38×10⁻¹²). (c) An alternative assessment of the relationship between minute-long [DA] samples and behavioral variables. Within each of the seven sessions [DA] levels were divided into three equal-sized bins (LOW, MEDIUM, HIGH); different colors indicate different sessions. For each behavioral variable, means were compared across [DA] levels using one-way ANOVA. There was a significant main effect of reward rate (F(2,18)=10.02, p=0.0012), but no effect of attempts (F(2,18)=1.21, p=0.32), exploitation index (F(2,18)=0.081, p=0.92), or cumulative rewards (F(2,18)=0.181, p=0.84). Post-hoc comparisons using the Tukey test revealed that the mean reward rates of LOW and HIGH [DA] differed significantly (p=0.00082). See also Supplementary Figs. 2,3.
Figure 3
Figure 3. A succession of within-trial dopamine increases
(a) Examples of FSCV data from a single session. Color plots display consecutive voltammograms (every 0.1s) as a vertical colored strip; examples of individual voltammograms are shown at top (taken from marked time points). Dashed vertical lines indicate Side-In events for rewarded (red) and unrewarded (blue) trials. Black traces below indicate raw current values, at the applied voltage corresponding to the dopamine peak. (b) [DA] fluctuations for each of the 312 completed trials of the same session, aligned to key behavioral events. For Light-On and Center-In alignments, trials are sorted by latency (pink dots mark Light-On times; white dots mark Center-In times). For the other alignments rewarded (top) and unrewarded (bottom) trials are shown separately, but otherwise in the order in which they occurred. [DA] changes aligned to Light-On were assessed relative to a 2s baseline period, ending 1s before Light-On. For the other alignments, [DA] is shown relative to a 2s baseline ending 1s before Center-In. (c) Average [DA] changes during a single session (same data as b; shaded area represents s.e.m.). (d) Average event-aligned [DA] change across all six animals, for rewarded and unrewarded trials (see Supplementary Fig.4 for each individual session). Data are normalized by the peak average rewarded [DA] in each session, and are shown relative to the same baseline epochs as in b. Black arrows indicate increasing levels of event-related [DA] during the progression through rewarded trials. Colored bars at top indicate time periods with statistically significant differences (red, rewarded trials greater than baseline, one-tailed t-tests for each 100ms time point individually; blue, same for unrewarded trials; black, rewarded trials different to unrewarded trials, 2-tailed t-tests; all statistical thresholds set to p=0.05, uncorrected).
Figure 4
Figure 4. Within-trial dopamine fluctuations reflect state value dynamics
(a) Top, Temporal discounting: the motivational value of rewards is lower when they are distant in time. With the exponential discounting commonly used in RL models, value is lower by a constant factor γ for each time step of separation from reward. People and other animals may actually use hyperbolic discounting which can optimize reward rate (since rewards/time is inherently hyperbolic). Time parameters are here chosen simply to illustrate the distinct curve shapes. Bottom. Effect of reward cue, or omission, on state value. At trial start the discounted value of a future reward will be less if that reward is less likely. Lower value provides less motivational drive to start work - producing e.g. longer latencies. If a cue signals that upcoming reward is certain, the value function jumps up to the (discounted) value of that reward. For simplicity, the value of subsequent rewards is not included. (b) The reward prediction error δ reflects abrupt changes in state value. If the discounted value of work reflects an unlikely reward (e.g. probability = 0.25) a reward cue prompts a larger δ than if the reward was likely (e.g. probability = 0.75). Note that in this idealized example, δ would be zero at all other times. (c) Top, Task events signal updated times-to-reward. Data is from the same example session as Fig.3c. Bright red indicates times to the very next reward, dark red indicates subsequent rewards. Green arrowheads indicate average times to next reward (harmonic mean, only including rewards in the next 60s). As the trial progresses, average times-to-reward get shorter. If the reward cue is received, rewards are reliably obtained ~2s later. Task events are considered to prompt transitions between different internal states (Supplementary Fig.5) whose learned values reflect these different experienced times-to-reward. (d) Average state value of the RL model for rewarded (red) and unrewarded (blue) trials, aligned on the Side-In event. The exponentially-discounting model received the same sequence of events as in Fig.3c, and model parameters (γ=0.68, γ=0.98) were chosen for the strongest correlation to behavior (comparing state values at Center-In to latencies in this session, Spearman r=-0.34). Model values were binned at 100ms, and only bins with at least 3 events (state transitions) were plotted. (e) Example of the [DA] signal during a subset of trials from the same session, compared to model variables. Black arrows indicate Center-In events, red arrows Side-In with Reward Cue, blue arrows Side-In alone (Omission). Scale bars are: [DA], 20nM; V, 0.2; δ, 0.2. Dashed grey lines mark the passage of time in 10s intervals. (f) Within-trial [DA] fluctuations are more strongly correlated with model state value (V) than with RPE (δ). For every rat the [DA] : V correlation was significant (number of trials for each rat: 312, 229, 345, 252, 200, 204; p<10−14 in each case; Wilcoxon signed-rank test of null hypothesis that median correlation within trials is zero) and significantly greater than the [DA] : δ correlation (p<10−24 in each case, Wilcoxon signed-rank test). Groupwise, both [DA] : V and [DA] : δ correlations were significantly non-zero, and the difference between them was also significant (n=6 sessions, all comparisons p=0.031, Wilcoxon signed-rank test). Model parameters (γ=0.4, γ =0.95) were chosen to maximize the average behavioral correlation across all 6 rats (Spearman r = −0.28), but the stronger [DA] correlation to V than to δ was seen for all parameter combinations (Supplementary Fig.5). (g) Model variables were maximally correlated with [DA] signals ~0.5s later, consistent with a slight delay caused by the time taken by the brain to process cues, and by the FSCV technique.
Figure 5
Figure 5. Between-trial dopamine shifts reflect updated state values
(a) Less-expected outcomes provoke larger changes in [DA]. [DA] data from all FSCV sessions together (as in Fig.3d), broken down by recent reward history and shown relative to pre-trial “baseline" (−3 to −1s relative to Center-In). Note that the [DA] changes after reward omission last at least several seconds (shift in level), rather than showing a highly transient dip followed by return to baseline as might be expected for encoding RPEs alone. (b) Quantification of [DA] changes, between baseline and reward feedback (0.5-1.0s after Side-In for rewarded trials, 1s-3s after Side-In for unrewarded trials). Error bars show SEM. (c) Same data as (a), but plotted relative to [DA] levels after reward feedback. These [DA] observations are consistent with a variable “baseline” whose level depends on recent reward history (as in Fig.4b model). (d) Alternative accounts of [DA] make different predictions for between-trial [DA] changes. When reward expectation is low, rewarded trials provoke large RPEs, but across repeated consecutive rewards RPEs should decline. Therefore if absolute [DA] levels encode RPE, the peak [DA] evoked by the reward-cue should decline between consecutive rewarded trials (and baseline levels should not change). For simplicity this cartoon omits detailed within-trial dynamics. (e) Predicted pattern of [DA] change under this account, which also does not predict any baseline shift after reward omissions (right). (f) If instead [DA] encodes state values, then peak [DA] should not decline from one reward to the next, but the baseline level should increase (and decrease following unrewarded trials). (g) Predicted pattern of [DA] change for this alternative account. (h) Unexpected rewards cause a shift in baseline, not in peak [DA]. Average FSCV data from consecutive pairs of rewarded trials (all FSCV sessions combined, as in a), shown relative to the pre-trial baseline of the first trial in each pair. Data were grouped into lower reward expectation (left pair of plots, 165 total trials; average time between Side-In events = 11.35s +/− 0.22s SEM) and higher reward expectation (right pair of plots, 152 total trials; time between Side-In events = 11.65s +/− 0.23s) by a median split of each individual session (using # rewards in last 10 trials). Dashed lines indicate that reward cues evoked a similar absolute level of [DA] in the second rewarded trial, compared to the first. Black arrow indicates the elevated pre-trial [DA] level for the second trial in the pair (mean change in baseline [DA] = 0.108, p=0.013, one-tailed Wilcoxon signed rank test). No comparable change was observed if the first reward was more expected (right pair of plots; mean change in baseline [DA] = 0.0013, p=0.108, one-tailed Wilcoxon signed rank test). (i) [DA] changes between consecutive trials follow the pattern expected for value coding, rather than RPE coding alone.
Figure 6
Figure 6. Phasic dopamine manipulations affect both learning and motivation
(a) FSCV measurement of optogenetically-evoked [DA] increases. Optic fibers were placed above VTA, and [DA] change examined in nucleus accumbens core. Example shows dopamine release evoked by a 0.5s stimulation train (average of 6 stimulation events, shaded area indicates +/−SEM). (b) Effect of varying the number of laser pulses on evoked dopamine release, for the same 30Hz stimulation frequency. (c) Dopaminergic stimulation at Side-In reinforces the chosen left or right action. Left, in TH-Cre+ rats stimulation of ChR2 increased the probability that the same action would be repeated on the next trial. Circles indicate average data for each of 6 rats (3 sessions each, 384 trials/session ± 9.5 SEM). Middle, this effect did not occur in TH-Cre littermate controls (6 rats, 3 sessions each, 342±7 trials/session). Right, in TH-Cre+ rats expressing Halorhodopsin, orange laser stimulation at Side-In reduced the chance that the chosen action was repeated on the next trial (5 rats, 3 sessions each, 336±10 trials/session). See Supplementary Fig.8 for additional analyses. (d) Laser stimulation at Light-On causes a shift towards sooner engagement, if the rats were not already engaged. Latency distribution (on log scale, 10 bins per log unit) for non-engaged, completed trials in TH-Cre+ rats with ChR2 (n=4 rats with video analysis; see Supplementary Fig.9 for additional analyses). (e) Same latency data as d, but presented as hazard rates. Laser stimulation (blue ticks at top left) increases the chance that rats will decide to initiate an approach, resulting in more Center-In events 1-2s later (for these n=4 rats, one-way ANOVA on hazard rate F(1,3) = 18.1, p=0.024). See Supplementary Fig.10 for hazard rate time courses from the individual rats.

References

    1. Reynolds JN, Hyland BI, Wickens JR. A cellular mechanism of reward-related learning. Nature. 2001;413:67–70. - PubMed
    1. Schultz W, Dayan P, Montague PR. A neural substrate of prediction and reward. Science. 1997;275:1593–9. - PubMed
    1. Day JJ, Roitman MF, Wightman RM, Carelli RM. Associative learning mediates dynamic shifts in dopamine signaling in the nucleus accumbens. Nat Neurosci. 2007;10:1020–8. doi:nn1923 [pii] 10.1038/nn1923. - PubMed
    1. Hart AS, Rutledge RB, Glimcher PW, Phillips PE. Phasic dopamine release in the rat nucleus accumbens symmetrically encodes a reward prediction error term. J Neurosci. 2014;34:698–704. doi:10.1523/JNEUROSCI.2489-13.2014. - PMC - PubMed
    1. Kim KM, Baratta MV, Yang A, Lee D, Boyden ES, Fiorillo CD. Optogenetic mimicry of the transient activation of dopamine neurons by natural reward is sufficient for operant reinforcement. PLoS One. 2012;7:e33612. doi:10.1371/journal.pone.0033612. - PMC - PubMed

Publication types