. 2016 Jan;19(1):143-9.
doi: 10.1038/nn.4168. Epub 2015 Nov 23.

Task-specific versus generalized mnemonic representations in parietal and prefrontal cortices

Affiliations

Task-specific versus generalized mnemonic representations in parietal and prefrontal cortices

Arup Sarma et al. Nat Neurosci. 2016 Jan.

Abstract

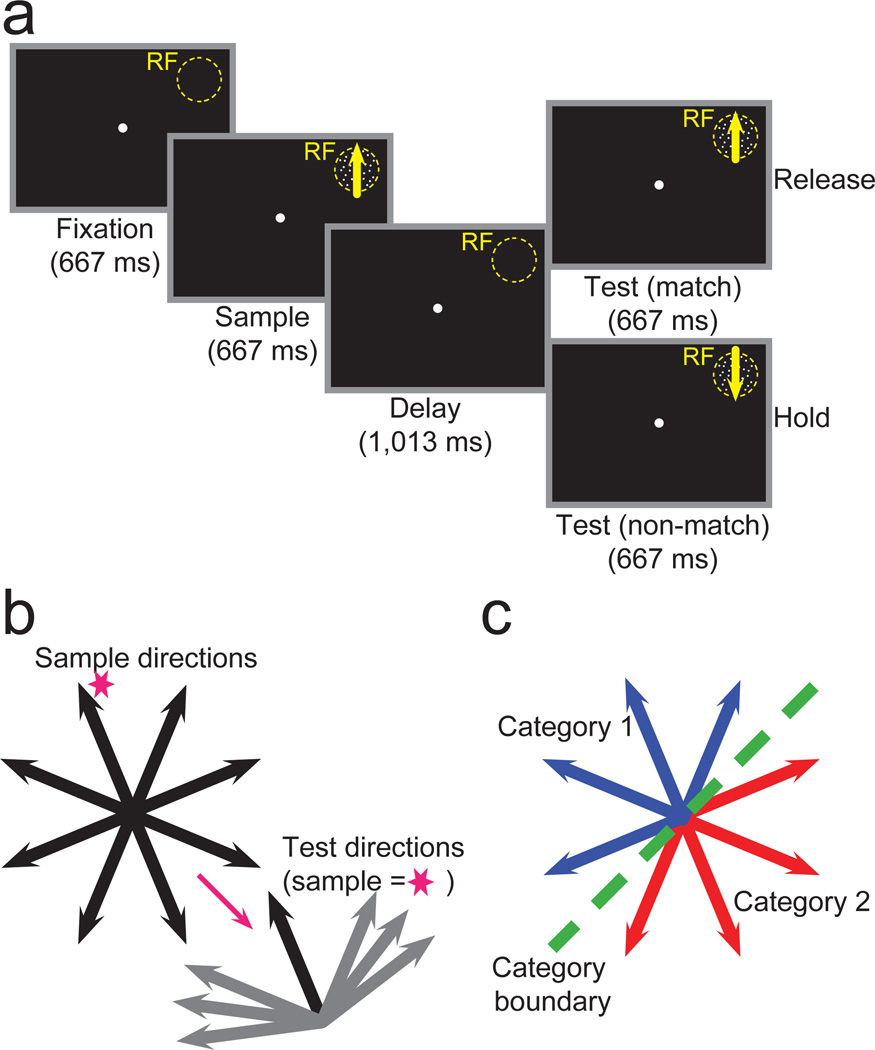
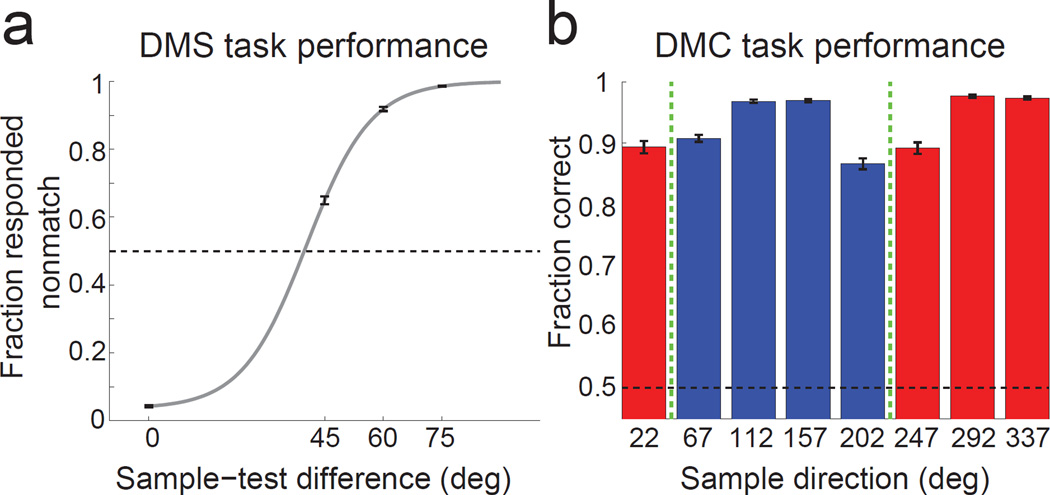
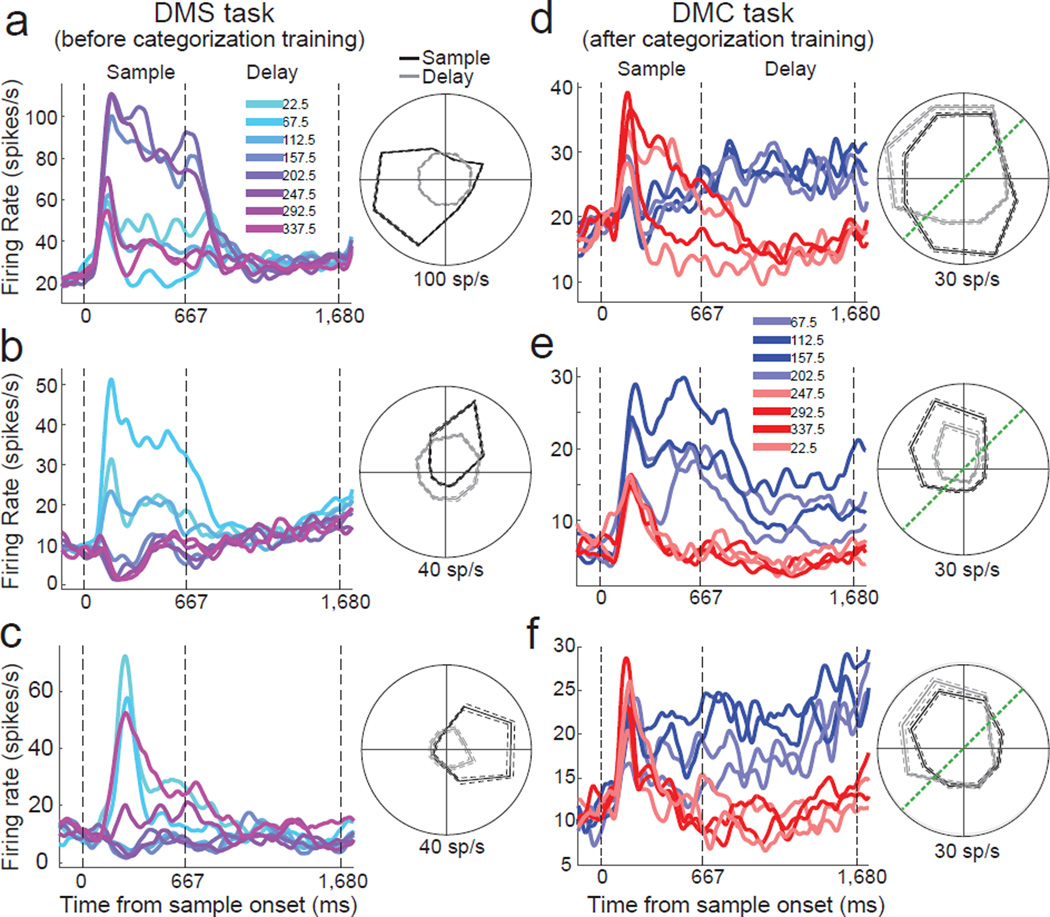
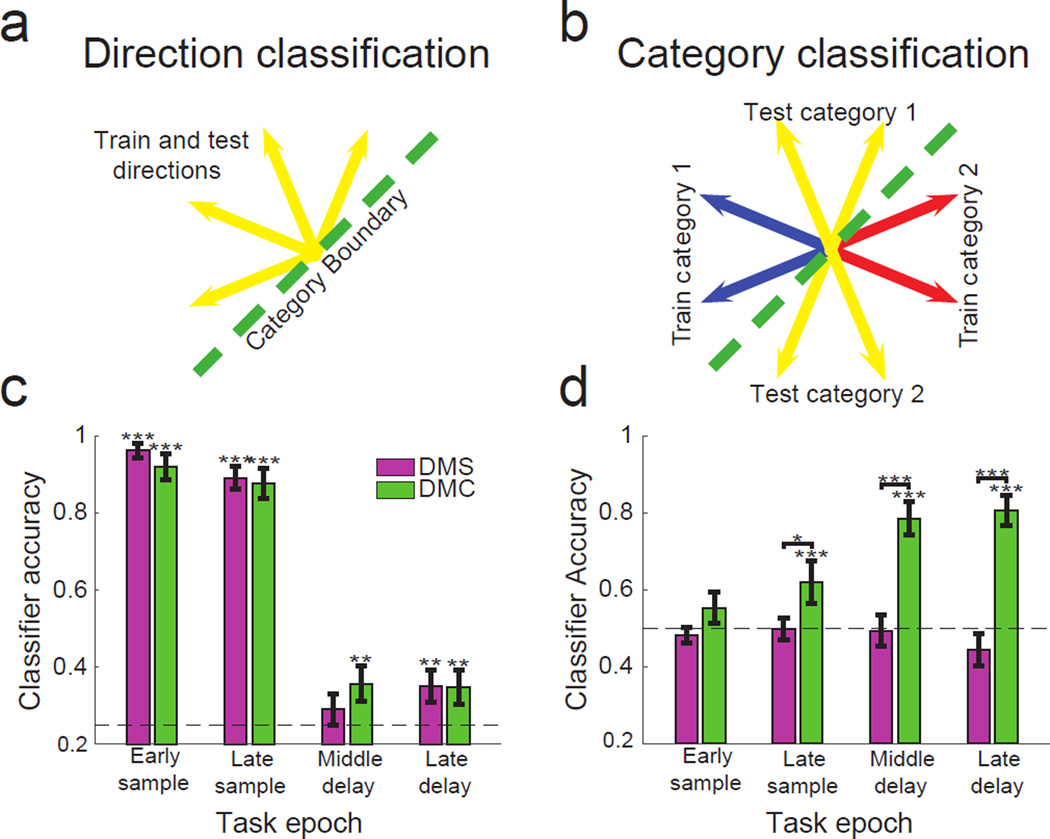
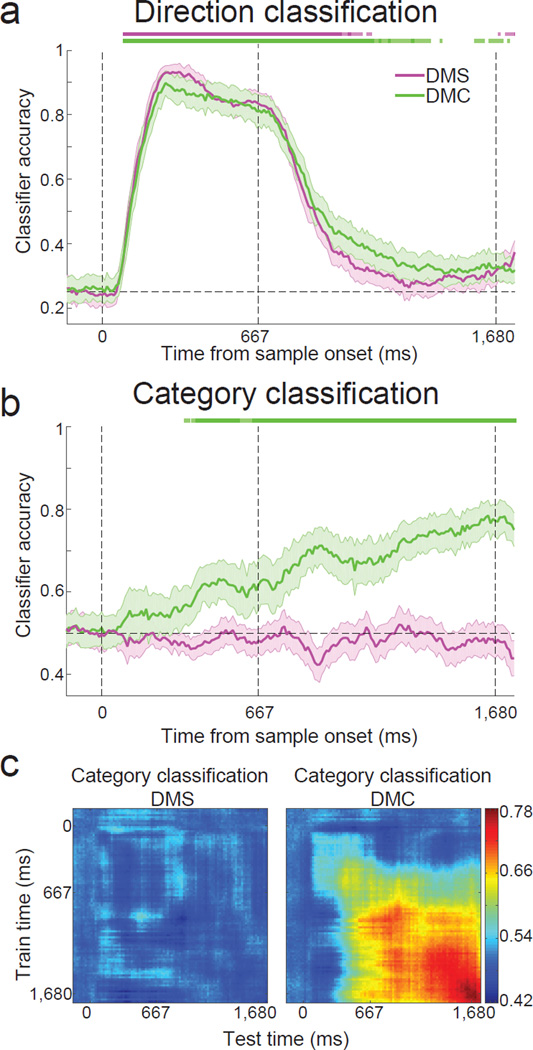
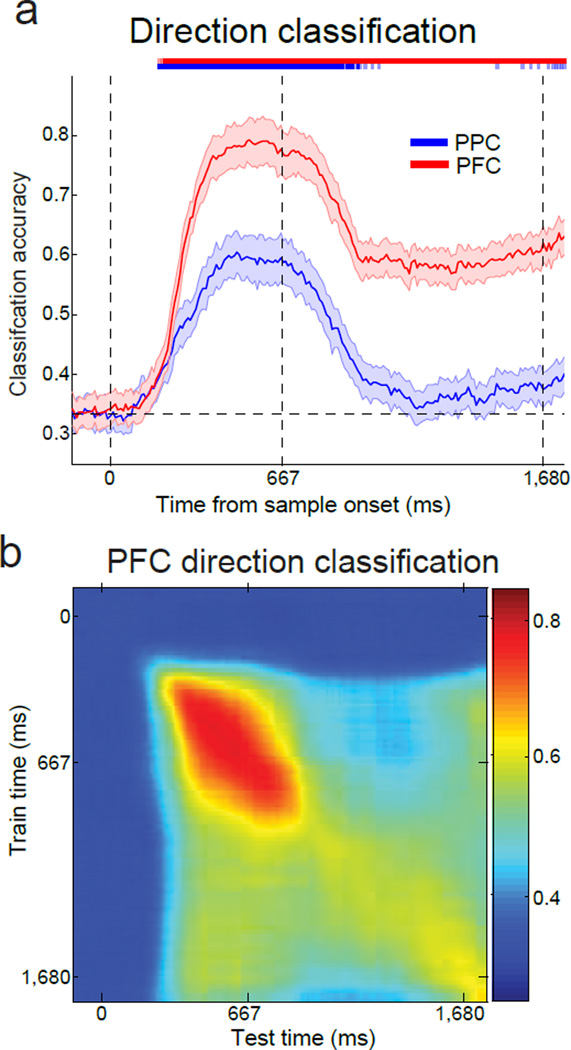
Our ability to learn a wide range of behavioral tasks is essential for responding appropriately to sensory stimuli according to behavioral demands, but the underlying neural mechanism has been rarely examined by neurophysiological recordings in the same subjects across learning. To understand how learning new behavioral tasks affects neuronal representations, we recorded from posterior parietal cortex (PPC) before and after training on a visual motion categorization task. We found that categorization training influenced cognitive encoding in PPC, with a marked enhancement of memory-related delay-period encoding during the categorization task that was absent during a motion discrimination task before categorization training. In contrast, the prefrontal cortex (PFC) exhibited strong delay-period encoding during both discrimination and categorization tasks. This reveals a dissociation between PFC's and PPC's roles in working memory, with general engagement of PFC across multiple tasks, in contrast with more task-specific mnemonic encoding in PPC.


Figures

Figure 1
Figure 1. DMS and DMC tasks
(a) Monkeys performed a delayed matching task and indicated (by releasing a lever) whether sample and test stimuli, separated by a memory delay, were identical (DMS) or category (DMC) matches. If the sample and test stimuli weren’t matches, the monkey was required to continue holding the lever throughout the test period and a second delay period until a second, matching test stimulus appeared. Stimuli were shown in a neuron’s RF. (b) Monkeys viewed eight motion directions as sample stimuli during DMS task recordings (left). Test stimuli were either identical matches or 45°, 60°, or 75° from the sample stimulus. As an example, the possible non-matching test directions are shown for the sample direction indicated by the magenta star. (c) Monkeys grouped the same eight motion directions used as sample directions during the DMS task into two categories (corresponding to the red and blue arrows) separated by a learned category boundary (dashed green line). Test and sample stimuli sets were identical.
Figure 2
Figure 2. Behavioral performance
(a) The monkeys’ average DMS performance (proportion reported as nonmatch) is shown as a function of sample-test difference. The gray line is a sigmoid curve fit to the behavioral data. The dashed black line indicates chance performance. Error bars indicate standard error of mean (SEM). (b) The monkeys’ average DMC performance is shown as a function of sample direction. Colors correspond to the two categories and the green dashed lines correspond to the category boundary. Dashed black line indicates chance performance. Error bars indicate SEM.
Figure 3
Figure 3. Example LIP neurons during the DMS and DMC tasks
Average activity evoked by 8 sample directions for three LIP neurons from the DMS (a–c) and DMC (d–f) tasks. Different traces indicate different sample directions and are colored according to their direction (and category membership for the DMC task). The three dashed, vertical lines represent the start of the sample epoch, the end of the sample epoch, and the end of the delay epoch, respectively. Polar plots are shown for average firing rates by sample direction during sample (black) and delay (gray) periods. In (d–f) dark blue and dark red traces indicate sample directions near the middle of categories 1 and 2, respectively, while light blue and light red traces indicate sample directions near the category boundary. All cells shown were direction selective during the sample period (one-way ANOVA, P<0.01). All cells except for (a) were also direction selective during the delay period. The dashed green lines on the polar plots indicate the position of the category boundary.
Figure 4
Figure 4. Population-level direction and category classification in LIP
(a) Diagram depicting how motion direction was classified independently of category. As an example, only neural responses to motion directions from category 1 (yellow arrows) are used to train the classifier. This classifier is then used to test which of the four motion directions (same yellow arrows) neural responses from these trials belong to. A second classifier was constructed using the four directions from the other category, and performance between these classifiers was averaged. (b) Diagram depicting how motion category was classified independently of direction. As an example, neural responses to two directions from category 1 (blue arrows) and two directions from category 2 (red arrows) are used to train the classifier. The classifier is then used to test which category neural responses to the four test directions (yellow arrows) belong to. A second classifier was constructed by switching the training and testing directions shown, and performance between these classifiers was averaged. (c,d) Stimulus selectivity during task epochs. (c) Performance of the direction classifier during the DMS (pink) and DMC (green) tasks. Chance accuracy is 0.25. (d) Performance of the category classifier during the DMS and DMC tasks. Chance accuracy is 0.5. All epochs were 333 ms long. Error bars indicate SEM. *P<=0.05, **P<=0.01, ***P<=0.001, bootstrap.
Figure 5
Figure 5. Time-course of direction and category classification in LIP
(a,b) The time course of direction and category selectivity in LIP during the two tasks was determined by computing classification accuracy as a function of time relative to sample onset using the (a) sample direction classifier and (b) sample category classifier. The three dashed, vertical lines represent the start of the sample epoch, the end of the sample epoch, and the end of the delay epoch, respectively. Error bars indicate SEM. The light and dark colored bars at the top of the figure indicate times at which classification accuracy during the DMS (pink) or DMC (green) task was significantly above chance (light, P<0.05, dark, P<0.01, bootstrap). Sample direction classification accuracy was not significantly different between tasks at any point in the trial (P>0.05, bootstrap). (c) The stability of category encoding in LIP neurons was determined by training the classifier at one time point (y axis) and testing at a second time point (x axis). Classification accuracy is indicated by the color at each x–y coordinate. In the left panel, category classification accuracy during the DMS task remained at or near chance (0.5) for all training and testing time combinations. In the right panel, contiguous blocks of high category classification accuracy during the DMC task indicate temporally stable category decoding during the delay period—evident by the wide range of classifier training and testing times which yielded high category classification accuracy.
Figure 6
Figure 6. Example PPC and PFC neurons during the DMS task
Average activity evoked by 6 sample directions during the DMS task for a PPC neuron from monkey Q (a) and one PFC neuron from monkey W (b). Different traces indicate different sample directions and are colored according to their direction. The three dashed, vertical lines represent the start of the sample epoch, the end of the sample epoch, and the end of the delay epoch, respectively. Polar plots are shown for average firing rates by sample direction during sample (black) and delay (gray) periods. Dashed lines indicate SEM.
Figure 7
Figure 7. Time-course of direction classification in PPC and PFC
(a) Sample motion direction classification accuracy for Monkeys Q and W. Similar to Figure 5a, direction was decoded independent of category. The classification accuracy is shown for the PPC (blue curve) and the PFC (red curve). The three dashed, vertical lines represent the start of the sample epoch, the end of the sample epoch, and the end of the delay epoch, respectively. Error bars indicate SEM. The light and dark colored bars at the top of the panel indicate times at which classification accuracy for PPC (blue) and PFC (red) was significantly above chance (light, P<0.05, dark, P<0.01, bootstrap). (b) Similar to Figure 5c, the stability of direction encoding in PFC was determined by training the classifier at one time point (y axis) and testing at a second time point (x axis). Classification accuracy is indicated by color at each x–y coordinate. Direction classification accuracy in PFC was above chance during both the sample and delay epochs, with stronger values near the diagonal, suggesting a combination of stable and dynamic direction encoding.

Comment in

References

    1. Engel TA, Chaisangmongkon W, Freedman DJ, Wang X-J. Choice-correlated activity fluctuations underlie learning of neuronal category representation. Nat. Commun. 2015;6:6454. - PMC - PubMed
    1. Freedman DJ, Riesenhuber M, Poggio T, Miller EK. Categorical representation of visual stimuli in the primate prefrontal cortex. Science. 2001;291:312–316. - PubMed
    1. Freedman DJ, Assad JA. Experience-dependent representation of visual categories in parietal cortex. Nature. 2006;443:85–88. - PubMed
    1. Freedman DJ, Riesenhuber M, Poggio T, Miller EK. A comparison of primate prefrontal and inferior temporal cortices during visual categorization. J. Neurosci. 2003;23:5235–5246. - PMC - PubMed
    1. Goodwin SJ, Blackman RK, Sakellaridi S, Chafee MV. Executive control over cognition: stronger and earlier rule-based modulation of spatial category signals in prefrontal cortex relative to parietal cortex. J. Neurosci. 2012;32:3499–3515. - PMC - PubMed

Methods-only References

    1. Asaad WF, Santhanam N, McClellan S, Freedman DJ. High-performance execution of psychophysical tasks with complex visual stimuli in MATLAB. J. Neurophysiol. 2013;109:249–260. - PMC - PubMed
    1. Meyers EM, Qi X-L, Constantinidis C. Incorporation of new information into prefrontal cortical activity after learning working memory tasks. Proc. Natl. Acad. Sci. U. S. A. 2012;109:4651–4656. - PMC - PubMed
    1. Chang C, Lin C. LIBSVM: a library for support vector machines. ACM transactions on intelligent systems and technology. 2012;2:27, 1–27, 27.

Publication types

LinkOut - more resources