. 2016 Jan;19(1):75-83.
doi: 10.1038/nn.4170. Epub 2015 Nov 23.

Stimulus-specific combinatorial functionality of neuronal c-fos enhancers

Affiliations

Stimulus-specific combinatorial functionality of neuronal c-fos enhancers

Jae-Yeol Joo et al. Nat Neurosci. 2016 Jan.

Erratum in

Abstract

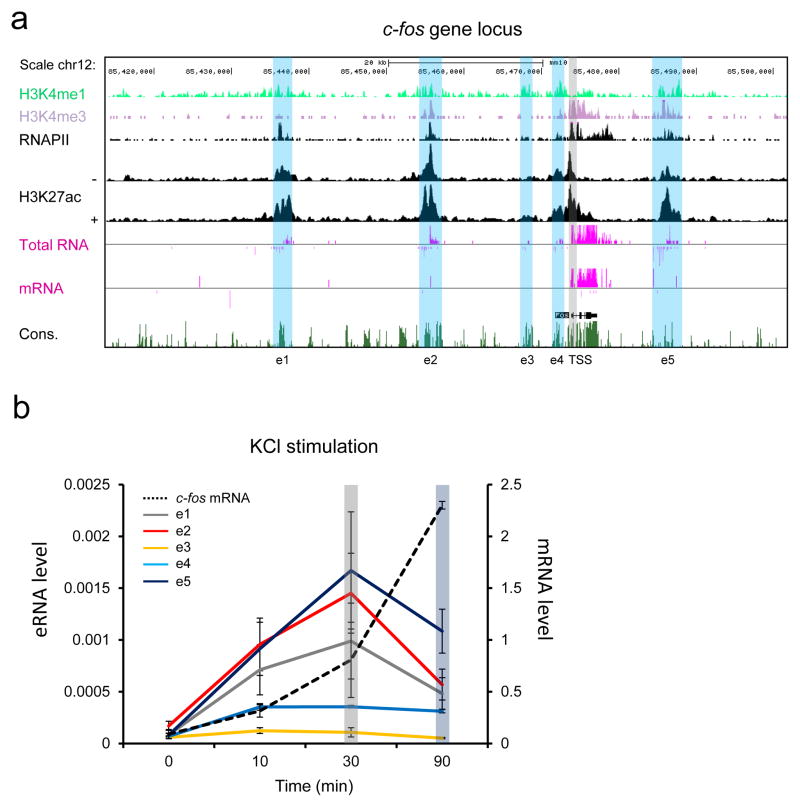
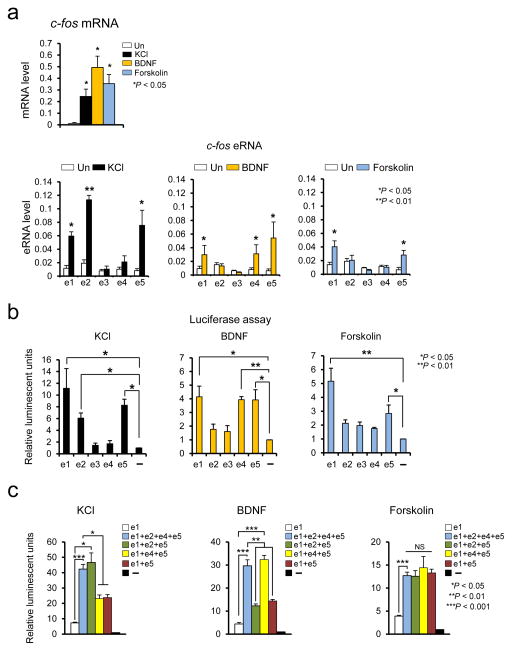
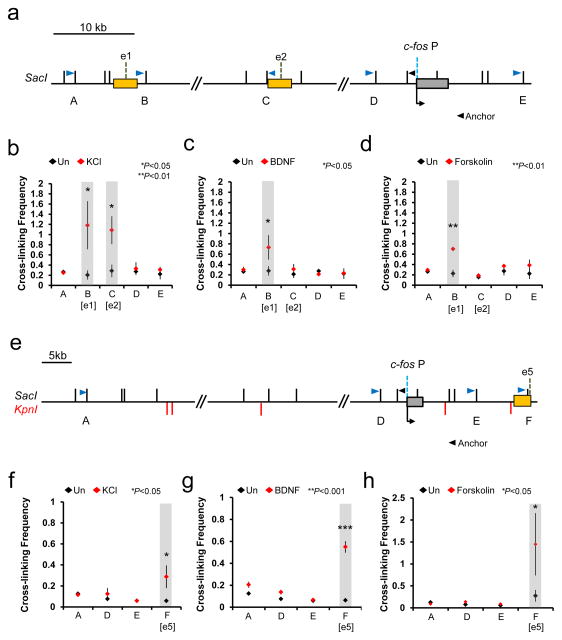
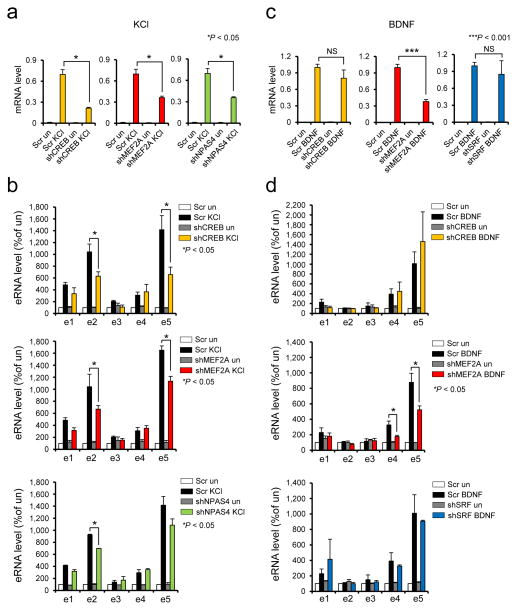
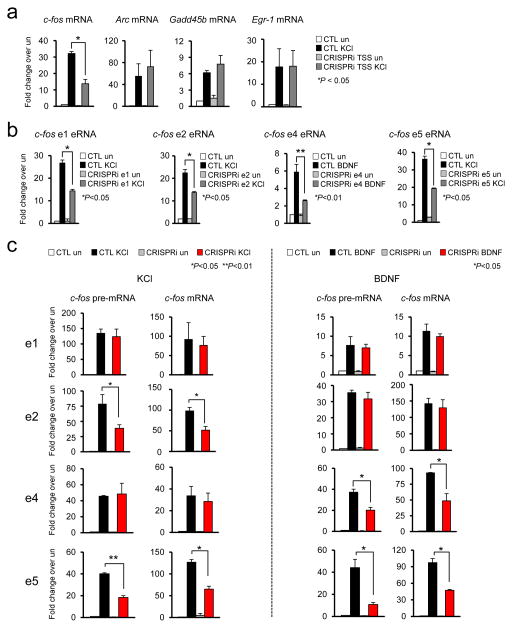
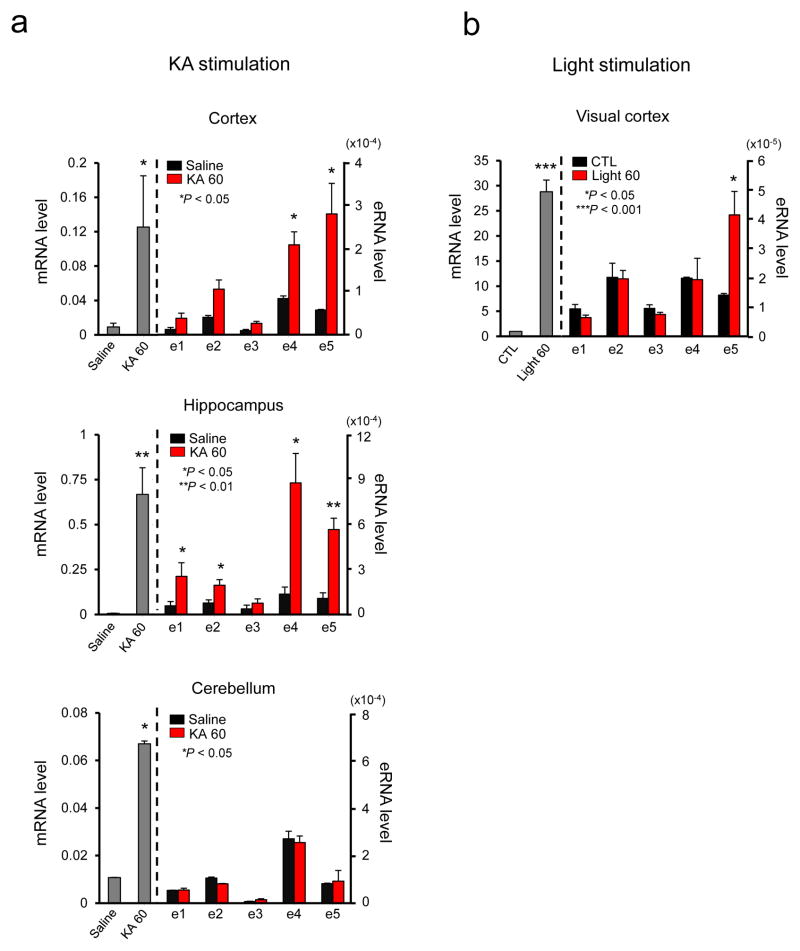
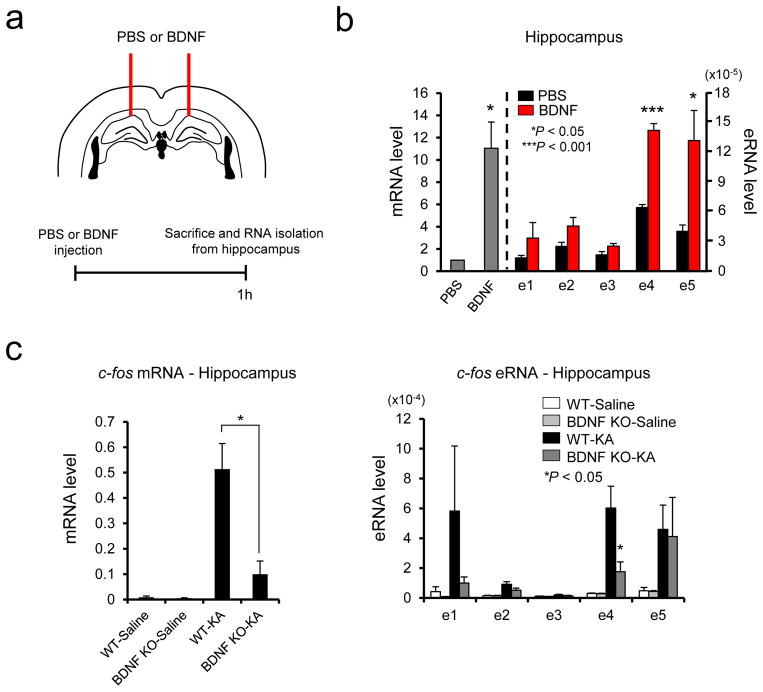
The c-fos gene (also known as Fos) is induced by a broad range of stimuli and is a reliable marker for neural activity. Its induction mechanism and available reporter mouse lines are based exclusively on c-fos promoter activity. Here we demonstrate that multiple enhancers surrounding the c-fos gene are crucial for ensuring robust c-fos response to various stimuli. Membrane depolarization, brain-derived neurotrophic factor (BDNF) and forskolin activate distinct subsets of the enhancers to induce c-fos transcription in neurons, suggesting that stimulus-specific combinatorial activation of multiple enhancers underlies the broad inducibility of the c-fos gene. Accordingly, the functional requirement of key transcription factors varies depending on the type of stimulation. Combinatorial enhancer activation also occurs in the brain. Providing a comprehensive picture of the c-fos induction mechanism beyond the minimal promoter, our study should help in understanding the physiological nature of c-fos induction in relation to neural activity and plasticity.


Conflict of interest statement

COMPETING FINANCIAL INTERESTS

The authors declare no competing financial interests.

Figures

Figure 1
Figure 1
Time course analysis of five c-fos eRNAs and mRNA. (a) A UCSC genome browser view of the c-fos genomic locus with RNA-seq and ChIP-Seq data (adapted from Kim et al. and Malik et al. ). + and − indicate the presence or absence of KCl. Blue and gray vertical bars indicate the locations of the c-fos enhancers and the promoter. (b) Expression levels of c-fos eRNA and mRNA in cortical neurons after KCl stimulation for various time points. Cortical neurons were depolarized with 55 mM KCl at DIV 6 and mRNA and eRNA levels were measured using RT-qPCR and normalized to Gapdh mRNA (n = 3 biological replicates). Error bars indicate SEM.
Figure 2
Figure 2
The c-fos enhancer activities measured by eRNA analysis and luciferase reporter assay. (a) Expression of c-fos mRNA and eRNA in cortical neurons induced by KCl 30 min, BDNF 1 h, and Forskolin 1 h. The induction levels of the five c-fos eRNAs and mRNA were measured using RT-qPCR and normalized to Gapdh mRNA (c-fos mRNA, KCl: P = 0.0418, t(2) = 4.736, n = 3, BDNF: P = 0.0333, t(2) = 5.339, n = 3, Forskolin: P = 0.0448, t(2) = 4.566, n = 3, unpaired t-test with Welch correction; c-fos eRNA, KCl, e1: P = 0.0418, t(4) = 6.654, F = 10.187 [SDP = 0.0894], n = 3, e2: P = 0.008, t(4) = 11.103, F = 3.149 [SDP = 0.3267], n = 3, e5: P = 0.0264, t(4) = 3.436, F = 26.341 [SDP = 0.0566], n = 3, unpaired t-test, BDNF, e1: P = 0.0329, t(4) = 3.200, F = 16.876 [SDP = 0.0599], n = 3, e4: P = 0.0271, t(4) = 3.408, F = 17.578 [SDP = 0.0538], n = 3, unpaired t-test, e5 P = 0.0214, t(2) = 6.723, n = 3, unpaired t-test with Welch correction, Forskolin, e1: P = 0.0498, t(4) = 2.718, F = 6.333 [SDP = 0.1364], n = 3, e5: P = 0.0485, t(4) = 2.805, F = 4.048 [SDP = 0.1981], n = 3 biological replicates, unpaired t-test). (b,c) Combinational c-fos enhancer activities measured by the luciferase reporter assay. Each of the c-fos enhancers was fused directly upstream of the c-fos promoter, which then together drives luciferase expression. Stimulus-induced luciferase activities were measured after 6 h of KCl, BDNF, or Forskolin treatment in cortical neurons. (b, KCl, e1: P = 0.0242. t(3) = 6.306, n = 4, e2: P = 0.0103. t(3) = 5.784, n = 4, e5: P = 0.0191. t(2) = 7.140, n = 3, BDNF, e1: P = 0.0350. t(2) = 5.207, n = 3, e4: P = 0.0056. t(2) = 13.349, n = 3, e5: P = 0.0391. t(2) = 4.907, n = 3, Forskolin, e1 P = 0.0087. t(2) = 10.633, n = 3, e5: P = 0.0438. t(2) = 4.618, n = 3 biological replicates, unpaired t-test with Welch correction; c, KCl, e1+e2+e4+e5: P = 0.0001, t(5) = 12.256, n = 6, e1+e2+e5: P = 0.0246, t(2) = 6.259, n = 2, e1+e4+e5: P = 0.0240, t(2) = 6.576, n = 2, e1+e5: P = 0.0128, t(2) = 8.764, n = 2 biological replicates, unpaired t-test with Welch correction, BDNF, e1+e2+e4+e5: P = 0.0007, t(7) = 5.818, n = 6, unpaired t-test with Welch correction, e1+e2+e5: P = 0.0034, t(3) = 8.537, F = 1.411 [SDP = 0.3569], n = 3, e1+e4+e5: P = 0.0004, t(3) = 18.125, F = 6.346 [SDP = 0.1280], n = 3, e1+e5: P = 0.00303, t(3) = 2.822, F = 63.970 [SDP = 0.0946], n = 3, biological replicates, unpaired t-test, Forskolin, e1+e2+e4+e5: P = 0.0001, t(5) = 12.601, n = 6, unpaired t-test with Welch correction, e1+e2+e5: P = 0.0189, t(2) = 7.164, F = 126.28 [SDP = 0.0565], n = 3 biological replicates, unpaired t-test). Error bars indicate SEM; p values are from a two-tailed t test. NS, not significant. SDP is the P value from comparing the standard deviations for both groups. SDP > 0.05 means the two SDs are not significantly different and can be used for an unpaired t-test.
Figure 3
Figure 3
Stimulus-dependent interactions between the c-fos enhancers and the promoter. (a,e) Schematic diagram of the loci analyzed by 3C. (b–d) 3C analysis for enhancer 1, 2 and the promoter before (black rhombus) and after (red rhombus) stimulation by KCl, BDNF, and Forskolin. (f–h) 3C analysis for enhancer 5 and the promoter before (black rhombus) and after (red rhombus) stimulation by KCl, BDNF, and Forskolin. Chromosomal interaction between the c-fos promoter and several genomic loci including the c-fos enhancers were measured by RT-qPCR using the primers indicated on the schematic diagram (blue and black arrowheads). The c-fos P represents the promoter, and e1, e2, and e5 represent enhancers 1, 2, and 5, respectively. The SacI and KpnI restriction enzyme sites (black and red vertical lines, respectively) are also shown (KCl stimulation, B [e1]: P = 0.0452, t(2) = 4.545, n = 3, unpaired t-test with Welch correction, C [e2]: P = 0.0109, t(4) = 4.492, F = 5.459 [SDP = 0.1548], n = 5, unpaired t-test, F [e5]: P = 0.0492, t(2) = 3.554, n = 3, unpaired t-test with Welch correction; BDNF stimulation, B [e1]: P = 0.0482, t(2) = 4.389, n = 3, unpaired t-test with Welch correction, F [e5]: P = 0.0001, t(4) = 14.393, F = 2.872 [SDP = 0.2583], n = 3, unpaired t-test; Forskolin stimulation, B [e1]: P = 0.0016, t(2) = 7.132, F = 49.091 [SDP = 0.0903], n = 3, F [e5]: P = 0.0489, t(2) = 3.481, F = 8.843 [SDP = 0.2065], n = 3 biological replicates, unpaired t-test, BDNF and Forskolin stimulation C [e2]: n = 5, KCl, BDNF, and Forskolin stimulation A, D, and E: n = 3 biological replicates). Note that e2 interactions were measured with templates that have been cut with either single enzyme (SacI) or double enzymes (SacI and KpnI). Error bars indicate SEM; p values are from a two-tailed t test. SDP is the P value from comparing the standard deviations for both groups. SDP > 0.05 means the two SDs are not significantly different and can be used for an unpaired t-test.
Figure 4
Figure 4
Function of CREB, MEF2A, NPAS4, and SRF transcription factors in KCl or BDNF-mediated induction of c-fos mRNA and eRNAs. (a,c) Effect of transcription factor knockdown in KCl or BNDF-mediated c-fos mRNA induction. Following knockdown of each transcription factor, cortical neurons were depolarized with KCl or stimulated with BDNF, and c-fos mRNA was measured. (b,d) Effect of transcription factor knockdown in KCl or BDNF-mediated c-fos eRNA induction (c-fos mRNA, KCl stimulation: shCREB P = 0.0222, t(2) = 6.600, F = 27.833 [SDP = 0.1192], n = 3; shMEF2A, P = 0.0417, t(2) = 4.741, F = 11.189 [SDP = 0.1849], n = 3; shNPAS4, P = 0.0455, t(2) = 4.524, F = 28.538 [SDP = 0.1178], n = 3; c-fos eRNA, KCl stimulation: e2, P = 0.0382, t(4) = 3.046, F = 1.078 [SDP = 0.4813], n = 3, e5, P = 0.0478, t(4) = 2.820, F = 3.517 [SDP = 0.2214], n = 3 for shCREB; e2, P = 0.0339, t(4) = 3.169, F = 2.995 [SDP = 0.2503], n = 3, e5, P = 0.0101, t(4) = 5.812, F = 2.441 [SDP = 0.2586], n = 3 for shMEF2A; e2, P = 0.0164, t(2) = 7.714, F = 9.324 [SDP = 0.2015], n = 2 for shNPAS4; c-fos mRNA, BDNF stimulation: shMEF2A, P = 0.0001, t(4) = 8.656, F = 2.157 [SDP = 0.3168], n = 3; c-fos eRNA, BDNF stimulation: e4, P = 0.0439, t(3) = 2.906, F = 8.631 [SDP = 0.1038], n = 3, e5, P = 0.0485, t(4) = 2.807, F = 5.381 [SDP = 0.1567], n = 3 for shMEF2A). All unpaired t-test. Error bars indicate SEM; p values are from a two-tailed t test. NS, not significant. SDP is the P value from comparing the standard deviations for both groups. SDP > 0.05 means the two SDs are not significantly different and can be used for an unpaired t-test.
Figure 5
Figure 5
Specific requirement of e2 and e4 enhancer in KCl or BDNF-mediated c-fos transcription. (a) Effect of c-fos promoter-targeted CRISPRi (dCas9-KRAB) (P = 0.0189, t(2) = 12.637, F = 4.830 [SDP = 0.2718], n = 3 biological replicates). (b) Effect of e1, e2, e4, and e5 enhancer-targeted CRISPRi on their respective eRNAs (c-fos e1 eRNA, P = 0.0151, t(2) = 8.037, F = 4.147 [SDP = 0.2906], n = 2; c-fos e2 eRNA, P = 0.0393, t(4) = 3.015, F = 3.461 [SDP = 0.2242], n = 3; c-fos e4 eRNA, P = 0.0206, t(2) = 6.864, F = 25.000 [SDP = 0.1257], n = 2; c-fos e5 eRNA, P = 0.0104, t(2) = 9.711, F = 32.398 [SDP = 0.1107], n = 2 biological replicates). (c) Effect of c-fos e1, e2, e4, and e5 enhancer-targeted CRISPRi. Following the suppression of e1, e2, e4, and e5 enhancer by CRISPRi, cortical neurons were stimulated by KCl or BDNF, and expression levels of c-fos pre-mRNA and mRNA were measured using RT-qPCR (KCl stimulation: e2 c-fos pre-mRNA, P = 0.0433, t(4) = 2.918, F = 1.388 [SDP = 0.4187], n = 3; c-fos mRNA, P = 0.0102, t(8) = 3.340, F = 1.114 [SDP = 0.459], n = 5; e5 c-fos pre-mRNA P = 0.0077, t(2) = 11.350, F = 3.550 [SDP = 0.3106], n = 2, c-fos mRNA, P = 0.0207, t(2) = 6.845, F = 1.122 [SDP = 0.4817], n = 2; BDNF stimulation: e4 c-fos pre-mRNA, P = 0.0485, t(2) = 4.373, F = 1.807 [SDP = 0.4868], n = 2, c-fos mRNA, P = 0.0322, t(2) = 5.440, F = 137.97 [SDP = 0.0541], n = 2; e5 c-fos pre-mRNA, P = 0.0489, t(2) = 4.353, F = 17.288 [SDP = 0.1503], n = 2, c-fos mRNA, P = 0.0223, t(2) = 6.582, F = 26.669 [SDP = 0.1218], n = 2 biological replicates). All unpaired t-test. Error bars indicate SEM; p values are from a two-tailed t test. SDP is the P value from comparing the standard deviations for both groups. SDP > 0.05 means the two SDs are not significantly different and can be used for an unpaired t-test.
Figure 6
Figure 6
Characterization of c-fos enhancer activities in vivo. (a) c-fos mRNA expression in the cortex, hippocampus, and cerebellum following KA-evoked seizure. c-fos mRNA was measured using RT-qPCR 1 h after saline or KA administration (note that the y axes are scaled differently). c-fos eRNA induction in the cortex, hippocampus, and cerebellum following KA-evoked seizure (c-fos mRNA, Cortex: P = 0.0458, t(4) = 4.511, n = 5 mice, Hippocampus: P = 0.0067, t(5) = 4.455, n = 5 mice, Cerebellum: P = 0.0133, t(4) = 47.767, n = 5 mice; Cortex, c-fos e4, P = 0.0150, t(4) = 4.084, n = 5 mice, c-fos e5, P = 0.034, t(4) = 3.154, n = 5 mice; Hippocampus, c-fos e1, P = 0.0386, t(4) = 3.036, n = 5 mice, c-fos e2, P = 0.0419, t(5) = 2.717, n = 5 mice, c-fos e4, P = 0.0211, t(4) = 3.686, n = 5 mice, c-fos e5, P = 0.0028, t(5) = 5.454, n = 5 mice). (b) Expression of c-fos mRNA in the visual cortex of mice treated with light stimulation. c-fos eRNA induction in the visual cortex of mice following light stimulation. The levels of mRNA and eRNA were normalized to the level of Gapdh mRNA (c-fos mRNA, Visual cortex: P = 0.0069, t(2) = 11.966, n = 3 mice; c-fos e5, P = 0.0485, t(4) = 2.806, n = 3 mice). All unpaired t-test with Welch correction. Error bars indicate SEM; p values are from a two-tailed t test.
Figure 7
Figure 7
Stimulus-specific combinatorial action of c-fos enhancers in vivo. (a) Schematic diagram of BDNF stereotaxic injection procedure. (b) c-fos mRNA and eRNA induction in the hippocampus following BDNF injection. c-fos mRNA and eRNA were measured using RT-qPCR 1 h after PBS or BDNF injection (c-fos mRNA, Hippocampus: P = 0.0236, t(3) = 4.267, n = 4 mice, unpaired t-test with Welch correction; c-fos e4, P = 0.0001, t(6) = 10.373, F = 5.082 [SDP = 0.1074], n = 4 mice, unpaired t-test, c-fos e5, P = 0.0402, t(3) = 3.475, n = 4 mice, unpaired t-test with Welch correction). (c) c-fos mRNA and eRNA induction in the hippocampus following KA-evoked seizure from wild-type and BDNF-KO mice. c-fos mRNA and eRNA were measured using RT-qPCR 1 h after saline or KA administration (c-fos mRNA, Hippocampus: P = 0.0216, t(4) = 3.660, F = 3.756 [SDP = 0.2103], n = 3 mice; c-fos e4, P = 0.0476, t(4) = 2.825, F = 10.113 [SDP = 0.0900], n = 3 mice, all unpaired t-test). The levels of mRNA and eRNA were normalized to the level of Gapdh mRNA. Error bars indicate SEM; p values are from a two-tailed t test. SDP is the P value from comparing the standard deviations for both groups. SDP > 0.05 means the two SDs are not significantly different and can be used for an unpaired t-test.

References

    1. Lyons MR, West AE. Mechanisms of specificity in neuronal activity-regulated gene transcription. Prog Neurobiol. 2011;94:259–295. - PMC - PubMed
    1. Frey U, Frey S, Schollmeier F, Krug M. Influence of actinomycin D, a RNA synthesis inhibitor, on long-term potentiation in rat hippocampal neurons in vivo and in vitro. J Physiol. 1996;490(Pt 3):703–711. - PMC - PubMed
    1. Sheng M, Greenberg ME. The regulation and function of c-fos and other immediate early genes in the nervous system. Neuron. 1990;4:477–485. - PubMed
    1. Bartel DP, Sheng M, Lau LF, Greenberg ME. Growth factors and membrane depolarization activate distinct programs of early response gene expression: dissociation of fos and jun induction. Genes Dev. 1989;3:304–313. - PubMed
    1. Heinz S, Romanoski CE, Benner C, Glass CK. The selection and function of cell type-specific enhancers. Nat Rev Mol Cell Biol. 2015;16:144–154. - PMC - PubMed

Publication types

Substances