. 2016 Jan;126(1):112-22.
doi: 10.1172/JCI84669. Epub 2015 Nov 23.

Aberrant sodium influx causes cardiomyopathy and atrial fibrillation in mice

Aberrant sodium influx causes cardiomyopathy and atrial fibrillation in mice

Elaine Wan et al. J Clin Invest. 2016 Jan.

Abstract

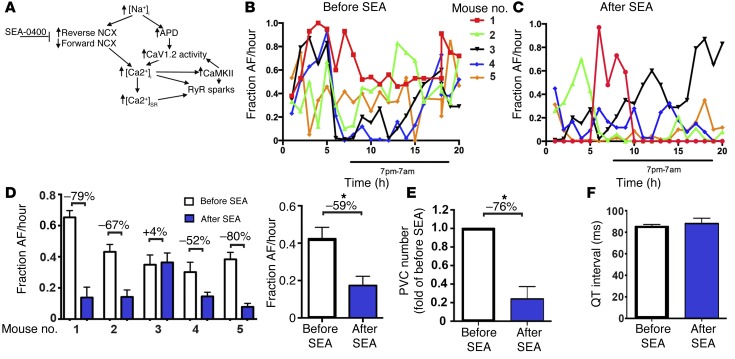
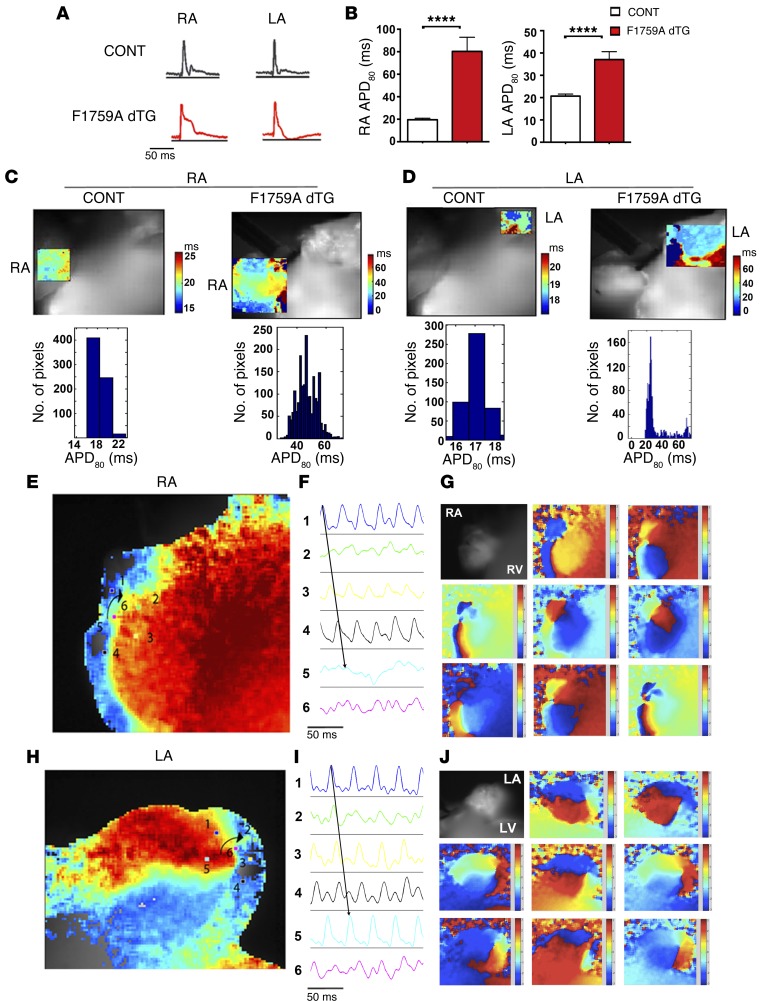
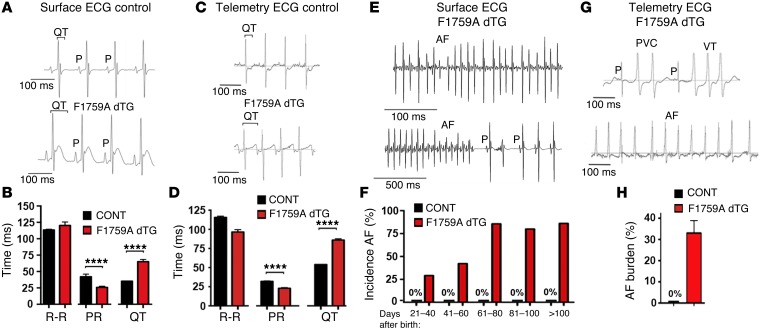
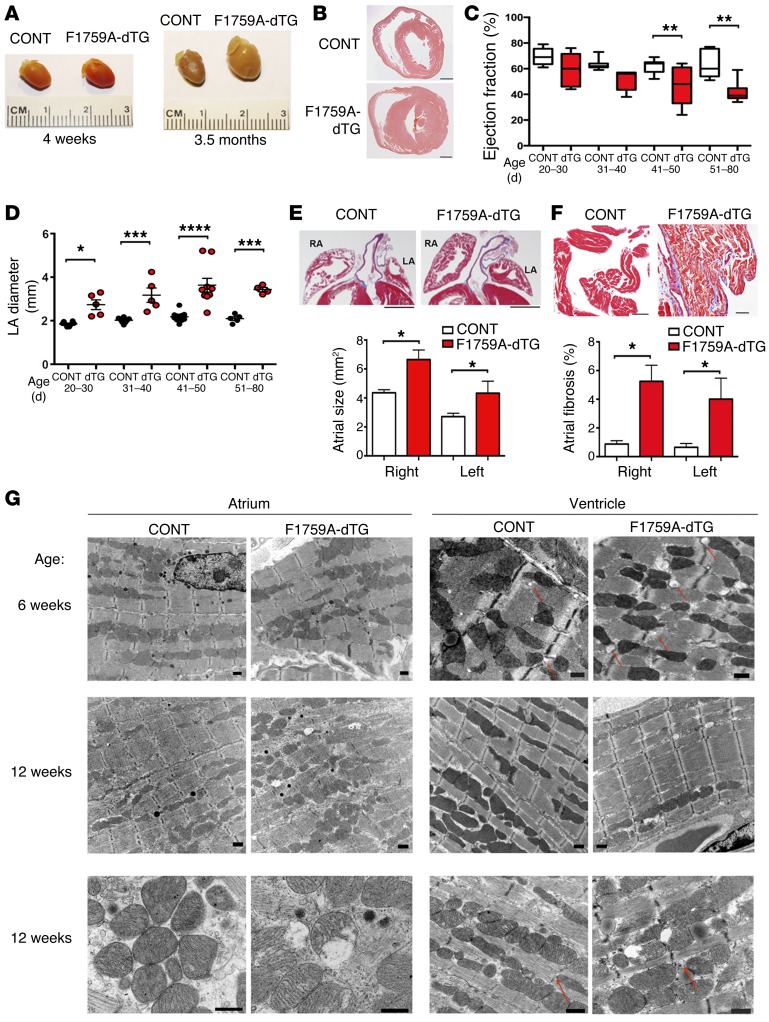
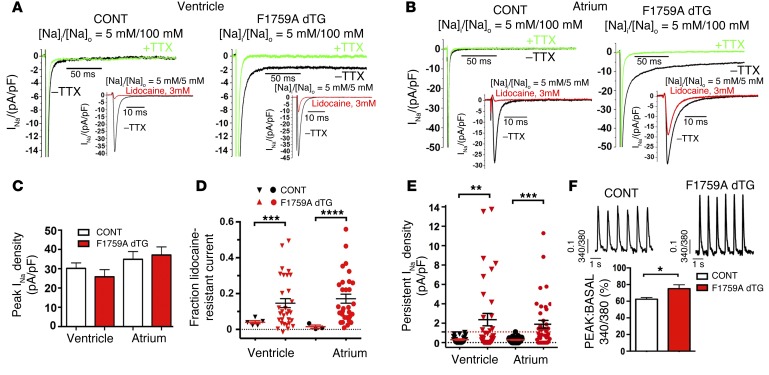
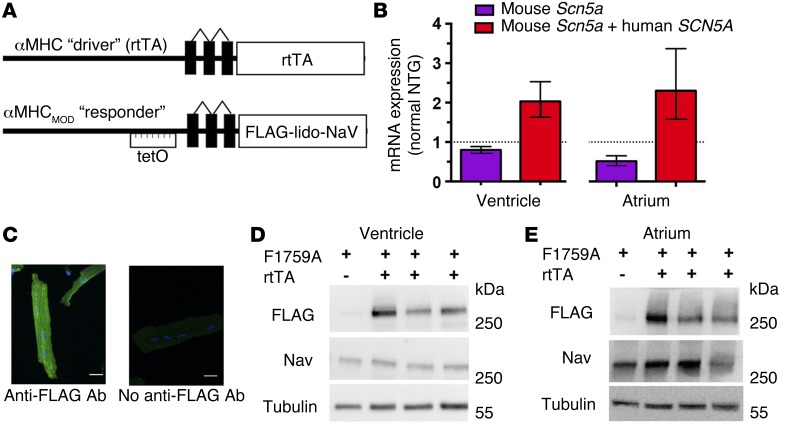
Increased sodium influx via incomplete inactivation of the major cardiac sodium channel Na(V)1.5 is correlated with an increased incidence of atrial fibrillation (AF) in humans. Here, we sought to determine whether increased sodium entry is sufficient to cause the structural and electrophysiological perturbations that are required to initiate and sustain AF. We used mice expressing a human Na(V)1.5 variant with a mutation in the anesthetic-binding site (F1759A-Na(V)1.5) and demonstrated that incomplete Na+ channel inactivation is sufficient to drive structural alterations, including atrial and ventricular enlargement, myofibril disarray, fibrosis and mitochondrial injury, and electrophysiological dysfunctions that together lead to spontaneous and prolonged episodes of AF in these mice. Using this model, we determined that the increase in a persistent sodium current causes heterogeneously prolonged action potential duration and rotors, as well as wave and wavelets in the atria, and thereby mimics mechanistic theories that have been proposed for AF in humans. Acute inhibition of the sodium-calcium exchanger, which targets the downstream effects of enhanced sodium entry, markedly reduced the burden of AF and ventricular arrhythmias in this model, suggesting a potential therapeutic approach for AF. Together, our results indicate that these mice will be important for assessing the cellular mechanisms and potential effectiveness of antiarrhythmic therapies.


Figures

Figure 6
Figure 6. Inhibition of NCX attenuates atrial and ventricular arrhythmogenesis in F1759A-dTG mice.
(A) Schematic depicting proposed mechanisms of arrhythmogenesis in F1759A-dTG mice. (B) Diary plot of fraction of AF/hour during a 20-hour period for 5 male F1759A-dTG mice. Burden of AF was determined by manually reviewing the entire 20-hour period. (C) Diary plot of fraction of AF/hour for same 5 male F1759A-dTG mice during a 20-hour period after i.p. injection of SEA-0400. (D) Graph (left) summarizing fraction of AF during 20-hour period before (white bars) and after (blue bars) single i.p. injection of SEA-0400 for each mouse. Percent change is shown above each data pair. Graph (right) showing fraction AF/hour before and after SEA injection for the 5 F1759A-dTG mice. Data are presented as mean ± SEM. *P < 0.05; t test. (E) Quantification of number of PVC normalized to pre-SEA. Data are presented as mean ± SEM. *P < 0.05; t test. (F) Bar graph showing QT interval before and after SEA-0400.
Figure 5
Figure 5. Optically recorded atrial APs and voltage maps of AF.
(A and B) Optically recorded APs from right atrium (RA) and left atrium (LA) of control and F1759A-dTG mice in sinus rhythm (A). Bar graphs showing right and left atrial APD80 of control mice (n = 10 mice) and F1759A-dTG mice (n = 3 mice) (B). Data are presented as mean ± SEM. **** P < 0.0001; t test. The mean atrial rate in sinus rhythm: NTG mice, 338 + 9.5 beats per minute; F1759A-dTG mice, 314 + 9.8 beats per minute. (C and D) Representative APD regional maps and all point histograms of control (CONT) and F1759A-dTG mice showing increased APD80 dispersion in the RA and LA of F1759A-dTG mice. Color legend of APD80 (ms) is shown to the right of each optical map. (EJ) Optical voltage map of AF in Langendorff-perfused F1759A-dTG explanted heart. (E and H) Phase maps of concurrent but independent rotors in the RA and LA. (F and I) Optical APs (electrograms 1–5) around the rotor demonstrate progressive circular reentry around the phase singularity (electrogram 6). (G and J) Progressive phase map of the RA (G) and LA (J) every 10 ms of the phase movie. Red, depolarization; blue, repolarization.
Figure 4
Figure 4. Prolonged QT interval and spontaneous AF in F1759A-dTG mice.
(A) Representative limb-lead surface electrocardiograms of isoflurane-anesthetized littermate control and F1759A-dTG mice. The QT interval is marked by brackets. (B) Bar graph of R-R, PR, and QT intervals from isoflurane-anesthetized littermate control mouse and F1759A-dTG mouse. Data are presented as mean ± SEM. ****P < 0.0001; t test. (C) Representative telemetry recordings of nonanesthetized littermate control and F1759A-dTG mice. (D) Graph comparing R-R, PR, and QT intervals of nonanesthetized littermate control and F1759A-dTG mice from telemetric ECG recordings. ****P < 0.0001; t test. (E) Representative surface electrograms of isoflurane-anesthetized F1759A-dTG mice showing AF. In the lower trace, paroxysmal AF was recorded, with P waves at the right side of the recording. (F) Bar graph showing incidence of AF at range of days after birth. Surface electrograms of isoflurane-anesthetized mice were recorded for 3 minutes. AF was considered present if the duration of AF persisted for >10 ventricular complexes. CONT (single TG + NTG): n = 27, 2–40 days; n = 8, 41–60 days; n = 5, 61–80 days. F1759A-dTG: n = 26, 21–40 days; n = 23, 41–60 days; n = 17, 61–80 days; n = 18, 81–100; n = 9, >100 days. Each age group consisted of a distinct set of mice. (G) Representative telemetry recordings of nonanesthetized F1759A-dTG mice showing VT (upper tracing) and AF (lower tracing). (H) Graph showing percent of AF during 20-hour recording in control and F1759A-dTG mice. n = 3 mice, CONT; n = 8, F1759A-dTG (5 were male and 3 were female).
Figure 3
Figure 3. Increased persistent Na+ current is sufficient to initiate structural changes in the atria and ventricles.
(A) Photographs of littermate control (CONT) and F1759A-dTG hearts at 4 weeks and 3.5 months after birth. (B) H&E-stained cross section of ventricle. Scale bars: 1 mm. (C and D) Graphs of ejection fraction and LAD (in mm) of littermate control and F1759A-dTG mice, assessed by echocardiography at ages shown. Data are presented as mean ± SEM. n ≥ 5 mice per age group per genotype. *P < 0.05, **P < 0.01, ***P < 0.001, ***P < 0.0001. (E) H&E stain of right and left atria showing bi-atrial enlargement in F1759A-dTG mice. Scale bars: 1 mm. Bar graph of left atrial and right atrial area of littermate control and F1759A-dTG mice at 3–4 months of age. Data are presented as mean ± SEM. *P < 0.05; t test. n = 5 for each group. (F) Masson’s trichrome stain of atria of littermate control and F1759A-dTG mice. Scale bars: 50 μm. Bar graph quantifying atrial fibrosis. Data are presented as mean ± SEM. *P < 0.05; t test. n ≥ 5 for each group. (G) Representative 2-dimensional TEM images (n = 2 for dTG and littermate control) showing left to right, gross morphology of atrial and ventricular samples at 6 weeks (first row) and 12 weeks (second and third rows) in littermate control mice compared with dTG mice. At 6 weeks, dTG mice show signs of myofibril disarray with loss of congruous parallel myofibrils in the atrium. By 12 weeks of age, atrial and ventricular cardiomyocytes from the F1759A-dTG mice demonstrated mitochondrial injury, with circular and swollen mitochondria and ruptured outer membranes. In the ventricle, the red arrows point to T-tubule cross sections, which are larger in the dTG mice compared with littermate control. Scale bars: 500 nm.
Figure 2
Figure 2. F1759A-NaV1.5 increases persistent Na+ current in atria and ventricles.
(A and B) Exemplar whole cell Na+ current (INa) traces of ventricular (A) and atrial (B) cardiomyocytes isolated from control (CONT, single TG and NTG) and F1759A-dTG mice. Persistent INa was evaluated with a 190-ms depolarization from a holding potential of –110 to –30 mV in the absence (black) and presence (green) of 20 μM TTX; 5 mM Na+ was used in the intracellular solution, and 100 mM Na+ was used in the extracellular solution. Insets: For the assessment of peak INa and the fraction of lidocaine-resistant current, whole cell current traces were recorded with 5 mM Na+ in both extracellular and intracellular solutions, in the absence (black) and presence (red) of 3 mM lidocaine. (C) Bar graph of peak INa density recorded with 5 mM external Na+. Data are presented as mean ± SEM. (D) Graph of fraction of peak INa resistant to 3 mM lidocaine. ***P < 0.001, ****P < 0.0001; t test. (E) Graph of persistent INa. Red dashed line is maximal persistent INa in cardiomyocytes isolated from CONT mice. Data are presented as mean ± SEM. **P < 0.01, ***P < 0.001; t test. (F) Representative traces of Ca2+ transients. Bar graph of Ca2+ transients of littermate control (CONT) and F1759A-dTG mice. Data are presented as mean ± SEM. *P < 0.05; t test. n = 34, single TG and NTG ventricular cardiomyocytes; n = 107, F1759A-dTG cardiomyocytes.
Figure 1
Figure 1. Cardiac-specific, FLAG-tagged F1759A-NaV1.5–expressing TG mice.
(A) Schematic of the binary transgene system. αMHC-rtTA is the standard cardiac-specific, reverse tetracycline–controlled transactivator system. The αMHCMOD construct is a modified αMHC promoter containing the tet-operon (tet-O) for regulated expression of FLAG-tagged, lidocaine-resistant NaV1.5 (FLAG-lido-NaV). (B) Quantification of mouse Scn5a and human SCN5A transcripts in ventricle and atrium of F1759A-dTG mice using qPCR. Results are presented as fold difference for each gene against actin by use of 2–ΔΔCT method, followed by normalization to expression of either mouse Scn5a or mouse Scn5a and human SCN5A determined in NTG mice. n = 3 NTG and n = 4 F1759A-dTG mice in each group. (C) Immunostaining of F1759A-dTG mice cardiomyocytes with or without anti-FLAG antibody and FITC-conjugated secondary antibody. Images were obtained with confocal at ×40 magnification. (D and E) Anti-FLAG, anti-NaV1.5, and anti-tubulin antibody immunoblots of cardiac homogenates showing FLAG epitope–tagged NaV1.5 expression in ventricle (D) and atrium (E) of single TG and dTG mice in the absence of doxycycline-impregnated food.

Similar articles

Cited by

References

    1. Heijman J, Voigt N, Nattel S, Dobrev D. Cellular and molecular electrophysiology of atrial fibrillation initiation, maintenance, and progression. Circ Res. 2014;114(9):1483–1499. doi: 10.1161/CIRCRESAHA.114.302226. - DOI - PubMed
    1. Vaziri SM, Larson MG, Benjamin EJ, Levy D. Echocardiographic predictors of nonrheumatic atrial fibrillation. The Framingham Heart Study. Circulation. 1994;89(2):724–730. doi: 10.1161/01.CIR.89.2.724. - DOI - PubMed
    1. Wakili R, Voigt N, Kaab S, Dobrev D, Nattel S. Recent advances in the molecular pathophysiology of atrial fibrillation. J Clin Invest. 2011;121(8):2955–2968. doi: 10.1172/JCI46315. - DOI - PMC - PubMed
    1. Gudbjartsson DF, et al. A sequence variant in ZFHX3 on 16q22 associates with atrial fibrillation and ischemic stroke. Nat Genet. 2009;41(8):876–878. doi: 10.1038/ng.417. - DOI - PMC - PubMed
    1. Ellinor PT, et al. Meta-analysis identifies six new susceptibility loci for atrial fibrillation. Nat Genet. 2012;44(6):670–675. doi: 10.1038/ng.2261. - DOI - PMC - PubMed

Publication types