. 2016 Jan;17(1):65-75.
doi: 10.1038/ni.3308. Epub 2015 Nov 23.

Type I interferon restricts type 2 immunopathology through the regulation of group 2 innate lymphoid cells

Affiliations

Type I interferon restricts type 2 immunopathology through the regulation of group 2 innate lymphoid cells

Claudia U Duerr et al. Nat Immunol. 2016 Jan.

Abstract

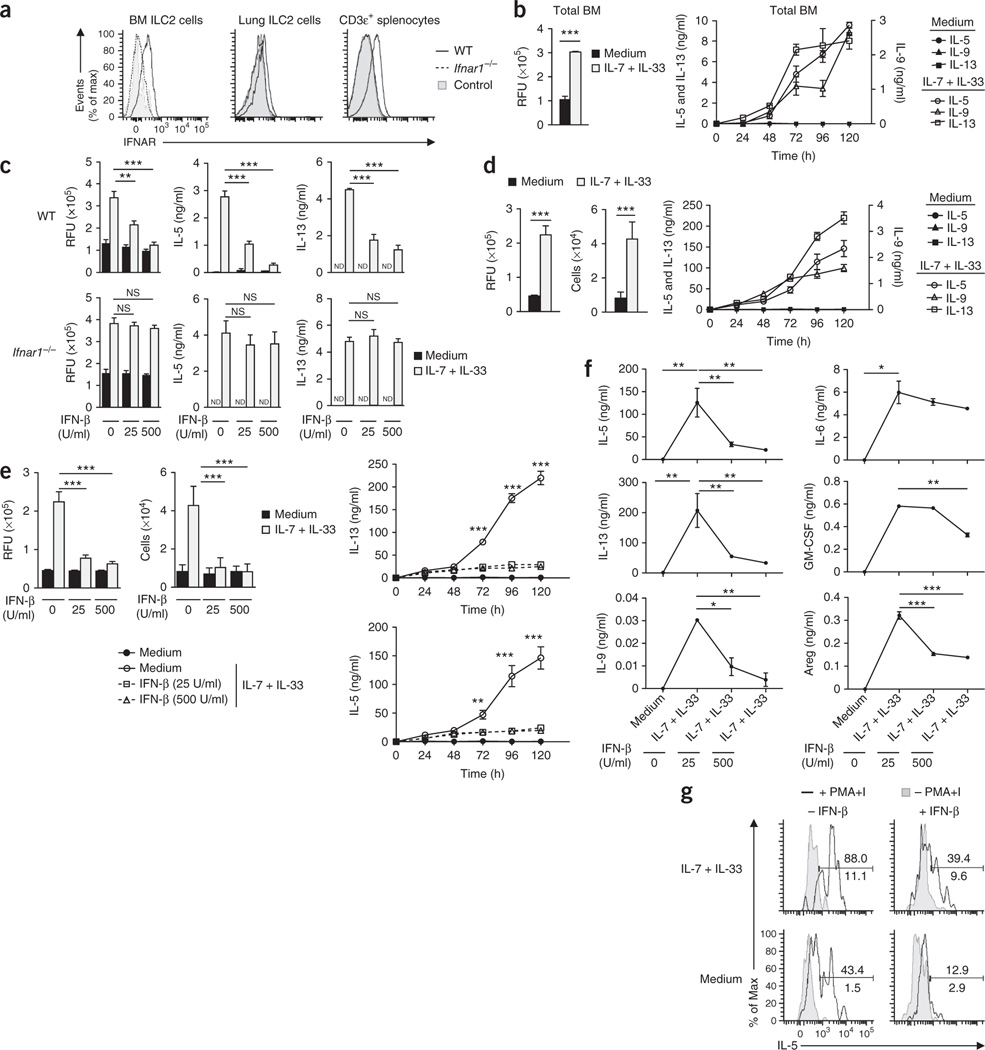
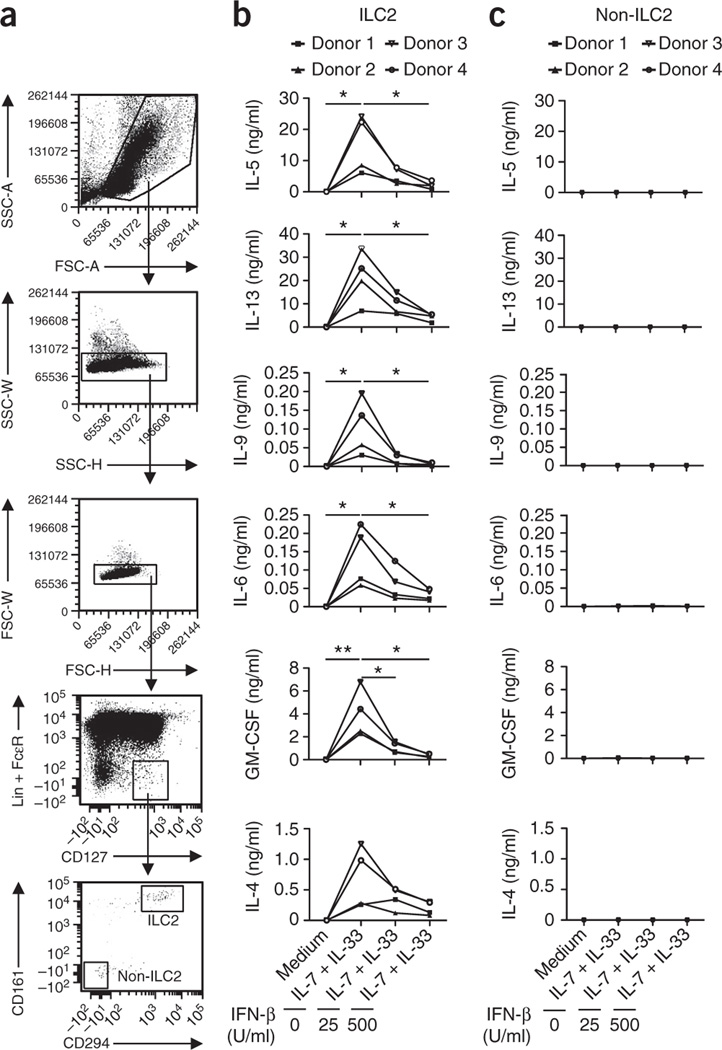
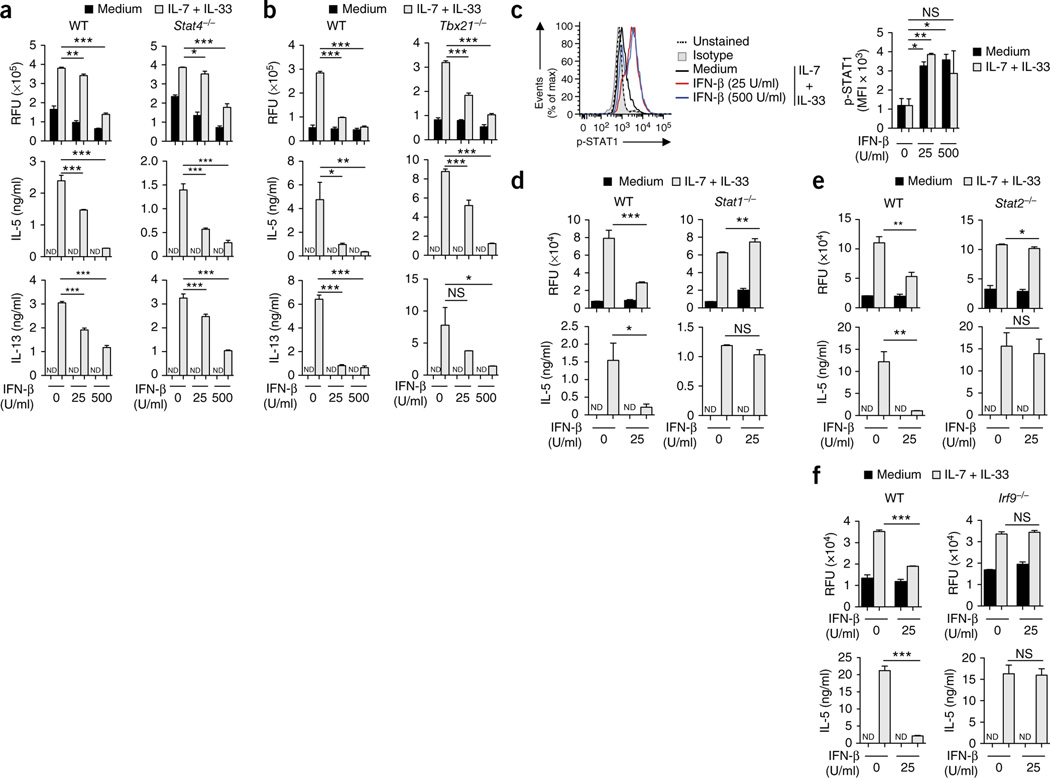
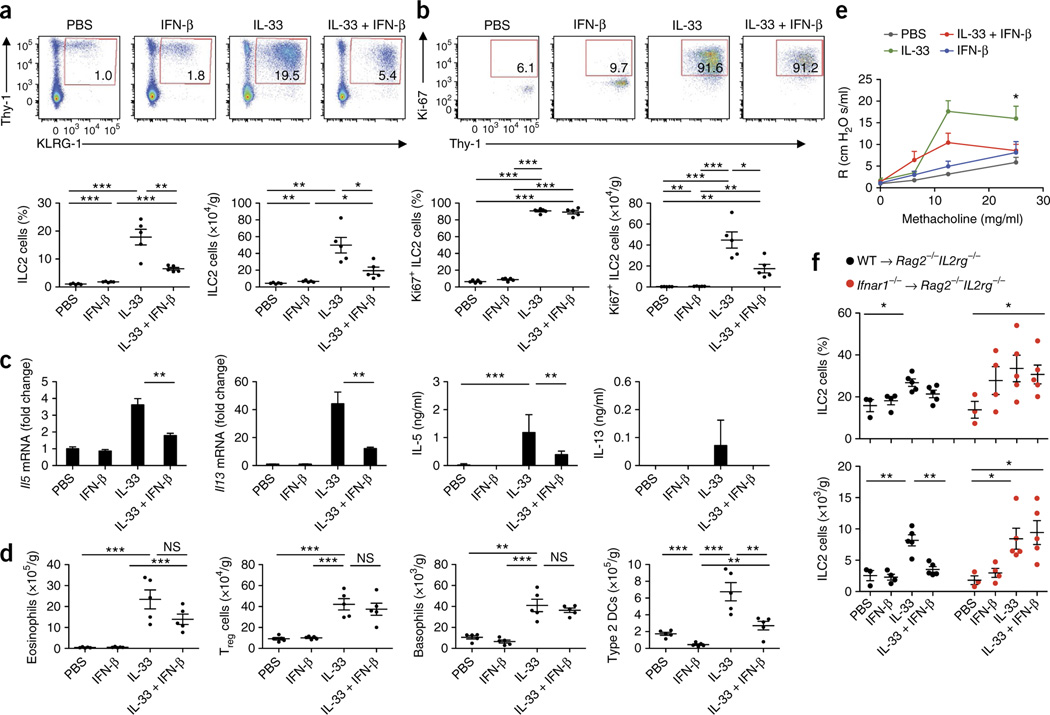
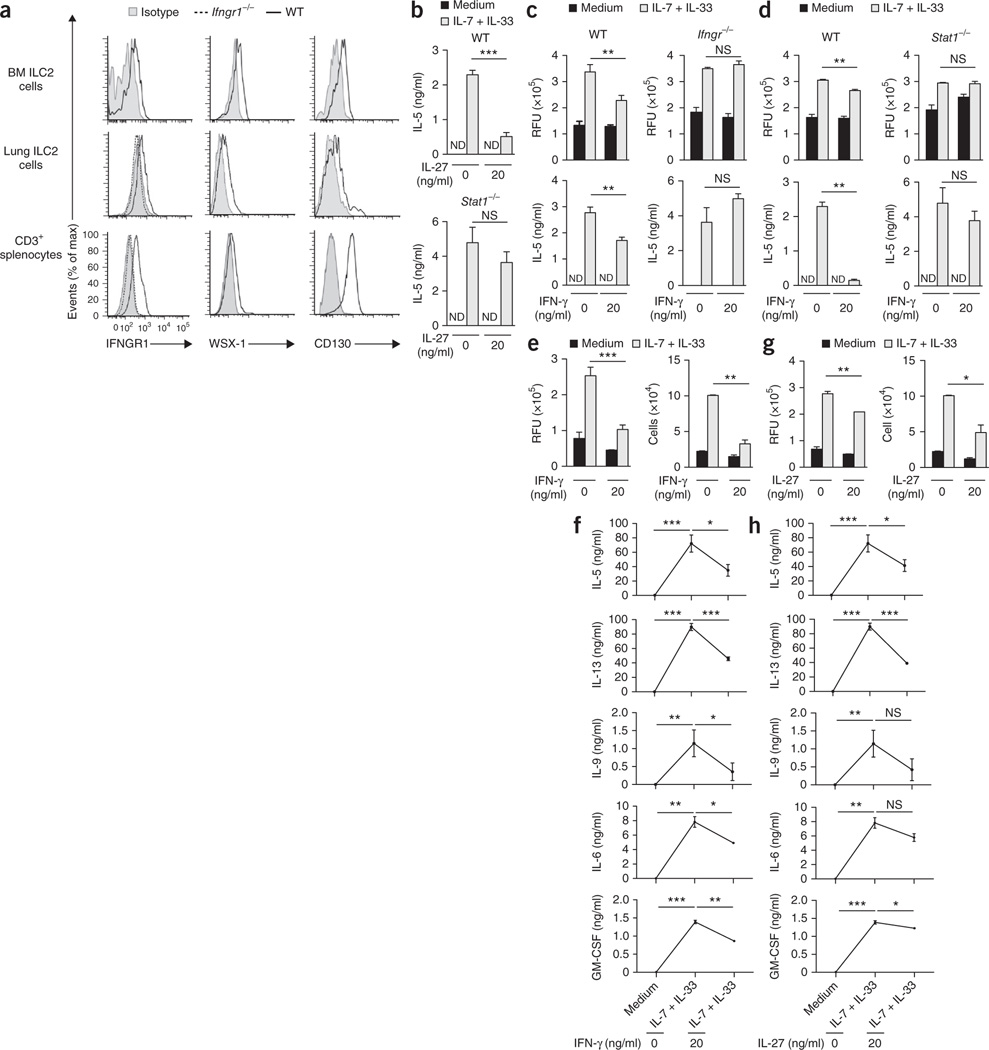
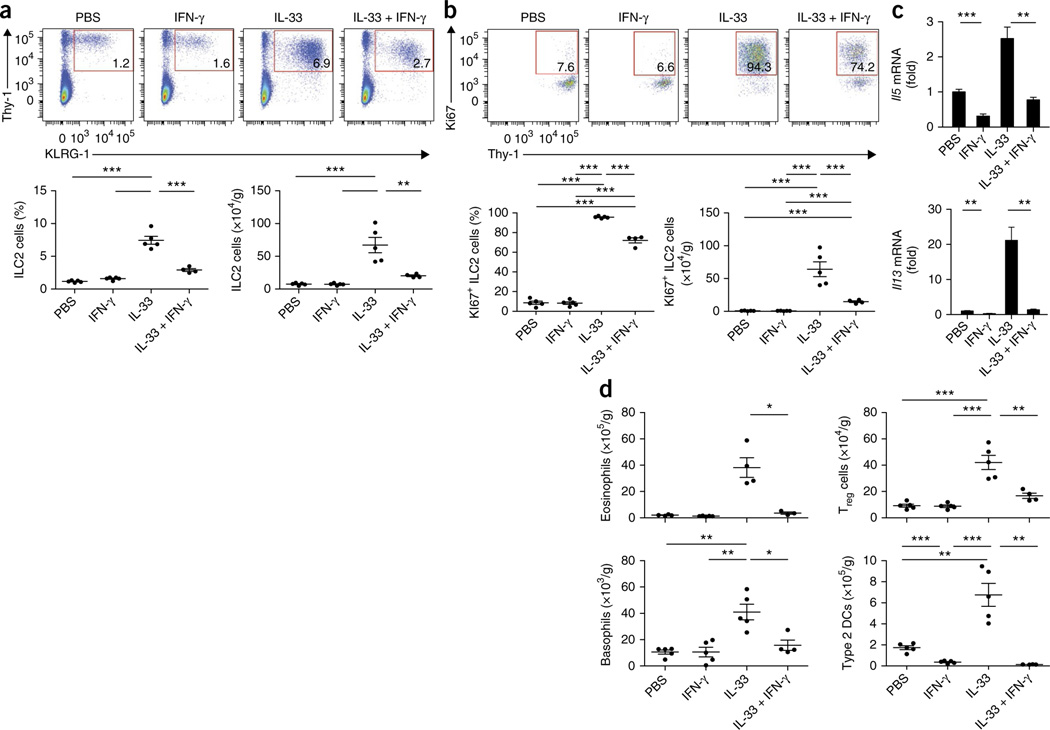
Viral respiratory tract infections are the main causative agents of the onset of infection-induced asthma and asthma exacerbations that remain mechanistically unexplained. Here we found that deficiency in signaling via type I interferon receptor led to deregulated activation of group 2 innate lymphoid cells (ILC2 cells) and infection-associated type 2 immunopathology. Type I interferons directly and negatively regulated mouse and human ILC2 cells in a manner dependent on the transcriptional activator ISGF3 that led to altered cytokine production, cell proliferation and increased cell death. In addition, interferon-γ (IFN-γ) and interleukin 27 (IL-27) altered ILC2 function dependent on the transcription factor STAT1. These results demonstrate that type I and type II interferons, together with IL-27, regulate ILC2 cells to restrict type 2 immunopathology.


Figures

Figure 1
Figure 1
Deficiency in signaling via type Is interferon receptor results in increased ILC2 cells and type 2 immunopathology. (a,b) Pathology scores, as density of inflammatory infiltration (a), and hyperplasia of alveolar type 2 pneumocytes (left), bronchial and bronchiolar epithelial hyperplasia (middle), and alveolar wall thickening and fibrosis in affected parenchyma (right) (b), in lungs obtained from wild-type (WT) C57BL/6 and Ifnar1−/− mice (age and sex matched; n = 3–7 per group) treated with PBS (Mock) or infected intranasally with 20 plaque-forming units of IAV, assessed by microcopy as in c. (c) Microscopy of sections of lungs from mice as in a,b, stained with hematoxylin and eosin (H&E) 5 d after infection, with periodic acid Schiff (PAS) 10 d after infection, or with Masson’s trichrome (MT) 15 d after infection. Scale bars, 200 μm. (d) Quantification of neutrophils and eosinophils from lungs as in a,b, assessed by flow cytometry. (e) Enzyme-linked immunosorbent assay (ELISA) of IgE in serum from mice as in a,b. (f,g) Quantitative RT-PCR analysis of the pulmonary expression of Il33 and Ifnb in mice as in a,b; results were calculated by the change-in-cycling-threshold (Ct) method and were normalized to those of the control gene Gapdh and are presented relative to those of mice treated with PBS (Mock). (h) Quantification of ILC2 cells in PBS-perfused lungs from mice as in a,b, assessed by flow cytometry. ND, not detectable. Each symbol (a,b,d,h) represents an individual mouse; small horizontal lines indicate the mean (± s.d. of triplicates). *P ≤ 0.05, **P ≤ 0.01 and ***P ≤ 0.001 (Mann-Whitney test). Data are representative of three independent experiments (mean and s.d. of triplicates in eg).
Figure 2
Figure 2
Type I interferons restrain the proliferation and cytokine production of mouse ILC2 cells. (a) Cell surface expression of IFNAR on BM ILC2 cells, lung ILC2 cells and CD3ε+ splenocytes from wild-type and Ifnar1−/−mice. Control, fluorescence minus one. (b) Viability of wild-type BM cells stimulated for 5 d in medium alone (control) or with IL-7 plus IL-33 (each at 10 ng/ml), presented as relative fluorescent units (RFU) (left), and ELISA of IL-5 and IL-13 (left vertical axis) and of IL-9 (right vertical axis) in supernatants of those cells (right). (c) Proliferation of wild-type or Ifnar1−/− BM cells stimulated for 5 d as in b in the presence (25 or 500) or absence (0) of IFN-β (25 or 500 U/ml), presented as in b (left), and ELISA of IL-5 and IL-13 in supernatants of those cells (right). (d) Proliferation (left) and quantification (middle) of BM-derived wild-type ILC2 cells stimulated for 5 d as in b, and ELISA and multiplex assay of IL-5, IL-13 and IL-9 in supernatants of those cells (right), presented as in b. (e) Proliferation, presented as in b (top left), and quantification (top middle), of BM-derived wild-type ILC2 cells stimulated for 5 d as in c, and ELISA and multiplex assay of IL-5, IL-13 and IL-9 in supernatants of those cells (right), presented as in b. (f) ELISA and multiplex assay of cytokines in supernatants of cells as in e, at day 5. (g) Intracellular IL-5 in GATA-3+ ILC2 cells among wild-type lung lymphoid cells subjected to enrichment by Percoll gradient and stimulated for 4 h as in b (left margin), alone (− PMA+I) or in combination with PMA and ionomycin (+ PMA+I) (key), with (+ IFN-β) or without (− IFN-β) the addition of IFN-β (500 U/ml) (above plots), analyzed by intracellular staining and flow cytometry. Numbers above (+ PMA+I) and below (− PMA+I) bracketed lines indicate percent IL-5+ ILC2 cells among GATA-3+ ILC2 cells. NS, not significant (P > 0.05); *P ≤ 0.05, **P ≤ 0.01 and ***P ≤ 0.001 (Mann-Whitney test). Data are representative of two (a,g) or three (bf) independent experiments (mean and s.d. of triplicates in bf).
Figure 3
Figure 3
Human ILC2 cells are regulated by type I interferons. (a) Gating strategy for ILC2 cells isolated from human cord blood, after setting of lymphocyte and singlet gates, human ILC2 cells were defined as LinFcεRICD127+CD161+CD294+ and sorted. The LinFcεRICD127+CD161CD294 cell population (non-ILC2 cells) served as a negative control. SSC, side scatter; FSC, forward scatter. (b) Multiplex assay of cytokines in supernatants of cells sorted (from n = 4 donors) as in a as ILC2 cells, and non-ILC2 cells (c), then stimulated for 5 d with medium or IL-7 plus IL-33 in the presence or absence of IFN-β (as in Fig. 2f). *P ≤ 0.05 and **P ≤ 0.01 (Mann-Whitney test). Data are representative of four experiments.
Figure 4
Figure 4
Mechanisms of type I interferon–mediated regulation of ILC2 cells. (a,b) Proliferation of BM cells obtained from wild-type and Stat4−/− mice (a) or wild-type and T-bet-deficient (Tbx21−/−) mice (b) and stimulated for 5 d with medium or IL-7 plus IL-33 in the presence or absence of IFN-β (as in Fig. 2c) (top row), and ELISA of IL-5 and IL-13 in supernatants of those cells (below). (c) Intracellular staining and flow cytometry analyzing phosphorylated (p-) STAT1 in sorted and expanded BM-derived wild-type ILC2 cells stimulated for 15 min as in a,b (left), and mean fluorescence intensity (MFI) of phosphorylated STAT1 in those cells (right). Isotype, isotype-matched control antibody. (df) Proliferation of BM cells obtained from wild-type and Stat1−/− mice (d), wild-type and Stat2−/− mice (e) or wild-type and Irf9−/− mice (f) and stimulated for 5 d with medium or IL-7 plus IL-33 (as in Fig. 2c) in the presence or absence of IFN-β (25 U/ml) (top row), and ELISA of IL-5 in supernatants of those cells (bottom row). *P ≤ 0.05, **P ≤ 0.01 and ***P ≤ 0.001 (Mann-Whitney test). Data are representative of three (a,b) or two (c,df) independent experiments (mean and s.d. (c) or mean and s.d. of triplicates (a,b,df)).
Figure 5
Figure 5
Stimulation of ILC2 cells with type I interferons reduces proliferation, viability and cytokine production. (a) Proliferation of sorted and expanded BM-derived wild-type ILC2 cells labeled with the division-tracking dye CFSE and then stimulated for 3 or 5 d (above plots) with medium or IL-7 plus IL-33 in the presence or absence of IFN-β (as in Fig. 2d), analyzed by flow cytometry. (b) Proliferation of sorted and expanded BM-derived wild-type ILC2 cells stimulated for 2 or 3 d (left margin) as in a, assessed by staining with annexin V and viability dye (LIVE/DEAD), followed by flow cytometry. (c) Expression of IL-5 and IL-13 by sorted and expanded BM-derived wild-type ILC2 cells stimulated for 3 d as in a, assessed by intracellular flow cytometry. (d) Quantification of IL-5+ and IL-13+ cells and intracellular staining of IL-5 and IL-13 (presented as mean fluorescence intensity relative to that of isotype-matched control antibody), for cells as in c. Numbers in quadrants (b,c) indicate percent cells in each. *P ≤ 0.05, **P ≤ 0.01 and ***P ≤ 0.001 (Mann-Whitney test). Data are representative of two independent experiments (mean and s.d. in d).
Figure 6
Figure 6
Type I interferons restrict ILC2 cells and type 2 immunopathology in vivo. (a) Flow cytometry (top) of lung cells from wild-type mice challenged intranasally for 3 consecutive days with PBS, IFN-β, IL-33, or IL-33 plus IFN-β (above plots), assessed 24 h after the final treatment. Numbers in outlined areas indicate percent LinKLRG1+Thy-1+ ILC2 cells. Below, frequency (left) and total number (right) of ILC2 cells as above (n = 5 mice per group; age and sex matched). (b) Flow cytometry (top) of lung cells from mice as in a. Numbers in outlined areas indicate percent pulmonary Ki67+ ILC2 cells. Below frequency (left) and total number (right) of Ki67+ ILC2 cells as above. (c) Quantitative RT-PCR analysis of Il5 and Il13 mRNA in lung tissue (left) and ELISA of IL-5 and IL-13 in bronchoalveolar lavage fluid (right) of mice as in a (mRNA results presented as in Fig. 1f,g). (d) Total eosinophils, basophils, Treg cells and type 2 DCs in mice as in a, assessed by flow cytometry. (e) Lung AHR in mice as in a, assessed as pulmonary resistance (R) after delivery of various concentrations of aerosolized methacholine (horizontal axis). (f) Frequency (top) and total number (bottom) of pulmonary ILC2 cells from Rag2−/−Il2rg−/− host mice given wild-type donor ILC2 cells (WT→Rag2−/−Il2rg−/−) or Ifnar1−/− donor ILC2 cells (Ifnar1−/−Rag2−/−Il2rg−/−), then challenged as in a, assessed by flow cytometry. Each symbol (a,b,d,f) represents an individual mouse; small horizontal lines indicate the mean (± s.d.). *P ≤ 0.05; **P ≤ 0.01 and ***P ≤ 0.001 (Mann-Whitney test (ad,f) or repeated-measures ANOVA, followed by Dunnett’s multiple-comparison test (e)). Data are representative of two experiments (ad; mean and s.d.) or one experiment (e,f; mean and s.d.).
Figure 7
Figure 7
IL-27 and IFN-γ regulate ILC2 function. (a) Cell surface expression of IFNGR1, WSX-1 and CD130 on BM and lung ILC2 cells, as well as splenocytes. (b) ELISA of IL-5 in supernatants of wild-type and Stat1−/− BM cells stimulated for 5 d with medium or with IL-7 plus IL-33 (each at 10 ng/ml) in the presence (20) or absence (0) of IL-27 (20 ng/ml). (c,d) Proliferation of wild-type and Ifngr1−/− BM cells (c) or wild-type and Stat1−/− BM cells (d) stimulated for 5 d in as in b (top row), and ELISA of IL-5 in supernatants of those cells (bottom row). (e,f) Proliferation (e, left) and quantification (e, right) of sorted and expanded BM-derived wild-type ILC2 cells stimulated for 5 d with medium or with IL-7 plus IL-33 (each at 10 ng/ml) in the presence or absence of IFN-γ (20 ng/ml), and ELISA and multiplex assay of cytokines in supernatants of cells as in e (f). (g,h) Proliferation (g, left) and quantification (g, right) of cells stimulated as in e in the presence or absence of IL-27 (20 ng/ml), and ELISA and multiplex assay of cytokines in supernatants of cells as in g (h). *P ≤ 0.05, **P ≤ 0.01 and ***P ≤ 0.001 (Mann-Whitney test). Data are representative of two (a,b) or three (ch) independent experiments (mean and s.d. of triplicates in be,g).
Figure 8
Figure 8
IFN-γ restricts ILC2 cells and type 2 immunopathology in vivo. (a) Flow cytometry (top) of lung cells from wild-type mice challenged intranasally for three consecutive days with PBS, IFN-γ, IL-33, or IL-33 plus IFN-γ (above plots), assessed 24 h after the final treatment. Numbers in outlined areas indicate percent LinKLRG1+Thy-1+ ILC2 cells. Below, frequency (left) and total number (right) of ILC2 cells as above (n = 4–5 mice per group; age and sex matched). (b) Flow cytometry (top) of lung cells from mice as in a. Numbers in outlined areas indicate percent Ki67+ ILC2 cells. Below, frequency (left) and total number (right) of Ki67+ ILC2 cells as above. (c) Quantitative RT-PCR analysis of Il5 and Il13 mRNA in lung cells from mice as in a (presented as in Fig. 1f,g). (d) Total eosinophils, basophils, type 2 DCs and Treg cells in mice as in a, assessed by flow cytometry. Each symbol (a,b,d) represents an individual mouse; small horizontal lines indicate the mean (± s.d.). *P ≤ 0.05, **P ≤ 0.01 and ***P ≤ 0.001 (Mann-Whitney test). Data are representative of two independent experiments (mean and s.d. in c).

References

    1. Gause WC, Wynn TA & Allen JE Type 2 immunity and wound healing: evolutionary refinement of adaptive immunity by helminths. Nat. Rev. Immunol. 13, 607–614 (2013). - PMC - PubMed
    1. Hoyler T. et al. The transcription factor GATA-3 controls cell fate and maintenance of type 2 innate lymphoid cells. Immunity 37, 634–648 (2012). - PMC - PubMed
    1. Spits H. et al. Innate lymphoid cells–a proposal for uniform nomenclature. Nat. Rev. Immunol. 13, 145–149 (2013). - PubMed
    1. Diefenbach A, Colonna M. & Koyasu S. Development, differentiation, and diversity of innate lymphoid cells. Immunity 41, 354–365 (2014). - PMC - PubMed
    1. McKenzie AN, Spits H. & Eberl G. Innate lymphoid cells in inflammation and immunity. Immunity 41, 366–374 (2014). - PubMed

Publication types