. 2016 Feb;17(2):179-86.
doi: 10.1038/ni.3332. Epub 2015 Nov 30.

Complementarity and redundancy of IL-22-producing innate lymphoid cells

Affiliations

Complementarity and redundancy of IL-22-producing innate lymphoid cells

Lucille C Rankin et al. Nat Immunol. 2016 Feb.

Abstract

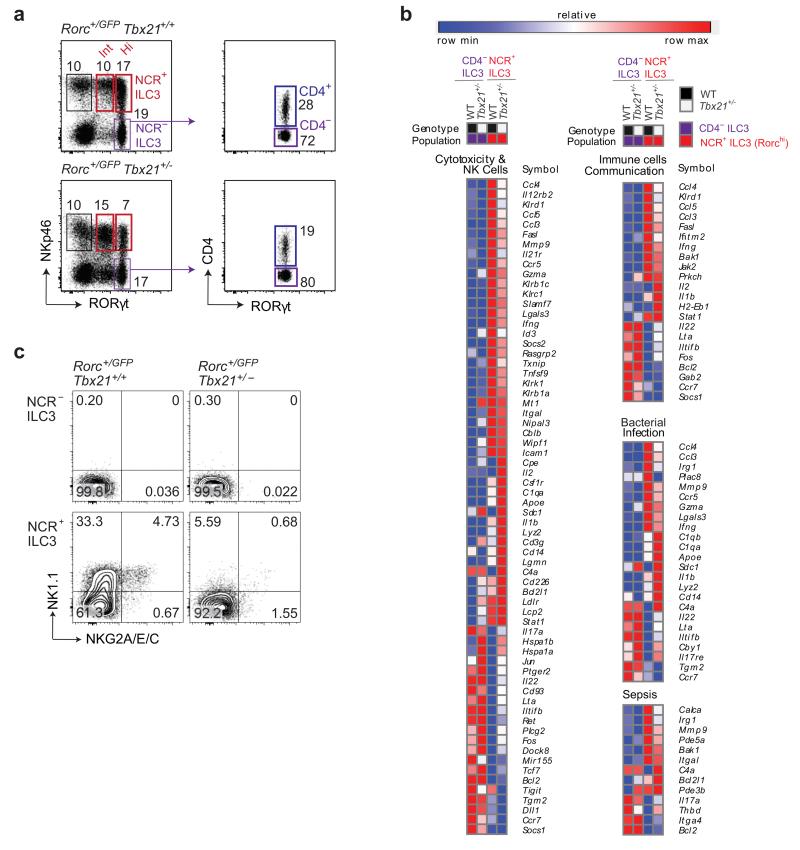
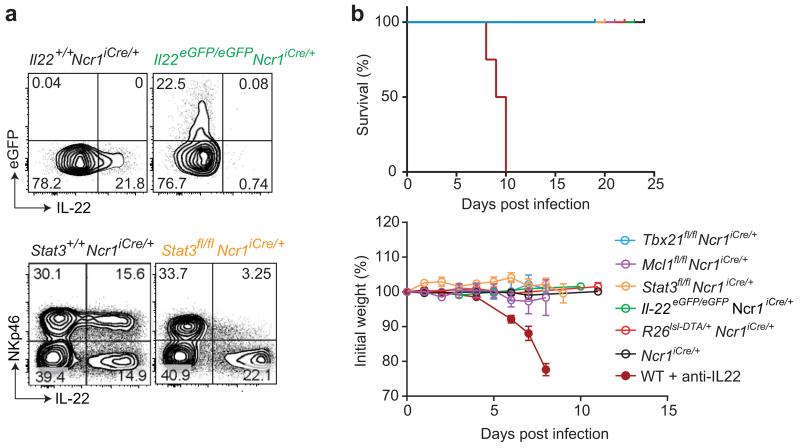
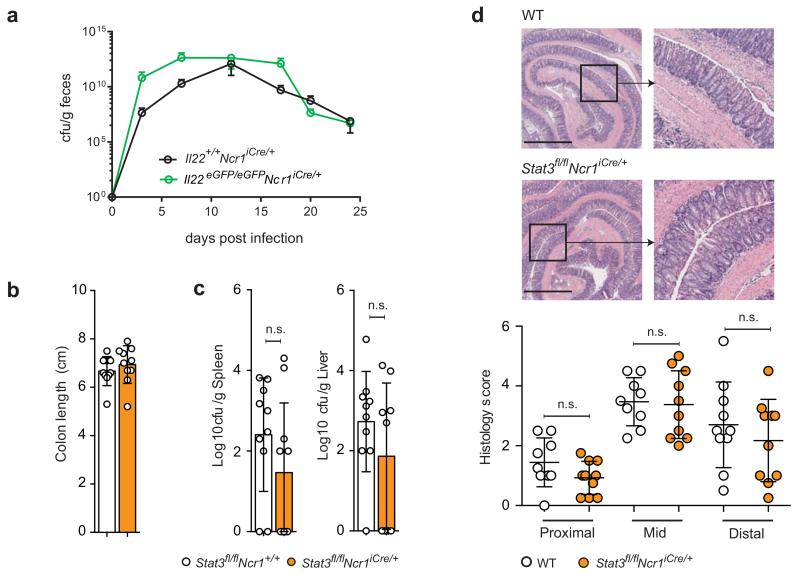
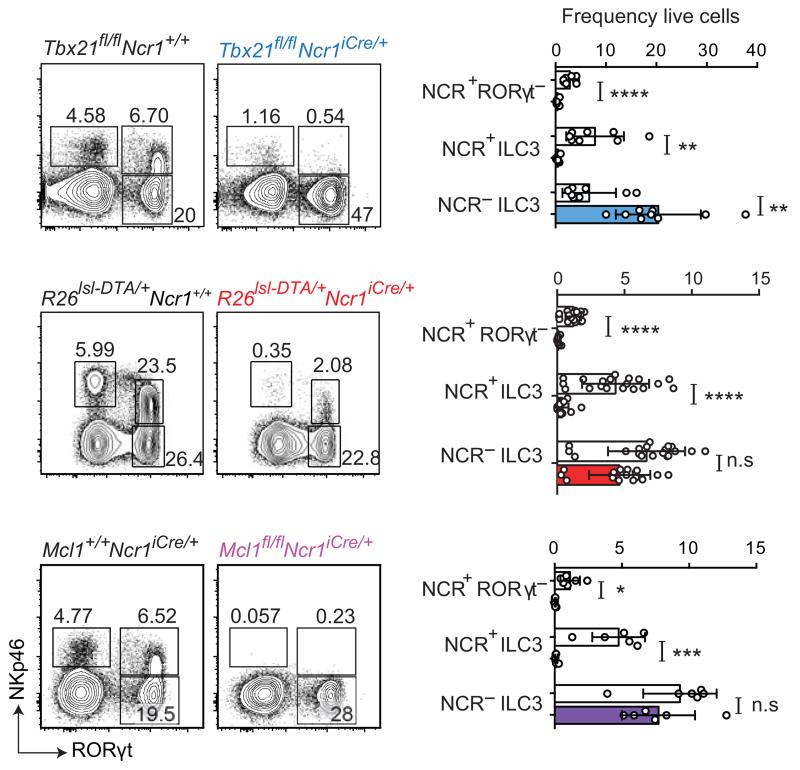
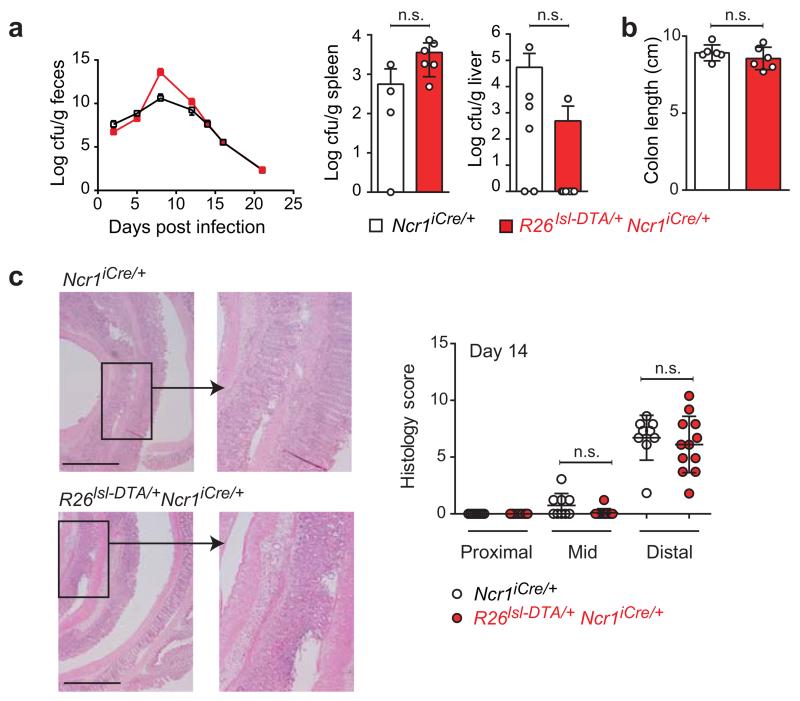
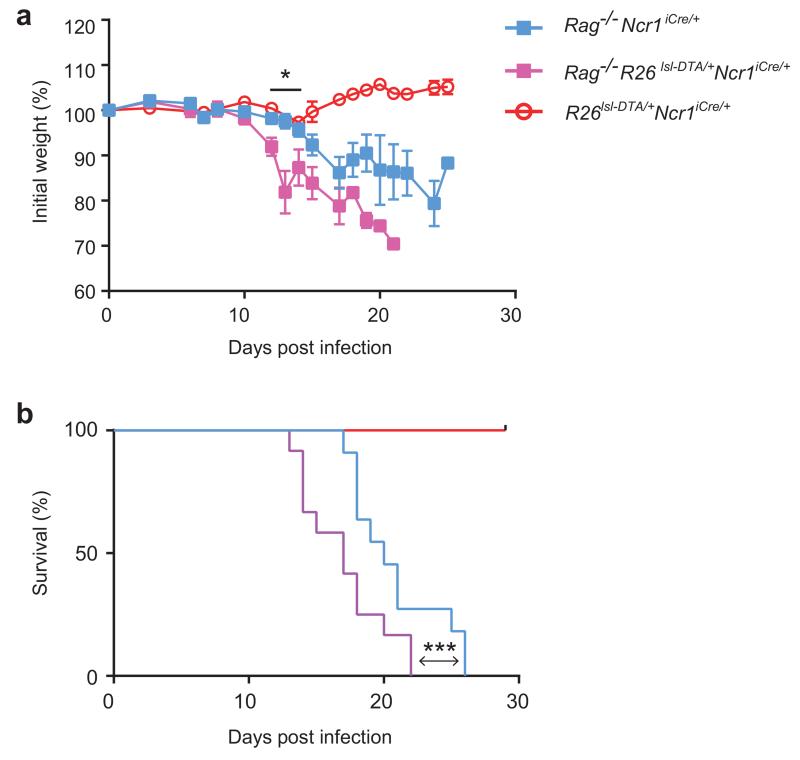
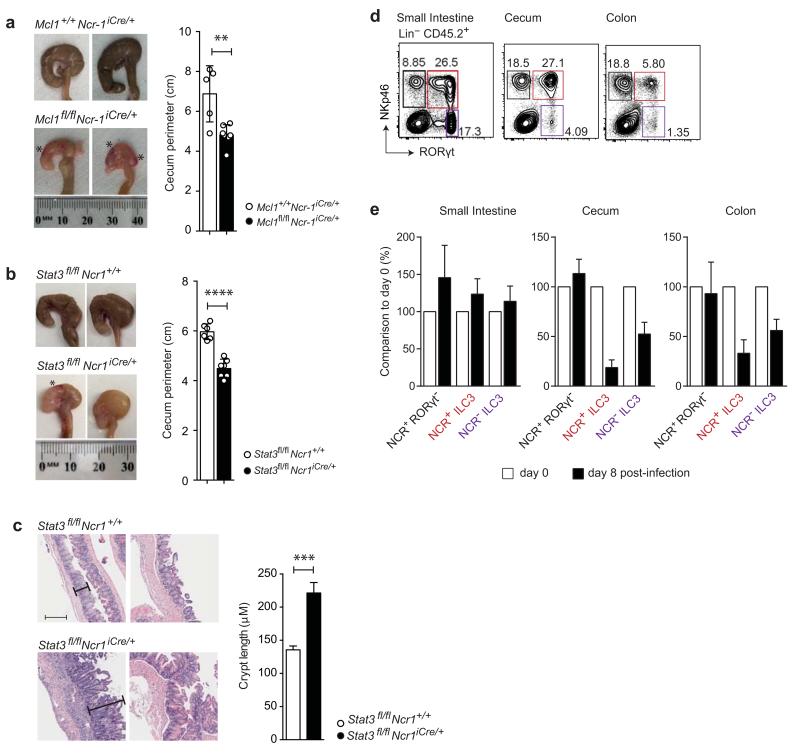
Intestinal T cells and group 3 innate lymphoid cells (ILC3 cells) control the composition of the microbiota and gut immune responses. Within the gut, ILC3 subsets coexist that either express or lack the natural cytoxicity receptor (NCR) NKp46. We identified here the transcriptional signature associated with the transcription factor T-bet-dependent differentiation of NCR(-) ILC3 cells into NCR(+) ILC3 cells. Contrary to the prevailing view, we found by conditional deletion of the key ILC3 genes Stat3, Il22, Tbx21 and Mcl1 that NCR(+) ILC3 cells were redundant for the control of mouse colonic infection with Citrobacter rodentium in the presence of T cells. However, NCR(+) ILC3 cells were essential for cecal homeostasis. Our data show that interplay between intestinal ILC3 cells and adaptive lymphocytes results in robust complementary failsafe mechanisms that ensure gut homeostasis.


Figures

Figure 1
Figure 1. RNAseq analysis of ILC3 subsets
(a) Sorting strategy for RNAseq analyses of ILC3 subsets isolated from the small intestine of Rorcgfp/+Tbx21+/+ (wild-type) after gating on live CD45+ lin(CD3CD19) cells (left plot). CD4+ NKp46 RORγt+ and CD4NKp46 RORγt+ segregated among NCR ILC3 (right plot). (b) Analyses of gene clusters regulated by T-bet between Tbx21+/+ and Tbx21+/− NCR+ ILC3 at steady state. Ingenuity pathway analysis (IPA) was carried out for genes differentially expressed between NCR and NCR+ ILC3 affected by the loss of a single copy of T-bet. Significant enrichment was observed for several pathways, grouped into three main categories: cytotoxicity & NK cells, immune cell communication and infectious disease. The expression values for the genes of these enriched pathways were converted into heat maps, using the mean and maximum values for each gene (Log2 reads per kilobase of transcript per million reads, RPKM). (c) Flow cytometry analyses of NK1.1 and NKG2A/E/C protein levels in the indicated ILC3 subsets isolated from the intestines of RorcGFP/+Tbx21+/+ and RorcGFP/+Tbx21+/− mice. Plots are gated on live CD45+lin RORγt+ cells and show one representative experiment. Numbers show the frequency of NCR+ ILC3 in the indicated quadrants. Plots show representative results from two independent experiments (n = 2-3 mice per genotype per experiment).
Figure 2
Figure 2. Targeting of NCR+ ILC3 during C. rodentium infection
(a) Upper panels show the production of IL-22 by small intestine LinCD45+NCR+ ILC3 from naive Il22eGFP/eGFPNcr1-iCre and control mice upon in vitro stimulation with IL-23 for 4-5 h in the presence of brefeldin A. The lower panels show the frequency of IL-22-producing cells among the NKp46+ and NKp46 cells gated on LinCD45.2+ small intestine lymphocytes from Stat3fl/flNcr1+/+RorcGFP/+ and Stat3fl/flNcr1-iCreRorcGFP/+ mice 8 days after C. rodentium infection. Cells were stimulated in vitro with IL-23 for 4-5 hr in the presence of brefeldin A to elicit IL-22 production. Data show representative plots from one of two independent experiments (n = 3-4 mice per genotype per experiment). (b) Survival curve and change in body weight of indicated mice and Ncr1iCre/+ controls following C. rodentium infection. In addition, WT mice were treated with anti-IL-22 blocking mAbs twice weekly, beginning on day -1. Pooled data from independent experiments are shown. The data shown are means ± SEM.
Figure 3
Figure 3. C. rodentium infection in the absence of IL-22 production by NCR+ ILC3
(a) Il22eGFP/eGFPNcr1-iCre mice and controls were orally inoculated with 1010 cfu C. rodentium on day 0. Counts of C. rodentium (cfu) in the feces are shown as a function of time post-infection. Data shown are from one out of three independent experiments (n = 4-6 mice per group per experiment). Shown are means ± SD. (b-d) Male Stat3fl/flNcr1+/+ and Stat3fl/flNcr1-iCre mice were orally inoculated with 2 × 10⁹ cfu of C. rodentium. (b) Colon length of the indicated mice 8 days after infection. Data were pooled from three independent experiments (n = 3-4 mice per group per experiment). (c) Bacterial loads (cfu/g) were measured 8 days post-infection (liver and spleen). (d) Pathological features in the colon of the indicated mice 8 days after infection. Representative H&E staining of formalin-fixed paraffin-embedded sections (micrographs) of colons and blinded histological scoring (see Supplementary Table 3). The scale bar represents 1000 μm and the insets are × 3.4 magnifications. Data were pooled from three independent experiments (n = 3-4 mice per group per experiment). The data shown are means ± SD. Statistical analyses was performed with unpaired Student’s t-tests; n.s., not statistically significant.
Figure 4
Figure 4. Impact of Tbx21 and Mcl1 deletion or DTA expression on NCR+ ILC3
Analysis of LinCD45+ small intestinal lymphocytes from naive Tbx21fl/flNcr1iCre/+, R26DTA/+Ncr1-iCre and Mcl1fl/flNcr1-iCre mice and their respective controls. Flow cytometry plots show intracellular RORγt and surface NKp46 expression. Numbers show the frequency of cells within the indicated gate. Data are pooled from at least three independent experiments (n = 2-4 mice per group per experiment) and the mean ± SD is shown. Statistical analyses were performed with unpaired Student’s t-tests. n.s., not statistically significant. *P < 0.05, **P < 0.01, ***P < 0.001 and ****P < 0.0001.
Figure 5
Figure 5. C. rodentium infection in the absence of NCR+ ILC3
R26DTA/+Ncr1-iCre and Ncr1-iCre littermates were orally inoculated with 1010 cfu C. rodentium on day 0. (a) Bacterial loads (cfu/g) were determined over the course of the experiment (feces) and at 14 days post-infection (liver and spleen). The data shown are representative of three independent experiments (n = 4-8 mice per group). (b) Colon length and (c) pathological features, for R26DTA/+Ncr1-iCre and Ncr1-iCre controls, 14 days after infection. H&E staining of formalin-fixed paraffin-embedded sections (micrographs) and histological scoring (scatter plots) of colons are shown. The scale bar represents 1000 μm and the insets are x 3.4 magnifications. Histological scores for colon damage were determined on 1- 2 H&E sections per mouse. Data are pooled from two to three independent experiments (n = 4-9 mice/genotype). Statistical analyses were performed with unpaired Student’s t-tests. n.s., not statistically significant.
Figure 6
Figure 6. Role of NCR+ ILC3 during C. rodentium infection in immunocompetent and immunodeficient hosts
Change in body weight (a) and survival curves (b) of Rag2−/−Ncr1-iCre mice, Rag2−/− R26DTA/+Ncr1-iCre and R26DTA/+Ncr1-iCre littermates following C. rodentium infection. Data are pooled from 2 independent experiments (n = 3-11 mice per genotype in total). In (a), the data shown are the means ± SEM, * P < 0.04 in unpaired Student’s t-tests comparing Rag2−/− R26DTA/+Ncr1-iCre and R26DTA/+Ncr1-iCre mice at day 12, 13 and 14 post-infection. In (b), statistical analysis was performed with Log-rank Mantel-Cox test, *** P < 0.001.
Figure 7
Figure 7. Role of NCR+ ILC3 in cecum homeostasis during C. rodentium infection
(a) Representative images of wild-type and Mcl1fl/flNcr1-iCre ceca 8 days after infection with 2 × 10⁹ cfu C. rodentium. * indicates bleeding (left). Cecum size was determined by measuring the perimeter of the organ along the antimesenteric to mesenteric borders. The histogram shows data pooled from two independent experiments (n=2-4 mice per genotype per experiment). (b) Representative images of wild-type and Stat3fl/flNcr1-iCre ceca 8 days after infection with 2 × 10⁹ cfu C. rodentium. * shows bleeding. Cecum size was determined by measuring the perimeter of the organ along the antimesenteric to mesenteric borders. The histogram shows data pooled from two independent experiments (n = 3-4 mice per genotype per experiment). (a, b) The data shown are the mean ± SD. Statistical analyses were performed with unpaired Student’s t-tests. **P < 0.01 and ****P < 0.0001. (c) Histological analysis of ceca from C57BL/6 and Stat3fl/flNcr1-iCre mice 9 days after infection. Quantification of cecum crypt length from C57BL/6 and Stat3fl/flNcr1-iCre mice (n = 8 mice per genotype in total) pooled from two independent experiments. The data shown are means ± SEM. Statistical analyses were performed with unpaired Student’s t-tests, ***P < 0.001. (d-e) Characterization of NCR+RORγt cells and ILC3 populations in different compartments of the gastrointestinal tract. (d) Representative flow cytometry plots showing RORγt-GFP and surface NKp46 expression in LinCD45+ cells isolated from the lamina propria of the small intestine, cecum and colon of naive RorcGFP/+ mice. Data is representative of two independent experiments (n=3 per group per experiment) (e) WT mice were infected with 1010 c.f.u. C. rodentium on day 0. Graphs show the ratio of the frequency of the indicated populations on day 8 post-infection (black bars) over that of day 0 (white bars). Representative data from one of two independent experiments are shown (n=6 mice) as means ± SD.

References

    1. Dudakov JA, Hanash AM, van den Brink MR. Interleukin-22: Immunobiology and Pathology. Annu Rev Immunol. 2015;33:747–85. - PMC - PubMed
    1. Spits H, Artis D, Colonna M, Diefenbach A, Di Santo JP, Eberl G, et al. Innate lymphoid cells--a proposal for uniform nomenclature. Nat Rev Immunol. 2013;13:145–149. - PubMed
    1. McKenzie AN, Spits H, Eberl G. Innate lymphoid cells in inflammation and immunity. Immunity. 2014;41:366–374. - PubMed
    1. Diefenbach A, Colonna M, Koyasu S. Development, differentiation, and diversity of innate lymphoid cells. Immunity. 2014;41:354–365. - PMC - PubMed
    1. Montaldo E, Juelke K, Romagnani C. Group 3 innate lymphoid cells (ILC3s): Origin, differentiation, and plasticity in humans and mice. Eur J Immunol. 2015;45:2171–2182. - PubMed

Publication types

MeSH terms

Substances