. 2015 Nov 24:5:17157.
doi: 10.1038/srep17157.

Targeted cellular ablation based on the morphology of malignant cells

Affiliations

Targeted cellular ablation based on the morphology of malignant cells

Jill W Ivey et al. Sci Rep. .

Abstract

Treatment of glioblastoma multiforme (GBM) is especially challenging due to a shortage of methods to preferentially target diffuse infiltrative cells, and therapy-resistant glioma stem cell populations. Here we report a physical treatment method based on electrical disruption of cells, whose action depends strongly on cellular morphology. Interestingly, numerical modeling suggests that while outer lipid bilayer disruption induced by long pulses (~100 μs) is enhanced for larger cells, short pulses (~1 μs) preferentially result in high fields within the cell interior, which scale in magnitude with nucleus size. Because enlarged nuclei represent a reliable indicator of malignancy, this suggested a means of preferentially targeting malignant cells. While we demonstrate killing of both normal and malignant cells using pulsed electric fields (PEFs) to treat spontaneous canine GBM, we proposed that properly tuned PEFs might provide targeted ablation based on nuclear size. Using 3D hydrogel models of normal and malignant brain tissues, which permit high-resolution interrogation during treatment testing, we confirmed that PEFs could be tuned to preferentially kill cancerous cells. Finally, we estimated the nuclear envelope electric potential disruption needed for cell death from PEFs. Our results may be useful in safely targeting the therapy-resistant cell niches that cause recurrence of GBM tumors.


Conflict of interest statement

R.V.D and M.B.S are inventors on pending and issued patents related to the work. The authors declare no other competing financial interest.

Figures

Figure 1
Figure 1. Finite element modeling using two pulse waveforms predicts IRE is cell size dependent while HFIRE is cell size independent.
(a) Simulated unipolar 100 μs IRE waveform and bipolar 1 μs HFIRE waveform. (b) Calculated cellular TMP response for two different cell sizes exposed to an IRE waveform applying 500 V/cm shows TMP size dependence. (c) HFIRE pulse waveform response shows no TMP cell size dependence at 500 V/cm. TMP values were calculated at a point where the cell membrane is perpendicular to the direction of the electric field.
Figure 2
Figure 2. Finite element models predict the electric field and thermal distributions within hydrogel platforms.
(a) Engineered 3D collagen hydrogels are made by adding cell-seeded collagen (0.2% or 2% w/w) into PDMS wells of controlled geometry. They are kept in a well plate under cell culture conditions with nutrients supplied by culture media. (b) Mesh used to calculate the electric field distribution within the tissue mimics illustrates the experimental setup for therapy testing. Electric field (V/cm) iso-contours when (c) 450 V and (d) 700 V pulses are simulated. (e) Temperature isocontours immediately post-therapy (50 pulses of 700 V) show a maximum temperature rise of 12 °C above room temperature. (f) Temperature isocontours one minute post-therapy confirm that cells are not exposed to any long-term thermal effects as a result of IRE or HFIRE pulses.
Figure 3
Figure 3. ECM-tuned hydrogels reveal cell size dependent IRE lesions and cell size independent HFIRE lesions.
(a) Altered cell morphology and overall cell size results from changing density of hydrogel matrix from 0.2% to 2.0% collagen (n = 25, scale bar 50 μm) (b) Comparison of IRE treatment for larger cells in 0.2% collagen reveals larger lesion and thus lower death threshold than for smaller cells in 2% collagen (n = 20, p < 0.001) (scale bar 1 mm) (c) Comparison of HFIRE treatment in 0.2% and 2% collagen reveals uniform lesions and thus equivalent death thresholds despite cell size differences. (n = 20, p ≥ 0.1) (scale bar 1 mm). (***p ≤ 0.0005 and ****p ≤ 0.0001).
Figure 4
Figure 4. Constant cell morphology with changing stiffness results in equivalent lethal thresholds for IRE and HFIRE.
(a) Changing the density of alginate does not change cell morphology due to lack of cell-ECM binding sites, allowing for isolating the effect of stiffness on treatments (n = 25) (b) IRE lesions and lethal thresholds are equivalent across stiffness differences for equivalent cell morphology (n = 20, p ≥ 0.1) (scale bar 1 mm) (c) HFIRE lesions and lethal thresholds are equivalent across alginate stiffness differences (n = 20, p ≥ 0.1) (scale bar 1 mm).
Figure 5
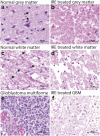
Figure 5. Histomorphology of normal and neoplastic canine brain tissues ablated with IRE.
(a) Normal, untreated cerebrocortical grey matter (c) and white matter of the internal capsule. IRE ablation results in neuronal (b) and glial death (b,d), as well as vacuolization and axonal loss (d). Biopsy of glioblastoma multiforme before (e) and after (f) IRE ablation. The IRE treatment causes disruption of tumor and stromal cytoarchitecture, and tumor cell death. All sections stained with hematoxylin and eosin.
Figure 6
Figure 6. Inner organelle effect of HFIRE predicted to allow for cell-selective differences between malignant and non-malignant cell types by affecting nuclear transmembrane potential.
(a) Numerical modeling of the electric field produced by IRE pulses predicts the electric field reaches the cytoplasm inside the cell for only a short duration of the pulse time while the majority of the electric field is retained in the media where it aggregates around the cell membrane. (b) Numerical modeling of the electric field distribution predicts the electric field produced by HFIRE pulses penetrates through the plasma membrane into the cytoplasm for the entire duration of the pulse on-time. (c) Fluorescent imaging of U-87, DBTRG, C6, NHA, D1TNC1, and PC12 cells allows for determination of shape factors to be used in modeling and to correlate to experimental lesion results. (d) U-87, DBTRG, C6, NHA, D1TNC1, and PC12 cells show no significant difference (p ≥ 0.1) in overall cell area (n = 20). (e) Nuclear area of malignant glioma cells (U-87, DBTRG, and C6) is greater than for non-malignant cells (NHA, D1TNC1, and PC12) (n = 20, **p ≤ 0.005 and ***p ≤ 0.0005).
Figure 7
Figure 7. HFIRE threshold is dependent on nuclear size, resulting in cell selective targeting.
(a) IRE lesion sizes have no significant difference across different cell types (n = 10, p ≥ 0.1). (b) HFIRE lesion size for malignant glioma cells (U-87, DBTRG, and C6) is greater than non-malignant astrocytes (NHA and D1TNC1) and neurons (PC12) (n = 10). (c) COMSOL modeling relating lesion size to death thresholds shows no significant difference between IRE thresholds for different cell types (n = 10, p ≥ 0.1), confirming the hypothesis that IRE thresholds are primarily dependent on cell size. (d) Death thresholds for malignant cells are smaller than normal cells with HFIRE treatment suggesting a range of electric field values that will kill malignant cells without killing healthy cells (n = 10, ****p ≤ 0.0001).
Figure 8
Figure 8. Co-culture treatment demonstrates equivalent lesions with IRE and selective targeting of malignant cells with HFIRE.
(a) U87 cells (green) and NHA cells (red) co-cultured in a hydrogel and treated with IRE show lethal thresholds in co-culture that match the lethal thresholds seen in monoculture with the lethal threshold of the two cell types being equivalent (scale bar 1 mm). (b) U87 cells (green) and NHA cells (red) treated with HFIRE show lethal thresholds in co-culture that match the lethal thresholds seen in monoculture with the lethal threshold of malignant U87 cells being significantly lower than that of the NHA cells resulting in a larger lesion (scale bar 1 mm).
Figure 9
Figure 9. Cell responses after treatment show difference in IRE and HFIRE mechanism.
(a) Cell exposed to IRE treatment shows a diffusion of stained tubulin from the cell cultured in a 3D hydrogel over a 5-minute time course, suggesting a disruption of the outer cell membrane as a result of pulses. (b) Cell exposed to HFIRE treatment shows a sharp collapse of the nucleus, and while tubulin staining dims, it does not clearly diffuse outside of original cell membrane area as in the IRE case. This suggests a different effect on both the nucleus and cell between IRE and HFIRE. (c) Cell not exposed to any pulses acts as a control to ensure no photo-bleaching effects from imaging over 5-minute time course. (d) Change of cytoplasm area in response to IRE and HFIRE shows a significant difference in the cytoplasmic response to therapy (n = 3, p ≤ 0.0001). Cytoplasm area increases in response to IRE as a result of tubulin diffusion, which is not present with HFIRE. (e) Change in nuclear area in response to IRE and HFIRE shows a significant difference in nuclear response to therapy (n = 3, p = 0.0066). The more drastic collapse of the nucleus with HFIRE supports a nuclear effect in HFIRE that isn’t present with IRE.
Figure 10
Figure 10. Predicted TMP and nTMP response to HFIRE experimental lethal thresholds for modeled glioma and astrocyte cells suggests a nTMP effect.
(a) Modeled cells with experimental geometries for glioma cell and astrocytes exposed to simulated HFIRE experimental lethal electric field thresholds for the given cell type show a difference in TMP increase in response. (b) Modeled cells with experimental geometries for glioma cell and astrocytes exposed to simulated HFIRE experimental lethal electric field thresholds for the given cell type show a similar nTMP increase in response, suggesting a value for nTMP increase that will cause cell death. TMPs and nTMPs presented in this figure correspond to the surface average.

References

    1. Nathanson D. A. et al. Targeted Therapy Resistance Mediated by Dynamic Regulation of Extrachromosomal Mutant EGFR DNA. Science 343, 72–76, doi: 10.1126/science.1241328 (2014). - DOI - PMC - PubMed
    1. Stommel J. M. et al. Coactivation of Receptor Tyrosine Kinases Affects the Response of Tumor Cells to Targeted Therapies. Science 318, 287–290, doi: 10.1126/science.1142946 (2007). - DOI - PubMed
    1. Siu A. et al. Radiation necrosis following treatment of high grade glioma—a review of the literature and current understanding. Acta Neurochirurgica 154, 191–201 (2012). - PubMed
    1. Crossen J. R., Garwood D., Glatstein E. & Neuwelt E. A. Neurobehavioral sequelae of cranial irradiation in adults: a review of radiation-induced encephalopathy. J Clin Oncol 12, 627–642 (1994). - PubMed
    1. Sottoriva A. et al. Intratumor heterogeneity in human glioblastoma reflects cancer evolutionary dynamics. PNAS 110, 4009–4014, doi: 10.1073/pnas.1219747110 (2013). - DOI - PMC - PubMed

Publication types